



Immune Checkpoint Inhibitors Market
Immune Checkpoint Inhibitors Market Size, Share, Insights, Competitive Landscape, and Forecast 2026 to 2033
Immune Checkpoint Inhibitors Market Size and Trend Analysis
Will Immune Checkpoint Inhibitor Revenue Keep Rising to 2033?
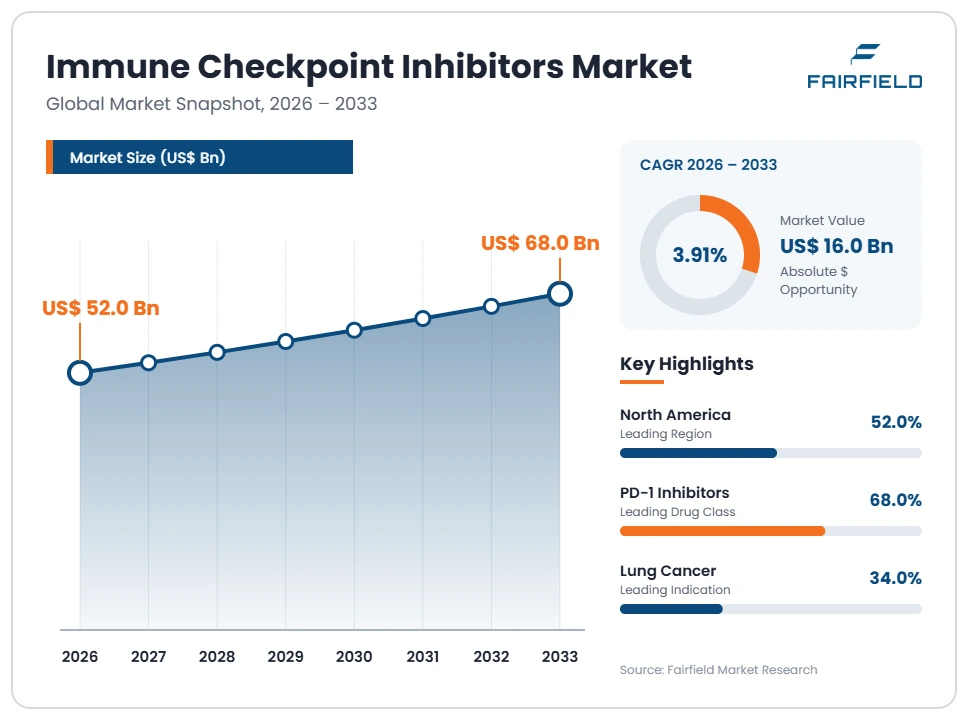
The global Immune Checkpoint Inhibitors market size is expected to be valued at US$ 52.0 billion in 2026 and projected to reach US$ 68.0 billion by 2033, growing at a CAGR of 3.91% between 2026 and 2033.
Between 2020 and 2025 the class grew at an estimated 18.0% CAGR as label-approved indications multiplied and reimbursement widened. That phase is ending. This is now one of the largest therapeutic classes in oncology by value, concentrated in a handful of very high-revenue products sold through hospital and specialty channels at prices set by national negotiation. Three forces set the slower pace: composition-of-matter protection on leading agents expiring toward the end of this decade, with biosimilar competition expected to follow; continued volume expansion into earlier settings and combination regimens; and tightening payer scrutiny of cost per treated patient. The direction of travel is rising treated volume alongside falling realised price per course.
Key Report Takeaways
- By Drug Class: PD-1 Inhibitors held 68.0% share in 2026, while Bispecific and Combination Checkpoint Agents are projected to expand at a 14.0% CAGR through 2033 from a small base as newer constructs reach commercial supply.
- By Indication: Lung Cancer held 34.0% share in 2026, while Gastrointestinal Cancers are projected to expand at a 6.2% CAGR through 2033, reflecting label expansion into tumour groups with large treated populations.
- By Line of Therapy: First-Line held 58.0% share in 2026, while Adjuvant and Neoadjuvant is projected to expand at an 8.5% CAGR through 2033, as perioperative use shifts volume into earlier settings.
- By Route of Administration: Intravenous Infusion held 94.0% share in 2026, while Subcutaneous Injection is projected to expand at a 22.0% CAGR through 2033, as fixed-dose presentations move administration out of infusion suites.
- By Distribution Channel: Hospital Pharmacies held 62.0% share in 2026, while Oncology Clinics and Infusion Centres are projected to expand at a 6.4% CAGR through 2033, following the shift of administration to lower-cost sites.
- By Region: North America held 52.0% share in 2026, while Asia Pacific is projected to expand at a 6.5% CAGR through 2033, supported by domestic manufacturing and widening public insurance listings.
Global Immune Checkpoint Inhibitors Market Trends and Insights
Drivers Impact Analysis
Two forces continue to add revenue even as the class approaches a major loss of exclusivity.
| Driver | Impact on CAGR Forecast | Geographic Relevance | Impact Timeline |
| Expansion into earlier lines, perioperative settings and combination regimens | High | North America, Europe | Medium term (2–4 years) |
| Subcutaneous reformulation and device-assisted administration changing site-of-care economics | Medium | North America, Europe, Asia Pacific | Medium term (2–4 years) |
Expansion Into Earlier Settings and Combination Regimens Raises Treated Volume Per Approval
Volume growth now comes from moving established agents into earlier settings rather than from new molecules. Label extensions into first-line use, adjuvant and neoadjuvant settings, and combination regimens enlarge the number of eligible courses without requiring a new product launch. Each extension also lengthens the average treatment duration, so revenue per approval rises even where the price per vial is unchanged.
The commercial mechanism is regulatory and contractual. A label extension triggers a new reimbursement submission, and in the European Union a joint clinical assessment under the Health Technology Assessment Regulation now accompanies that process for oncology medicines. Combination regimens raise the cost per treated patient sharply, which intensifies payer scrutiny and makes managed entry agreements, outcome-linked contracts and confidential discounts the normal commercial terms rather than the exception.
Subcutaneous Presentations and Fixed-Duration Regimens Reshape Site-of-Care Economics
Reformulation from infusion to subcutaneous administration is a recognised lifecycle strategy across large biologic classes, and it is being applied here. A subcutaneous presentation shortens the administration encounter, reduces chair time in infusion suites, and allows delivery in lower-cost settings including oncology clinics and community sites. That changes where revenue is recognised and who captures the service margin.
The driver works through provider economics and procurement. Hospitals and clinics are reimbursed differently for infusion and injection services, so a change of route alters the margin available to the administering site and the payer’s total cost. Fixed-duration regimens have a similar effect by making the cost of a course predictable, which health technology assessment bodies and national payers prefer when negotiating. Both changes also create a product differentiation route that is independent of the underlying molecule.
Restraints Impact Analysis
Two constraints hold forecast growth well below the pace of the past five years.
| Restraint | Impact on CAGR Forecast | Geographic Relevance | Impact Timeline |
| Patent expiry on leading agents and expected biosimilar entry | High | North America, Europe | Long term (≥4 years) |
| Health technology assessment delay and biomarker testing access gating use | Medium | Europe, Asia Pacific, Latin America | Long term (≥4 years) |
Patent Expiry and Expected Biosimilar Entry Will Reset Realised Prices Across the Class
The single most important thing happening to this market’s value is the approaching loss of exclusivity. Composition-of-matter protection on several leading agents expires toward the end of this decade across major markets, and biosimilar competition is widely expected to follow. The timing is uncertain, because supplementary protection certificates, paediatric extensions, formulation patents and settlement terms differ by jurisdiction, so the transition will not arrive everywhere at once.
The mechanism is legal and procurement-driven. Once a biosimilar is approved under the Biologics Price Competition and Innovation Act pathway in the United States or the European Medicines Agency framework in Europe, hospital tenders and national procurement move quickly to multi-source purchasing. Experience in other biologic classes shows realised prices falling substantially within a few tender cycles, with the steepest reductions in systems that purchase centrally. Manufacturers are planning for a class whose volume keeps rising while its value per course falls.
Assessment Delay and Uneven Biomarker Testing Access Restrict Where Volume Converts to Revenue
Approval does not create a market. In several health systems an authorised oncology medicine waits years between marketing authorisation and routine funded use, because national health technology assessment, pricing negotiation and regional formulary listing run sequentially. During that period treated volume stays low regardless of clinical interest, and access often depends on manufacturer-funded or charitable schemes rather than on reimbursement.
A second gate is testing infrastructure. Use in many label-approved settings is conditioned on a biomarker result, so volume depends on laboratories being able to perform and report that test within the treatment decision window. Testing capacity, funding for the test itself and turnaround times vary widely between and within countries. Where testing is unavailable or slow, eligible courses are never initiated, and that lost volume does not return later. Both constraints weigh most heavily outside the largest high-income markets.
Market Opportunities
Biosimilar Supply Becomes a Revenue Pool in Its Own Right After Exclusivity Ends
The loss of exclusivity that compresses originator value creates a separate business. A multi-source checkpoint inhibitor class will require large-volume monoclonal antibody supply at tender pricing, and that supply is a revenue pool distinct from the originator market. Buyers will be national procurement agencies, hospital groups and insurers, all of whom purchase on price, supply reliability and regulatory standing rather than on brand.
Capturing it requires scale and regulatory depth. Manufacturers with mammalian cell capacity, analytical comparability expertise and experience of the Biologics Price Competition and Innovation Act and European Medicines Agency biosimilar frameworks are best positioned. The European Medicines Agency and national agencies have set out their position that approved biosimilars are interchangeable with their reference products, which removes a commercial objection that slowed uptake in earlier biologic classes and shortens the switching timetable buyers can plan around.
Access Programmes and Public Listing Open Volume in Lower-Income and Emerging Markets
Markets with low current penetration hold most of the unserved volume. Treated rates in much of Asia Pacific, Latin America and Middle East & Africa are a fraction of those in high-income systems, limited by price rather than by awareness. Tiered pricing, volume-based national agreements, local licensing and domestic manufacturing can convert that gap into revenue at prices far below developed-market levels but at much greater volume.
The buyers are national insurers, ministries of health and large private hospital groups. Demand is created by expanding public insurance schemes and growing cancer registries that make budget planning possible. Supporting mechanisms include the World Health Organization Essential Medicines List process, which shapes national procurement priorities in lower-income countries, and regional regulatory reliance pathways that shorten registration timelines for products already authorised in reference jurisdictions.
Segment Analysis
- By Drug Class: PD-1 Agents Carry the Class While Bispecific Constructs Grow Fastest
PD-1 Inhibitors held 68.0% of 2026 revenue. The concentration reflects the breadth of label-approved indications accumulated by a small number of agents and their position in first-line combination regimens, which together account for the largest share of treated courses worldwide.
Bispecific and Combination Checkpoint Agents are the fastest-growing class at a 14.0% CAGR, from a small commercial base as newer constructs move from development into supply.
PD-L1 Inhibitors hold 19.0%, CTLA-4 Inhibitors 8.0%, LAG-3 Inhibitors 3.0% and bispecific agents 2.0%. CTLA-4 revenue is tied largely to combination use rather than to single-agent courses. The commercial implication is severe concentration risk: because a few PD-1 agents carry most of the value, the timing of their exclusivity loss determines the shape of the entire class, and portfolio diversification is the main defensive strategy available.
- By Indication: Lung Cancer Anchors Revenue as Gastrointestinal Tumours Add Volume
Lung Cancer accounted for 34.0% of 2026 revenue. It leads because the eligible population is very large, because checkpoint agents hold label-approved positions in both early and advanced settings, and because combination regimens in this tumour group generate long treatment durations and high cost per course.
Gastrointestinal Cancers are the fastest-growing indication group at a 6.2% CAGR, reflecting label expansion into tumour types with large treated populations, particularly across Asia Pacific.
Genitourinary Cancers hold 16.0%, gastrointestinal tumours 15.0%, Melanoma 14.0%, Head and Neck Cancers 8.0% and Other Tumour Types 13.0%. Melanoma remains commercially important despite a smaller population because the class established itself there first. The business implication is that indication mix increasingly determines regional revenue, since tumour incidence patterns differ markedly between North America, Europe and Asia Pacific.
- By Line of Therapy: First-Line Use Dominates While Perioperative Settings Expand Quickest
First-Line use held 58.0% share in 2026. Moving into first-line positions, usually in combination, was the single largest commercial change of the previous decade, because it places the product at the start of the treatment pathway and lengthens the period over which it is supplied.
Adjuvant and Neoadjuvant use is the fastest-growing setting at an 8.5% CAGR, as perioperative label extensions shift volume into earlier disease stages with larger eligible populations.
Second-Line and Later accounts for 28.0% and perioperative use 14.0%. The commercial consequence is uncomfortable for payers: earlier-setting use enlarges the treated population substantially while the cost per course stays high, so budget impact rises faster than any single price negotiation can offset. That tension is the main reason managed entry agreements and expenditure caps have become standard contracting instruments.
- By Route of Administration: Infusion Remains Standard While Subcutaneous Presentations Scale
Intravenous Infusion held 94.0% of 2026 revenue. Infusion is the established presentation for the class, infusion suite capacity and billing systems are built around it, and most label-approved regimens were registered in that form, which keeps the installed commercial model firmly in place.
Subcutaneous Injection is the fastest-growing route at a 22.0% CAGR from a small base, as fixed-dose presentations enter major markets and shorten the administration encounter.
Subcutaneous presentations account for the remaining 6.0% of 2026 revenue. Their growth matters disproportionately, because route is one of the few differentiation levers available once molecules are no longer protected. The business implication is that administration format, device partnerships and site-of-care economics will become competitive battlegrounds as originator and biosimilar products compete on otherwise comparable terms.
- By Distribution Channel: Hospital Pharmacies Lead While Clinics and Infusion Centres Gain
Hospital Pharmacies held 62.0% of 2026 revenue. Hospitals purchase, store and prepare these products under pharmacy control because they are high-cost biologics requiring compounding, cold chain and traceability, and because most administration historically occurred on hospital premises.
Oncology Clinics and Infusion Centres are the fastest-growing channel at a 6.4% CAGR, as payers push administration toward lower-cost sites and subcutaneous presentations make that shift practical.
Specialty Pharmacies hold 24.0%, clinics and infusion centres 11.0%, and Retail and Online Pharmacies 3.0%. Specialty channels handle prior authorisation, patient support and financial assistance alongside dispensing. The implication for manufacturers is a more complex channel strategy, because pricing, rebates and distribution terms differ by site of care, and a route change can move a product between channels with very different margin structures.
Geography Analysis
- Which Region Is Leading the Immune Checkpoint Inhibitors Market?
North America leads with 52.0% of global class revenue in 2026, a share far above its share of cancer incidence. The United States accounts for almost all of it, because net prices are substantially higher than elsewhere and because commercial and Medicare coverage reaches eligible patients faster than most national systems. Canada contributes a smaller, centrally negotiated stream.
Policy is now the main variable. The Inflation Reduction Act established a mechanism allowing Medicare to negotiate prices for selected high-expenditure medicines, which introduces a new form of price setting into a market that previously relied on rebate negotiation. Combined with the approaching loss of exclusivity on leading agents, this makes North America the region facing the sharpest expected change in realised price per course across the forecast period.
- Europe Access Is Determined by Joint Clinical Assessment and National Pricing Negotiation
Europe holds 24.0% of the 2026 market, well below its share of incidence. Germany, France, Italy, Spain and the United Kingdom generate most revenue, with substantial variation in time from authorisation to funded use across the region. Net prices are confidential almost everywhere and sit materially below list prices.
Two frameworks dominate. The Health Technology Assessment Regulation introduced joint clinical assessment for new oncology medicines, intended to reduce duplicated national evidence review while leaving pricing decisions with member states. National bodies then negotiate price, often with expenditure caps or outcome-linked terms. The approaching biosimilar transition matters especially here, because centralised hospital tendering tends to convert multi-source competition into price reductions faster than fragmented purchasing systems.
- Which Region Is Growing Fastest in the Immune Checkpoint Inhibitors Market?
Asia Pacific is the fastest-growing geography at a 6.5% CAGR between 2026 and 2033, from 18.0% share in 2026. China, Japan, South Korea, Australia and India drive the expansion, with China contributing the largest absolute increase through national reimbursement listings and a substantial domestic manufacturing base.
Growth comes from access rather than from price. Volume-based procurement and annual national reimbursement negotiations in China have cut unit prices sharply while expanding funded volume many times over, and domestic manufacturers supply much of that demand. Japan and South Korea operate mature reimbursement systems with regular price revision cycles. The constraint across the region is uneven biomarker testing capacity, which limits how much of the eligible population converts into treated courses.
- Latin America Uptake Depends on Public Tender Budgets and Judicial Access Routes
Latin America represents 3.5% of 2026 revenue. Brazil and Mexico supply most of it, followed by Argentina, Colombia and Chile. Public systems fund a narrow set of indications through national tenders, while private insurance and court-ordered provision account for a meaningful share of actual supply, making demand unusually difficult to forecast.
Barriers are economic and administrative. Health technology assessment capacity is limited, registration and listing timelines are long, currency movements affect import costs, and biomarker testing is concentrated in a small number of urban laboratories. Out-of-pocket payment is not realistic at current prices. The clearest opportunity is the biosimilar transition, which could bring multi-source pricing into public tenders and allow national systems to fund indications they currently exclude on budget grounds.
- Middle East & Africa Access Divides Between Gulf Funding and Minimal Coverage Elsewhere
Middle East & Africa accounts for 2.5% of the 2026 market, the smallest regional share. The Gulf Cooperation Council states, particularly Saudi Arabia and the United Arab Emirates, fund oncology care generously through public systems and buy at prices close to high-income levels. Israel, South Africa and Egypt supply most of the remaining revenue.
Across much of the continent the constraints are fundamental. Oncology services are concentrated in a few referral centres, pathology and biomarker testing capacity is scarce, cold chain and import logistics are difficult, and public budgets prioritise communicable disease and primary care. The main opportunity is the World Health Organization Essential Medicines List process and regional regulatory reliance pathways, which together could support pooled procurement of lower-cost multi-source supply once exclusivity ends.
Competitive Landscape
The immune checkpoint inhibitor market is highly concentrated. A small number of originators account for the overwhelming majority of class revenue, and two PD-1 agents alone represent a very large share of it. Concentration arose because early entrants accumulated label-approved indications faster than later ones, and because combination regimens anchored on those agents became the reference against which subsequent development was positioned. A second tier of originators competes with differentiated targets, regional strength or combination partnerships, and a third group of manufacturers, mainly based in Asia Pacific, supplies domestic markets at substantially lower prices. Consolidation has been limited among the leaders, while acquisition activity has concentrated on next-generation targets, bispecific constructs and antibody-drug conjugate assets intended to pair with checkpoint agents.
Competition is shifting away from the molecule. With several agents occupying comparable commercial positions, vendors increasingly compete on breadth of label-approved indications, administration format, duration and flexibility of regimens, contracting terms including outcome-linked and capped arrangements, patient support infrastructure, and reliability of supply for a complex large-volume biologic. In tendered systems, price and supply guarantees dominate scoring. New entrants come from two directions: biosimilar developers preparing for exclusivity expiry, and companies advancing bispecific and next-generation checkpoint constructs as a developmental category.
Strategic activity has centred on preparing for the transition. Participants have expanded mammalian cell manufacturing capacity, pursued subcutaneous and fixed-duration presentations, built combination portfolios through licensing and acquisition, and restructured commercial organisations around payer negotiation rather than prescriber promotion. Biosimilar developers have invested in analytical comparability programmes and large-scale capacity well ahead of patent expiry dates.
Strategic direction is converging on three themes: defending realised price through contracting and lifecycle management, replacing expiring revenue with adjacent oncology assets, and positioning for a multi-source market in which supply economics matter more than differentiation.
Recent Industry Developments
- March 2010: The Biologics Price Competition and Innovation Act was enacted in the United States, creating an abbreviated licensure pathway for biosimilar and interchangeable biological products – it established the legal route through which competition to this class will eventually arrive.
- July 2019: The European Union brought into application a manufacturing waiver to supplementary protection certificates, permitting production for export during the certificate term and later for day-one stockpiling – it allows biosimilar supply to be built before exclusivity ends in Europe.
- August 2022: The Inflation Reduction Act was signed into law in the United States, creating a mechanism for Medicare to negotiate prices for selected high-expenditure medicines – it introduced direct price setting into the largest market for this class.
- September 2022: The European Medicines Agency and the Heads of Medicines Agencies issued a joint statement that biosimilars approved in the European Union are interchangeable with their reference products – it removed a long-standing commercial objection to switching in tendered health systems.
- January 2025: The European Union Health Technology Assessment Regulation became applicable, requiring joint clinical assessment for new oncology medicines – it centralised part of the evidence review that determines market access while leaving pricing with member states.
Companies Covered in the Report
- Merck & Co., Inc.
- Bristol Myers Squibb Company
- F. Hoffmann-La Roche AG
- AstraZeneca plc
- Regeneron Pharmaceuticals, Inc.
- Pfizer Inc.
- Sanofi S.A.
- GSK plc
- Incyte Corporation
- BeiGene, Ltd.
- Innovent Biologics, Inc.
- Shanghai Junshi Biosciences Co., Ltd.
- Jiangsu Hengrui Pharmaceuticals Co., Ltd.
- Akeso, Inc.
Immune Checkpoint Inhibitors Market Report Scope
| Metric | Value |
| Study Period | 2020–2033 |
| Market Size 2026 | US$ 52.0 Billion |
| Market Size 2033 | US$ 68.0 Billion |
| CAGR 2026–2033 | 3.91% |
| Absolute Dollar Opportunity | US$ 16.0 Billion |
| Largest Market | North America (52.0% share in 2026) |
| Fastest-Growing Market | Asia Pacific (6.5% CAGR 2026–2033) |
| Market Concentration | High |
| Major Players | Merck & Co., Inc., Bristol Myers Squibb Company, F. Hoffmann-La Roche AG, AstraZeneca plc, Regeneron Pharmaceuticals, Inc. |
Immune Checkpoint Inhibitors Market Segmentation
Drug Class
- PD-1 Inhibitors
- PD-L1 Inhibitors
- CTLA-4 Inhibitors
- LAG-3 Inhibitors
- Bispecific and Combination Checkpoint Agents
Indication
- Lung Cancer
- Melanoma
- Genitourinary Cancers
- Gastrointestinal Cancers
- Head and Neck Cancers
- Other Tumour Types
Line of Therapy
- First-Line
- Second-Line and Later
- Adjuvant and Neoadjuvant
Route of Administration
- Intravenous Infusion
- Subcutaneous Injection
Distribution Channel
- Hospital Pharmacies
- Specialty Pharmacies
- Oncology Clinics and Infusion Centres
- Retail and Online Pharmacies
Regions
- North America
- Europe
- Asia Pacific
- Latin America
- Middle East & Africa
- Executive Summary
- Global Immune Checkpoint Inhibitors Market Snapshot
- Future Projections, 2026-2033
- Key Market Trends
- Regional Snapshot
- Market Overview
- Market Definition and Report Scope
- Historical Market Trends, 2020-2025
- Market Dynamics
- Drivers Impact Analysis
- Expansion Into Earlier Settings and Combination Regimens Raises Treated Volume Per Approval
- Subcutaneous Presentations and Fixed-Duration Regimens Reshape Site-of-Care Economics
- Restraints Impact Analysis
- Patent Expiry and Expected Biosimilar Entry Will Reset Realised Prices Across the Class
- Assessment Delay and Uneven Biomarker Testing Access Restrict Where Volume Converts to Revenue
- Market Opportunities
- Biosimilar Supply Becomes a Revenue Pool in Its Own Right After Exclusivity Ends
- Access Programmes and Public Listing Open Volume in Lower-Income and Emerging Markets
- Drivers Impact Analysis
- Global Immune Checkpoint Inhibitors Market Outlook, 2020-2033
- Global Immune Checkpoint Inhibitors Market Outlook, by Drug Class, Value (US$ Billion), 2020-2033
- PD-1 Inhibitors
- PD-L1 Inhibitors
- CTLA-4 Inhibitors
- LAG-3 Inhibitors
- Bispecific and Combination Checkpoint Agents
- Global Immune Checkpoint Inhibitors Market Outlook, by Indication, Value (US$ Billion), 2020-2033
- Lung Cancer
- Melanoma
- Genitourinary Cancers
- Gastrointestinal Cancers
- Head and Neck Cancers
- Other Tumour Types
- Global Immune Checkpoint Inhibitors Market Outlook, by Line of Therapy, Value (US$ Billion), 2020-2033
- First-Line
- Second-Line and Later
- Adjuvant and Neoadjuvant
- Global Immune Checkpoint Inhibitors Market Outlook, by Route of Administration, Value (US$ Billion), 2020-2033
- Intravenous Infusion
- Subcutaneous Injection
- Global Immune Checkpoint Inhibitors Market Outlook, by Distribution Channel, Value (US$ Billion), 2020-2033
- Hospital Pharmacies
- Specialty Pharmacies
- Oncology Clinics and Infusion Centres
- Retail and Online Pharmacies
- Global Immune Checkpoint Inhibitors Market Outlook, by Region, Value (US$ Billion), 2020-2033
- North America
- Europe
- Asia Pacific
- Latin America
- Middle East & Africa
- Global Immune Checkpoint Inhibitors Market Outlook, by Drug Class, Value (US$ Billion), 2020-2033
- North America Immune Checkpoint Inhibitors Market Outlook, 2020-2033
- North America Immune Checkpoint Inhibitors Market Outlook, by Drug Class, Value (US$ Billion), 2020-2033
- PD-1 Inhibitors
- PD-L1 Inhibitors
- CTLA-4 Inhibitors
- LAG-3 Inhibitors
- Bispecific and Combination Checkpoint Agents
- North America Immune Checkpoint Inhibitors Market Outlook, by Indication, Value (US$ Billion), 2020-2033
- Lung Cancer
- Melanoma
- Genitourinary Cancers
- Gastrointestinal Cancers
- Head and Neck Cancers
- Other Tumour Types
- North America Immune Checkpoint Inhibitors Market Outlook, by Line of Therapy, Value (US$ Billion), 2020-2033
- First-Line
- Second-Line and Later
- Adjuvant and Neoadjuvant
- North America Immune Checkpoint Inhibitors Market Outlook, by Route of Administration, Value (US$ Billion), 2020-2033
- Intravenous Infusion
- Subcutaneous Injection
- North America Immune Checkpoint Inhibitors Market Outlook, by Distribution Channel, Value (US$ Billion), 2020-2033
- Hospital Pharmacies
- Specialty Pharmacies
- Oncology Clinics and Infusion Centres
- Retail and Online Pharmacies
- North America Immune Checkpoint Inhibitors Market Outlook, by Country, Value (US$ Billion), 2020-2033
- United States Immune Checkpoint Inhibitors Market Outlook, by Drug Class, 2020-2033
- United States Immune Checkpoint Inhibitors Market Outlook, by Indication, 2020-2033
- United States Immune Checkpoint Inhibitors Market Outlook, by Line of Therapy, 2020-2033
- United States Immune Checkpoint Inhibitors Market Outlook, by Route of Administration, 2020-2033
- United States Immune Checkpoint Inhibitors Market Outlook, by Distribution Channel, 2020-2033
- Canada Immune Checkpoint Inhibitors Market Outlook, by Drug Class, 2020-2033
- Canada Immune Checkpoint Inhibitors Market Outlook, by Indication, 2020-2033
- Canada Immune Checkpoint Inhibitors Market Outlook, by Line of Therapy, 2020-2033
- Canada Immune Checkpoint Inhibitors Market Outlook, by Route of Administration, 2020-2033
- Canada Immune Checkpoint Inhibitors Market Outlook, by Distribution Channel, 2020-2033
- North America Immune Checkpoint Inhibitors Market Outlook, by Drug Class, Value (US$ Billion), 2020-2033
- Europe Immune Checkpoint Inhibitors Market Outlook, 2020-2033
- Europe Immune Checkpoint Inhibitors Market Outlook, by Drug Class, Value (US$ Billion), 2020-2033
- PD-1 Inhibitors
- PD-L1 Inhibitors
- CTLA-4 Inhibitors
- LAG-3 Inhibitors
- Bispecific and Combination Checkpoint Agents
- Europe Immune Checkpoint Inhibitors Market Outlook, by Indication, Value (US$ Billion), 2020-2033
- Lung Cancer
- Melanoma
- Genitourinary Cancers
- Gastrointestinal Cancers
- Head and Neck Cancers
- Other Tumour Types
- Europe Immune Checkpoint Inhibitors Market Outlook, by Line of Therapy, Value (US$ Billion), 2020-2033
- First-Line
- Second-Line and Later
- Adjuvant and Neoadjuvant
- Europe Immune Checkpoint Inhibitors Market Outlook, by Route of Administration, Value (US$ Billion), 2020-2033
- Intravenous Infusion
- Subcutaneous Injection
- Europe Immune Checkpoint Inhibitors Market Outlook, by Distribution Channel, Value (US$ Billion), 2020-2033
- Hospital Pharmacies
- Specialty Pharmacies
- Oncology Clinics and Infusion Centres
- Retail and Online Pharmacies
- Europe Immune Checkpoint Inhibitors Market Outlook, by Country, Value (US$ Billion), 2020-2033
- Germany Immune Checkpoint Inhibitors Market Outlook, by Drug Class, 2020-2033
- Germany Immune Checkpoint Inhibitors Market Outlook, by Indication, 2020-2033
- Germany Immune Checkpoint Inhibitors Market Outlook, by Line of Therapy, 2020-2033
- Germany Immune Checkpoint Inhibitors Market Outlook, by Route of Administration, 2020-2033
- Germany Immune Checkpoint Inhibitors Market Outlook, by Distribution Channel, 2020-2033
- France Immune Checkpoint Inhibitors Market Outlook, by Drug Class, 2020-2033
- France Immune Checkpoint Inhibitors Market Outlook, by Indication, 2020-2033
- France Immune Checkpoint Inhibitors Market Outlook, by Line of Therapy, 2020-2033
- France Immune Checkpoint Inhibitors Market Outlook, by Route of Administration, 2020-2033
- France Immune Checkpoint Inhibitors Market Outlook, by Distribution Channel, 2020-2033
- Italy Immune Checkpoint Inhibitors Market Outlook, by Drug Class, 2020-2033
- Italy Immune Checkpoint Inhibitors Market Outlook, by Indication, 2020-2033
- Italy Immune Checkpoint Inhibitors Market Outlook, by Line of Therapy, 2020-2033
- Italy Immune Checkpoint Inhibitors Market Outlook, by Route of Administration, 2020-2033
- Italy Immune Checkpoint Inhibitors Market Outlook, by Distribution Channel, 2020-2033
- Spain Immune Checkpoint Inhibitors Market Outlook, by Drug Class, 2020-2033
- Spain Immune Checkpoint Inhibitors Market Outlook, by Indication, 2020-2033
- Spain Immune Checkpoint Inhibitors Market Outlook, by Line of Therapy, 2020-2033
- Spain Immune Checkpoint Inhibitors Market Outlook, by Route of Administration, 2020-2033
- Spain Immune Checkpoint Inhibitors Market Outlook, by Distribution Channel, 2020-2033
- United Kingdom Immune Checkpoint Inhibitors Market Outlook, by Drug Class, 2020-2033
- United Kingdom Immune Checkpoint Inhibitors Market Outlook, by Indication, 2020-2033
- United Kingdom Immune Checkpoint Inhibitors Market Outlook, by Line of Therapy, 2020-2033
- United Kingdom Immune Checkpoint Inhibitors Market Outlook, by Route of Administration, 2020-2033
- United Kingdom Immune Checkpoint Inhibitors Market Outlook, by Distribution Channel, 2020-2033
- Europe Immune Checkpoint Inhibitors Market Outlook, by Drug Class, Value (US$ Billion), 2020-2033
- Asia Pacific Immune Checkpoint Inhibitors Market Outlook, 2020-2033
- Asia Pacific Immune Checkpoint Inhibitors Market Outlook, by Drug Class, Value (US$ Billion), 2020-2033
- PD-1 Inhibitors
- PD-L1 Inhibitors
- CTLA-4 Inhibitors
- LAG-3 Inhibitors
- Bispecific and Combination Checkpoint Agents
- Asia Pacific Immune Checkpoint Inhibitors Market Outlook, by Indication, Value (US$ Billion), 2020-2033
- Lung Cancer
- Melanoma
- Genitourinary Cancers
- Gastrointestinal Cancers
- Head and Neck Cancers
- Other Tumour Types
- Asia Pacific Immune Checkpoint Inhibitors Market Outlook, by Line of Therapy, Value (US$ Billion), 2020-2033
- First-Line
- Second-Line and Later
- Adjuvant and Neoadjuvant
- Asia Pacific Immune Checkpoint Inhibitors Market Outlook, by Route of Administration, Value (US$ Billion), 2020-2033
- Intravenous Infusion
- Subcutaneous Injection
- Asia Pacific Immune Checkpoint Inhibitors Market Outlook, by Distribution Channel, Value (US$ Billion), 2020-2033
- Hospital Pharmacies
- Specialty Pharmacies
- Oncology Clinics and Infusion Centres
- Retail and Online Pharmacies
- Asia Pacific Immune Checkpoint Inhibitors Market Outlook, by Country, Value (US$ Billion), 2020-2033
- China Immune Checkpoint Inhibitors Market Outlook, by Drug Class, 2020-2033
- China Immune Checkpoint Inhibitors Market Outlook, by Indication, 2020-2033
- China Immune Checkpoint Inhibitors Market Outlook, by Line of Therapy, 2020-2033
- China Immune Checkpoint Inhibitors Market Outlook, by Route of Administration, 2020-2033
- China Immune Checkpoint Inhibitors Market Outlook, by Distribution Channel, 2020-2033
- Japan Immune Checkpoint Inhibitors Market Outlook, by Drug Class, 2020-2033
- Japan Immune Checkpoint Inhibitors Market Outlook, by Indication, 2020-2033
- Japan Immune Checkpoint Inhibitors Market Outlook, by Line of Therapy, 2020-2033
- Japan Immune Checkpoint Inhibitors Market Outlook, by Route of Administration, 2020-2033
- Japan Immune Checkpoint Inhibitors Market Outlook, by Distribution Channel, 2020-2033
- South Korea Immune Checkpoint Inhibitors Market Outlook, by Drug Class, 2020-2033
- South Korea Immune Checkpoint Inhibitors Market Outlook, by Indication, 2020-2033
- South Korea Immune Checkpoint Inhibitors Market Outlook, by Line of Therapy, 2020-2033
- South Korea Immune Checkpoint Inhibitors Market Outlook, by Route of Administration, 2020-2033
- South Korea Immune Checkpoint Inhibitors Market Outlook, by Distribution Channel, 2020-2033
- Australia Immune Checkpoint Inhibitors Market Outlook, by Drug Class, 2020-2033
- Australia Immune Checkpoint Inhibitors Market Outlook, by Indication, 2020-2033
- Australia Immune Checkpoint Inhibitors Market Outlook, by Line of Therapy, 2020-2033
- Australia Immune Checkpoint Inhibitors Market Outlook, by Route of Administration, 2020-2033
- Australia Immune Checkpoint Inhibitors Market Outlook, by Distribution Channel, 2020-2033
- India Immune Checkpoint Inhibitors Market Outlook, by Drug Class, 2020-2033
- India Immune Checkpoint Inhibitors Market Outlook, by Indication, 2020-2033
- India Immune Checkpoint Inhibitors Market Outlook, by Line of Therapy, 2020-2033
- India Immune Checkpoint Inhibitors Market Outlook, by Route of Administration, 2020-2033
- India Immune Checkpoint Inhibitors Market Outlook, by Distribution Channel, 2020-2033
- Asia Pacific Immune Checkpoint Inhibitors Market Outlook, by Drug Class, Value (US$ Billion), 2020-2033
- Latin America Immune Checkpoint Inhibitors Market Outlook, 2020-2033
- Latin America Immune Checkpoint Inhibitors Market Outlook, by Drug Class, Value (US$ Billion), 2020-2033
- PD-1 Inhibitors
- PD-L1 Inhibitors
- CTLA-4 Inhibitors
- LAG-3 Inhibitors
- Bispecific and Combination Checkpoint Agents
- Latin America Immune Checkpoint Inhibitors Market Outlook, by Indication, Value (US$ Billion), 2020-2033
- Lung Cancer
- Melanoma
- Genitourinary Cancers
- Gastrointestinal Cancers
- Head and Neck Cancers
- Other Tumour Types
- Latin America Immune Checkpoint Inhibitors Market Outlook, by Line of Therapy, Value (US$ Billion), 2020-2033
- First-Line
- Second-Line and Later
- Adjuvant and Neoadjuvant
- Latin America Immune Checkpoint Inhibitors Market Outlook, by Route of Administration, Value (US$ Billion), 2020-2033
- Intravenous Infusion
- Subcutaneous Injection
- Latin America Immune Checkpoint Inhibitors Market Outlook, by Distribution Channel, Value (US$ Billion), 2020-2033
- Hospital Pharmacies
- Specialty Pharmacies
- Oncology Clinics and Infusion Centres
- Retail and Online Pharmacies
- Latin America Immune Checkpoint Inhibitors Market Outlook, by Country, Value (US$ Billion), 2020-2033
- Brazil Immune Checkpoint Inhibitors Market Outlook, by Drug Class, 2020-2033
- Brazil Immune Checkpoint Inhibitors Market Outlook, by Indication, 2020-2033
- Brazil Immune Checkpoint Inhibitors Market Outlook, by Line of Therapy, 2020-2033
- Brazil Immune Checkpoint Inhibitors Market Outlook, by Route of Administration, 2020-2033
- Brazil Immune Checkpoint Inhibitors Market Outlook, by Distribution Channel, 2020-2033
- Mexico Immune Checkpoint Inhibitors Market Outlook, by Drug Class, 2020-2033
- Mexico Immune Checkpoint Inhibitors Market Outlook, by Indication, 2020-2033
- Mexico Immune Checkpoint Inhibitors Market Outlook, by Line of Therapy, 2020-2033
- Mexico Immune Checkpoint Inhibitors Market Outlook, by Route of Administration, 2020-2033
- Mexico Immune Checkpoint Inhibitors Market Outlook, by Distribution Channel, 2020-2033
- Argentina Immune Checkpoint Inhibitors Market Outlook, by Drug Class, 2020-2033
- Argentina Immune Checkpoint Inhibitors Market Outlook, by Indication, 2020-2033
- Argentina Immune Checkpoint Inhibitors Market Outlook, by Line of Therapy, 2020-2033
- Argentina Immune Checkpoint Inhibitors Market Outlook, by Route of Administration, 2020-2033
- Argentina Immune Checkpoint Inhibitors Market Outlook, by Distribution Channel, 2020-2033
- Colombia Immune Checkpoint Inhibitors Market Outlook, by Drug Class, 2020-2033
- Colombia Immune Checkpoint Inhibitors Market Outlook, by Indication, 2020-2033
- Colombia Immune Checkpoint Inhibitors Market Outlook, by Line of Therapy, 2020-2033
- Colombia Immune Checkpoint Inhibitors Market Outlook, by Route of Administration, 2020-2033
- Colombia Immune Checkpoint Inhibitors Market Outlook, by Distribution Channel, 2020-2033
- Chile Immune Checkpoint Inhibitors Market Outlook, by Drug Class, 2020-2033
- Chile Immune Checkpoint Inhibitors Market Outlook, by Indication, 2020-2033
- Chile Immune Checkpoint Inhibitors Market Outlook, by Line of Therapy, 2020-2033
- Chile Immune Checkpoint Inhibitors Market Outlook, by Route of Administration, 2020-2033
- Chile Immune Checkpoint Inhibitors Market Outlook, by Distribution Channel, 2020-2033
- Latin America Immune Checkpoint Inhibitors Market Outlook, by Drug Class, Value (US$ Billion), 2020-2033
- Middle East & Africa Immune Checkpoint Inhibitors Market Outlook, 2020-2033
- Middle East & Africa Immune Checkpoint Inhibitors Market Outlook, by Drug Class, Value (US$ Billion), 2020-2033
- PD-1 Inhibitors
- PD-L1 Inhibitors
- CTLA-4 Inhibitors
- LAG-3 Inhibitors
- Bispecific and Combination Checkpoint Agents
- Middle East & Africa Immune Checkpoint Inhibitors Market Outlook, by Indication, Value (US$ Billion), 2020-2033
- Lung Cancer
- Melanoma
- Genitourinary Cancers
- Gastrointestinal Cancers
- Head and Neck Cancers
- Other Tumour Types
- Middle East & Africa Immune Checkpoint Inhibitors Market Outlook, by Line of Therapy, Value (US$ Billion), 2020-2033
- First-Line
- Second-Line and Later
- Adjuvant and Neoadjuvant
- Middle East & Africa Immune Checkpoint Inhibitors Market Outlook, by Route of Administration, Value (US$ Billion), 2020-2033
- Intravenous Infusion
- Subcutaneous Injection
- Middle East & Africa Immune Checkpoint Inhibitors Market Outlook, by Distribution Channel, Value (US$ Billion), 2020-2033
- Hospital Pharmacies
- Specialty Pharmacies
- Oncology Clinics and Infusion Centres
- Retail and Online Pharmacies
- Middle East & Africa Immune Checkpoint Inhibitors Market Outlook, by Country and Subregion, Value (US$ Billion), 2020-2033
- Gulf Cooperation Council Immune Checkpoint Inhibitors Market Outlook, by Drug Class, 2020-2033
- Gulf Cooperation Council Immune Checkpoint Inhibitors Market Outlook, by Indication, 2020-2033
- Gulf Cooperation Council Immune Checkpoint Inhibitors Market Outlook, by Line of Therapy, 2020-2033
- Gulf Cooperation Council Immune Checkpoint Inhibitors Market Outlook, by Route of Administration, 2020-2033
- Gulf Cooperation Council Immune Checkpoint Inhibitors Market Outlook, by Distribution Channel, 2020-2033
- Saudi Arabia Immune Checkpoint Inhibitors Market Outlook, by Drug Class, 2020-2033
- Saudi Arabia Immune Checkpoint Inhibitors Market Outlook, by Indication, 2020-2033
- Saudi Arabia Immune Checkpoint Inhibitors Market Outlook, by Line of Therapy, 2020-2033
- Saudi Arabia Immune Checkpoint Inhibitors Market Outlook, by Route of Administration, 2020-2033
- Saudi Arabia Immune Checkpoint Inhibitors Market Outlook, by Distribution Channel, 2020-2033
- United Arab Emirates Immune Checkpoint Inhibitors Market Outlook, by Drug Class, 2020-2033
- United Arab Emirates Immune Checkpoint Inhibitors Market Outlook, by Indication, 2020-2033
- United Arab Emirates Immune Checkpoint Inhibitors Market Outlook, by Line of Therapy, 2020-2033
- United Arab Emirates Immune Checkpoint Inhibitors Market Outlook, by Route of Administration, 2020-2033
- United Arab Emirates Immune Checkpoint Inhibitors Market Outlook, by Distribution Channel, 2020-2033
- Israel Immune Checkpoint Inhibitors Market Outlook, by Drug Class, 2020-2033
- Israel Immune Checkpoint Inhibitors Market Outlook, by Indication, 2020-2033
- Israel Immune Checkpoint Inhibitors Market Outlook, by Line of Therapy, 2020-2033
- Israel Immune Checkpoint Inhibitors Market Outlook, by Route of Administration, 2020-2033
- Israel Immune Checkpoint Inhibitors Market Outlook, by Distribution Channel, 2020-2033
- South Africa Immune Checkpoint Inhibitors Market Outlook, by Drug Class, 2020-2033
- South Africa Immune Checkpoint Inhibitors Market Outlook, by Indication, 2020-2033
- South Africa Immune Checkpoint Inhibitors Market Outlook, by Line of Therapy, 2020-2033
- South Africa Immune Checkpoint Inhibitors Market Outlook, by Route of Administration, 2020-2033
- South Africa Immune Checkpoint Inhibitors Market Outlook, by Distribution Channel, 2020-2033
- Egypt Immune Checkpoint Inhibitors Market Outlook, by Drug Class, 2020-2033
- Egypt Immune Checkpoint Inhibitors Market Outlook, by Indication, 2020-2033
- Egypt Immune Checkpoint Inhibitors Market Outlook, by Line of Therapy, 2020-2033
- Egypt Immune Checkpoint Inhibitors Market Outlook, by Route of Administration, 2020-2033
- Egypt Immune Checkpoint Inhibitors Market Outlook, by Distribution Channel, 2020-2033
- Middle East & Africa Immune Checkpoint Inhibitors Market Outlook, by Drug Class, Value (US$ Billion), 2020-2033
- Competitive Landscape
- Market Concentration and Industry Leaders
- Competitive Differentiation
- Strategic Initiatives
- Recent Industry Developments
- Company Profiles
- Merck & Co., Inc.
- Bristol Myers Squibb Company
- F. Hoffmann-La Roche AG
- AstraZeneca plc
- Regeneron Pharmaceuticals, Inc.
- Pfizer Inc.
- Sanofi S.A.
- GSK plc
- Incyte Corporation
- BeiGene, Ltd.
- Innovent Biologics, Inc.
- Shanghai Junshi Biosciences Co., Ltd.
- Jiangsu Hengrui Pharmaceuticals Co., Ltd.
- Akeso, Inc.
- Appendix
- Research Methodology
- Report Assumptions
- Acronyms and Abbreviations
Drug Class
- PD-1 Inhibitors
- PD-L1 Inhibitors
- CTLA-4 Inhibitors
- LAG-3 Inhibitors
- Bispecific and Combination Checkpoint Agents
Indication
- Lung Cancer
- Melanoma
- Genitourinary Cancers
- Gastrointestinal Cancers
- Head and Neck Cancers
- Other Tumour Types
Line of Therapy
- First-Line
- Second-Line and Later
- Adjuvant and Neoadjuvant
Route of Administration
- Intravenous Infusion
- Subcutaneous Injection
Distribution Channel
- Hospital Pharmacies
- Specialty Pharmacies
- Oncology Clinics and Infusion Centres
- Retail and Online Pharmacies
Regions
- North America
- Europe
- Asia Pacific
- Latin America
- Middle East & Africa
Our Research Methodology
Considering the volatility of business today, traditional approaches to strategizing a game plan can be unfruitful if not detrimental. True ambiguity is no way to determine a forecast. A myriad of predetermined factors must be accounted for such as the degree of risk involved, the magnitude of circumstances, as well as conditions or consequences that are not known or unpredictable. To circumvent binary views that cast uncertainty, the application of market research intelligence to strategically posture, move, and enable actionable outcomes is necessary.
View Methodology
Quality Assured
Rigorous Validation Process

Confidentiality Assured
End-to-end Data Security

Custom Research Services
Tailored To Your Objectives
FAQs
The class is valued at US$ 52.0 billion in 2026, covering PD-1, PD-L1, CTLA-4, LAG-3 and bispecific checkpoint agents sold worldwide.
Revenue is forecast to reach US$ 68.0 billion by 2033 at a 3.91% CAGR, an absolute dollar opportunity of US$ 16.0 billion.
Composition-of-matter protection on leading agents expires toward the end of this decade, and expected biosimilar competition is forecast to reduce realised prices.
Asia Pacific grows fastest at a 6.5% CAGR, driven by national reimbursement listings, volume-based procurement and a large domestic manufacturing base.
Concentration is high, as a small number of originators hold most class revenue, though biosimilar entry is expected to broaden supply materially.
Related Reports
Geriatric Medicines Market Size, Share, Insights, Competitive Landscape, and Forecast 2026 to 2033
The global geriatric medicines market is valued at US$412.0 billion in 2026, reaching US$538.0 billion by 2033, growing at a 3.9% CAGR
Pharmaceutical Temperature Controlled Packaging Solutions Market Size, Share, Insights, Competitive Landscape, and Forecast 2026 to 2033
Pharmaceutical temperature controlled packaging solutions market to grow from US$ 6.86 billion in 2026 to US$ 13.98 billion by 2033 at a 10.7% CAGR.
Dermatology CRO Market Size, Share, Insights, Competitive Landscape, and Forecast 2026 to 2033
Explore the dermatology CRO market, projected to reach US$ 9.7 billion by 2033 at a 6.6% CAGR, with service, indication and regional insights.
Acetaminophen Market Size, Share, Insights, Competitive Landscape, and Forecast 2026 to 2033
The global acetaminophen market is valued at US$11.70 billion in 2026, reaching US$15.93 billion by 2033, growing at a 4.5% CAGR
Allergy Diagnostics and Therapeutics Market Size, Share, Insights, Competitive Landscape, and Forecast 2026 to 2033
The global allergy diagnostics and therapeutics market is valued at US$41.50 billion in 2026, reaching US$88.30 billion by 2033, growing at an 11.4% CAGR
Homeopathic Products Market Size, Share, Insights, Competitive Landscape, and Forecast 2026 to 2033
The global homeopathic products market is valued at US$59.45 billion in 2026, reaching US$169.21 billion by 2033, growing at a 16.1% CAGR