



Geriatric Medicines Market
Geriatric Medicines Market Size, Share, Insights, Competitive Landscape, and Forecast 2026 to 2033
Geriatric Medicines Market Size and Trend Analysis
How Fast Will the Geriatric Medicines Market Grow by 2033?
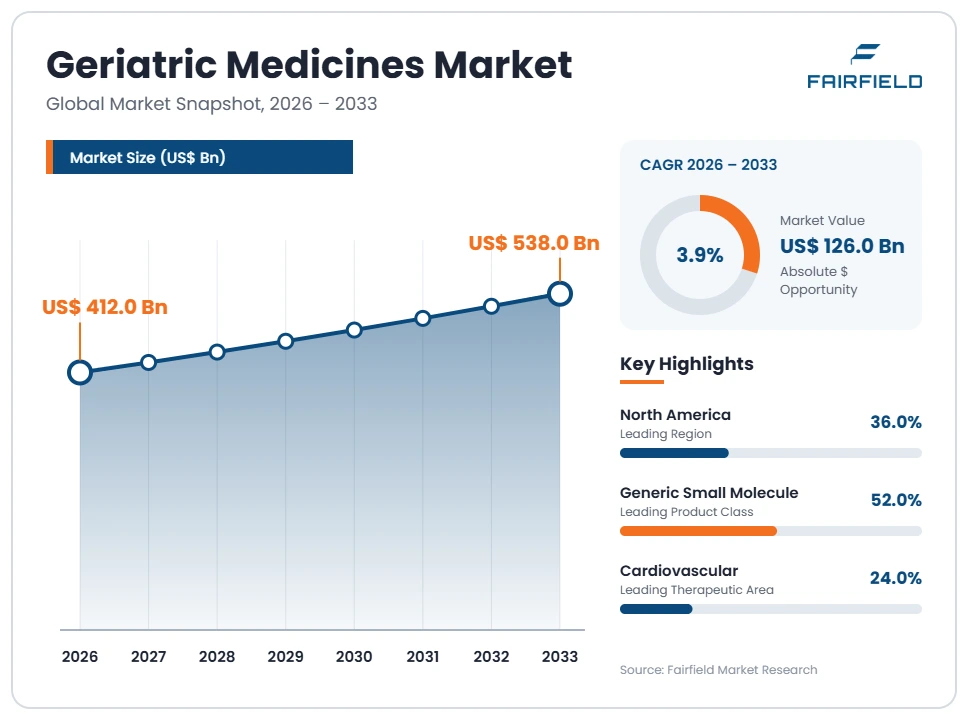
The global geriatric medicines market size is expected to be valued at US$ 412.0 billion in 2026 and projected to reach US$ 538.0 billion by 2033, growing at a CAGR of 3.9% between 2026 and 2033.
Between 2020 and 2025 the market expanded at a measured 3.2% annual rate, ending at US$ 398.0 billion. Three forces carry the forecast. The population above 65 years is growing in every large health system, lifting prescription volumes. Long-term maintenance therapy now dominates cardiovascular, metabolic and neurological care. Biosimilar entry has widened payer access to biologics inside fixed budgets. Value growth stays modest because the volume base is overwhelmingly generic and reimbursed, while reference pricing, tendering and health technology assessment compress unit prices each year. Health systems also run deprescribing and medication review programmes that cut medicines taken per patient. The outcome is more patients, more cautious prescribing, and value growth concentrated in a few high-cost classes.
Key Report Takeaways
- By Therapeutic Area: Cardiovascular held 24% share in 2026, while Central Nervous System is projected to expand at a 5.9% CAGR through 2033, driven by dementia and Parkinson’s disease therapies that payers assess under managed-entry agreements.
- By Product Class: Generic Small Molecule held 52% share in 2026, while Biosimilar is projected to expand at a 9.1% CAGR through 2033, driven by patent expiry on reference biologics and tender-based substitution in public systems.
- By Formulation and Delivery Format: Conventional Oral Solid held 54% share in 2026, while Prefilled Device is projected to expand at a 6.9% CAGR through 2033, driven by grip and dexterity design requirements written into device specifications.
- By Distribution Channel: Retail Pharmacy held 46% share in 2026, while Online Pharmacy is projected to expand at an 8.4% CAGR through 2033, driven by repeat-prescription fulfilment and home delivery of chronic maintenance therapy.
- By Geography: North America held 36% share in 2026, while Asia Pacific is projected to expand at a 5.6% CAGR through 2033, driven by insurance expansion in rapidly ageing middle-income health systems.
Global Geriatric Medicines Market Trends and Insights
Drivers Impact Analysis
Two forces account for most of the volume and value movement in medicines prescribed to older patients.
| Driver | Impact on CAGR Forecast | Geographic Relevance | Impact Timeline |
| Growth in the population above 65 years with multiple long-term conditions | High | Global, strongest in Europe, Japan and China | Long term ≥4 years |
| Biosimilar entry widening payer access to high-cost biologics | Medium | North America and Europe | Medium term 2–4 years |
Expanding Numbers of Older Patients With Multiple Long-Term Conditions Lift Geriatric Medicine Volumes
Prescription volumes for older patients rise faster than the population itself, because the share of people living with two or more long-term conditions increases with age. Cardiovascular disease, diabetes, osteoporosis, chronic respiratory disease and cognitive disorders frequently occur together in the same patient record. Each condition carries its own guideline-based therapy, so a single person may hold several concurrent prescriptions. That arithmetic, rather than any single product, sets the underlying volume base.
The mechanism is demographic and clinical at once. National statistical offices in Japan, Italy, Germany and China record steadily larger cohorts above 65, and public insurance covers most of their outpatient medicines. Guideline bodies have extended secondary prevention and chronic disease management into later life, so therapy continues for years rather than months. World Health Organization work on medication safety in polypharmacy documents the scale of concurrent prescribing in this group.
Biosimilar Entry Widens Payer Access to Biologics Prescribed to Older Patients
Biosimilars are the clearest source of real access growth in this market. When a reference biologic loses exclusivity, public payers and hospital tenders move quickly, and treatment that was previously restricted by budget caps becomes available to a wider group of older patients. Oncology, inflammatory disease and ophthalmology have all seen this pattern. Volume rises sharply even as the value per treated patient falls, which is exactly the shape payers want.
The causal mechanism sits in procurement rules. Hospital and regional tenders in Europe award on price once interchangeability is established, and national authorities publish substitution frameworks that give pharmacists clear authority. The European Medicines Agency maintains a biosimilar regulatory pathway that has now been applied across many molecule classes. Each new entrant resets the reference price for its class, which releases budget that funds additional treated patients.
Restraints Impact Analysis
Two structural restraints hold value growth well below volume growth in this market.
| Restraint | Impact on CAGR Forecast | Geographic Relevance | Impact Timeline |
| Reference pricing, tendering and health technology assessment | High | Europe, Asia Pacific, North America | Short term ≤2 years |
| Deprescribing policy and limited trial evidence in older patients | Medium | Global, strongest in North America and Europe | Medium term 2–4 years |
Reference Pricing and Tendering Cap Value Growth Across Reimbursed Geriatric Medicine Portfolios
Price regulation is the single largest brake on value in this market. Most medicines taken by older patients are dispensed inside a reimbursement scheme, and that scheme sets the price rather than the manufacturer. Internal and external reference pricing, therapeutic cluster pricing and annual clawback mechanisms all push realised prices down each year. Suppliers can grow units and still report flat revenue in a given country.
The cost source is specific and recurring. Health technology assessment bodies in Europe and Asia Pacific benchmark new medicines against the cheapest clinically relevant comparator, which is usually a generic. The US Inflation Reduction Act created a Medicare drug price negotiation mechanism and redesigned the Part D benefit, placing selected high-spend products under negotiated maximum fair prices. Tender awards in Germany, Italy and Brazil are decided largely on price, leaving thin gross margins on mature molecules.
Deprescribing Policy and Thin Trial Evidence in Older Patients Constrain Prescription Growth
Health systems are actively trying to reduce the number of medicines each older patient takes. Structured medication review, deprescribing guidance and potentially inappropriate prescribing criteria are now embedded in primary care contracts and hospital discharge processes in several countries. These programmes work in the opposite direction to demographic growth. A manufacturer can face an expanding patient population and a shrinking number of prescriptions per patient at the same time.
The second cause is evidential. Regulators have documented for years that older patients are underrepresented in clinical trials, which complicates labelling, dosing statements and benefit assessment for this population. The ICH E7 guideline on studies in support of special populations and the European Medicines Agency reflection paper on the pharmaceutical development of medicines for older people both address this gap. Where evidence is thin, payers restrict use, and formulation design must also account for swallowing and dexterity requirements.
Market Opportunities
Age-Appropriate Formulations and Prefilled Devices Open a Differentiated Revenue Pool
Formulation and device design is one of the few places in this market where a supplier can earn a premium on an off-patent molecule. Orodispersible tablets, oral liquids and suspensions, transdermal patches and prefilled devices with larger grips and lower activation force address documented handling and administration requirements. Fixed-dose combinations that reduce the daily tablet count serve the same purpose from a different direction. Each of these carries its own regulatory dossier and a defensible price.
The buyers are procurement bodies, long-term care operators and hospital pharmacies, which increasingly write handling characteristics into tender specifications. The European Medicines Agency geriatric medicines strategy and its reflection paper on pharmaceutical development for older people give manufacturers an explicit framework for this work. Device engineering, child-resistant yet accessible closures and clear labelling are the practical levers, and they apply across cardiovascular, musculoskeletal and diabetes portfolios.
Rapidly Ageing Middle-Income Health Systems Create New Reimbursed Demand Pools
The largest untapped volume sits in middle-income countries that are ageing faster than they are building reimbursement capacity. China, Brazil, Thailand, Türkiye and Mexico are all expanding outpatient medicine coverage while their populations above 65 grow quickly. Each incremental listing on a national reimbursement formulary converts a cash-pay patient group into a funded one, which is a step change in addressable volume rather than a gradual trend.
Generic and biosimilar manufacturers are best placed to capture this, because listings in these systems are decided largely on budget impact. Local manufacturing partnerships and regional tender participation are the usual routes in. Centralised procurement in China has already moved large chronic disease categories onto volume-based contracts, and comparable schemes operate elsewhere. Suppliers that can serve high-volume, low-price contracts reliably gain durable positions in markets that will keep expanding.
Segment Analysis
- By Therapeutic Area: Cardiovascular Holds the Volume Base While Central Nervous System Grows Fastest
Cardiovascular therapy held 24% of the market in 2026, the largest single therapeutic area. Antihypertensives, lipid-lowering agents, anticoagulants and heart failure medicines are prescribed continuously to very large numbers of older patients, and almost all are reimbursed. The class is also deeply genericised, so it contributes volume and stability rather than price growth. Central Nervous System is the fastest-growing area at a 5.9% CAGR through 2033, reflecting dementia and Parkinson’s disease portfolios where newer agents carry high acquisition costs and are subject to managed-entry agreements and registry conditions. Musculoskeletal, oncology, diabetes and metabolic, respiratory, urological and ophthalmic areas complete the category. The business implication is a split market: cardiovascular and musculoskeletal supply the units that keep plants loaded, while neurology and ophthalmology supply the value that payers scrutinise most closely before granting access.
- By Product Class: Generic Small Molecule Dominates as Biosimilar Expands at the Highest Rate
Generic Small Molecule accounted for 52% of the market in 2026. Substitution policy, prescribing by international nonproprietary name and tender-based procurement have made generics the default for chronic therapy in older patients across almost every health system. Branded Small Molecule and Biologic hold the remainder of the value, concentrated in classes still under exclusivity. Biosimilar is the fastest-growing class at a 9.1% CAGR through 2033, as reference biologics in oncology, inflammatory disease and ophthalmology lose protection and public payers move volume quickly. Interchangeability frameworks and pharmacist substitution authority accelerate the shift. For suppliers, the implication is that scale, regulatory throughput and cost per unit decide outcomes in most of the portfolio, while a narrow band of protected biologics carries the margin and attracts the heaviest reimbursement scrutiny.
- By Formulation and Delivery Format: Conventional Oral Solids Lead While Prefilled Devices Accelerate
Conventional Oral Solid formats held 54% share in 2026, simply because tablets and capsules remain the cheapest and most widely approved presentation for chronic therapy. Orodispersible tablets, liquids and suspensions, transdermal patches and fixed-dose combinations divide most of the balance, with fixed-dose combinations valued by prescribers for reducing the daily tablet count. Prefilled Device is the fastest-growing format at a 6.9% CAGR through 2033. Growth here follows the transfer of biologic and biosimilar therapy into self-administered presentations, together with grip, force and visual labelling requirements now written into procurement specifications. Transdermal patches hold a steady niche where oral administration is unsuitable. The commercial implication is that format, rather than molecule, is where differentiation is still available on mature products, and it is defensible because each presentation needs its own approval.
- By Distribution Channel: Retail Pharmacy Leads Volume While Online Pharmacy Records the Sharpest Gains
Retail Pharmacy held 46% of distribution in 2026, remaining the main point of dispensing for reimbursed outpatient prescriptions and the place where substitution and medication counselling occur. Hospital Pharmacy accounts for the high-cost biologics, oncology and ophthalmology products managed inside institutional budgets, while Long-Term Care Pharmacy serves residential and nursing settings with multi-dose packaging and review services. Online Pharmacy is the fastest-growing channel at an 8.4% CAGR through 2033, driven by repeat-prescription fulfilment, electronic prescribing and home delivery of chronic maintenance therapy. Regulatory recognition of electronic prescriptions in Germany, India and the United States has removed much of the friction. The implication for suppliers is that channel mix increasingly determines pack format, serialisation handling and the commercial terms attached to each market.
Geography Analysis
- Which Region Is Leading the Geriatric Medicines Market?
North America leads the geriatric medicines market with 36% share in 2026, almost entirely because of price levels rather than volume. The United States accounts for most of this, with Medicare Part D covering outpatient medicines for the retired population and commercial plans covering the rest. Branded products in oncology, ophthalmology and neurology command far higher realised prices than anywhere else, which inflates regional value. The US Inflation Reduction Act has begun to change that through Medicare drug price negotiation and a redesigned Part D benefit with an out-of-pocket cap. Canada adds a smaller, provincially administered market with established generic substitution. Regional growth is modest at 3.3%, since negotiation mechanisms and continued genericisation offset demographic gains. The change to watch is how negotiated prices reshape portfolio strategy for high-spend chronic therapy.
- Europe Combines the Oldest Patient Base With the Strictest Price Control
Europe holds 29% share in 2026 and has the highest median age of any region, led by Italy, Germany, Spain and France. Volume is very high indeed, but value grows slowly at 2.9% because every major national system operates reference pricing, mandatory rebates or tendering. Health technology assessment bodies assess new medicines against the cheapest relevant comparator before reimbursement is granted. Structured medication review and deprescribing guidance are embedded in several national primary care frameworks, which further limits prescription growth per patient. Safety features and verification requirements under falsified medicines rules add compliance cost across the supply chain. The unresolved revision of the EU pharmaceutical legislation is the main variable for suppliers, covering regulatory data protection and security of supply, with the final shape still under negotiation.
- Which Region Is Growing Fastest in the Geriatric Medicines Market?
Asia Pacific is growing fastest at a 5.6% CAGR through 2033, from 25% share in 2026. Japan has the oldest population of any large economy and a mature reimbursement system, but the growth comes mainly from China, India, Indonesia and Thailand, where the population above 65 is expanding quickly and insurance coverage is widening at the same time. Centralised volume-based procurement in China has cut unit prices sharply while multiplying treated patient numbers. India supplies much of the world’s generic volume and is also building domestic chronic disease coverage. Local manufacturing requirements and tender-led pricing define market entry. The main opportunity is formulary listing for chronic cardiovascular, diabetes and neurology therapy as public schemes extend outpatient medicine benefits.
- Latin America Expands Through Public Procurement Despite Budget and Currency Pressure
Latin America accounts for 6% share in 2026 and grows at 4.6%, with Brazil, Mexico, Argentina and Colombia providing most demand. Public procurement dominates: national purchasing bodies buy chronic disease medicines in bulk and award largely on price, which favours established generic suppliers. Demographic change is rapid, and several countries now report pension-age populations growing faster than their health budgets. The barriers are real. Currency volatility raises the cost of imported active ingredients, registration backlogs delay launches, and out-of-pocket spending still covers a large share of outpatient medicines outside the public lists. Regional regulatory convergence work and reliance pathways that recognise approvals from established authorities are shortening some timelines, which is the clearest route to faster access for new generic and biosimilar entrants.
- Middle East & Africa Builds Capacity From a Small Base With Uneven Access
Middle East & Africa holds 4% share in 2026 and grows at 4.9%, the smallest regional base in this market. Demand concentrates in the Gulf Cooperation Council states, Saudi Arabia, the United Arab Emirates, Israel, Egypt and South Africa, where insurance coverage and hospital infrastructure support chronic disease treatment. Government health transformation programmes in Saudi Arabia have expanded specialist capacity and formulary breadth. Access elsewhere is uneven: many national health systems prioritise communicable disease and maternal care, and medicines for long-term conditions in older patients are often paid out of pocket. Registration timelines vary widely and cold chain capability is limited outside major cities. Local fill-finish and generic manufacturing investment, combined with pooled procurement across national authorities, is the most practical path to wider availability.
Competitive Landscape
The geriatric medicines market is moderately concentrated, and concentration differs sharply by segment. Originator companies hold strong positions in the protected neurology, oncology and ophthalmology classes, where a handful of firms supply most of the value. The much larger generic base is fragmented, with global generic houses competing against strong regional manufacturers in India, China and Eastern Europe on cost per unit. Consolidation has been steady on the generic side, driven by the need for scale in regulatory filings and tender participation, while specialty assets are routinely traded between larger groups.
Competition rests on a short list of factors. In the reimbursed generic base, these are manufacturing cost, regulatory throughput, supply reliability and the ability to hold tender commitments without stock-outs. In the protected classes, competition is about evidence quality, health technology assessment outcomes and managed-entry terms with payers. Formulation and device capability has become a third axis, since age-appropriate presentations and prefilled devices are specified directly in procurement documents. New entrants are mostly biosimilar developers and contract manufacturers moving into finished-dose supply.
Strategic activity concentrates on portfolio rebalancing rather than expansion for its own sake. Firms are divesting mature small-molecule portfolios, building biosimilar pipelines against biologics approaching patent expiry, and investing in device and formulation platforms that can be applied across several molecules. Supply chain security is a parallel priority, with dual sourcing of active ingredients and regional fill-finish capacity now common requirements in public tenders.
The overall direction of vendor strategy is toward lower cost per unit in the reimbursed base and selective investment in high-evidence specialty assets. Both paths depend on payer relationships, and both must accommodate prescribing policies that aim to reduce the number of medicines each patient takes.
Recent Industry Developments
- August 2022: The United States enacted the Inflation Reduction Act, which created a Medicare drug price negotiation mechanism and redesigned the Part D benefit – the most significant change to pricing for medicines used by older patients in that market in two decades.
- April 2023: The European Commission published its proposal to revise the general pharmaceutical legislation of the European Union – an unresolved process covering regulatory data protection, security of supply and access obligations that will reset the operating rules for the region.
- August 2024: The Centers for Medicare & Medicaid Services announced negotiated maximum fair prices for the first group of selected Part D medicines – establishing the practical mechanics of price negotiation that suppliers must now plan around.
- January 2025: The Medicare Part D out-of-pocket cap of US$ 2,000 took effect in the United States under the benefit redesign – changing patient cost exposure and the plan economics that shape formulary placement.
- February 2019: Safety features and end-to-end verification became mandatory across the European Union under falsified medicines rules – imposing serialisation and decommissioning obligations on every pack dispensed in the region.
Companies Covered in the Report
- Pfizer Inc.
- Novartis AG
- Sanofi
- GSK plc
- AstraZeneca plc
- Bayer AG
- Eli Lilly and Company
- Novo Nordisk A/S
- Takeda Pharmaceutical Company Limited
- Boehringer Ingelheim International GmbH
- Teva Pharmaceutical Industries Ltd.
- Viatris Inc.
- Sandoz Group AG
- Sun Pharmaceutical Industries Ltd.
Geriatric Medicines Market Report Scope
| Metric | Value |
| Study Period | 2020–2033 |
| Market Size 2026 | US$ 412.0 Billion |
| Market Size 2033 | US$ 538.0 Billion |
| CAGR 2026–2033 | 3.9% |
| Absolute Dollar Opportunity | US$ 126.0 Billion |
| Largest Market | North America (36% share in 2026) |
| Fastest-Growing Market | Asia Pacific (5.6% CAGR 2026–2033) |
| Market Concentration | Medium |
| Major Players | Pfizer Inc., Novartis AG, Sanofi, Teva Pharmaceutical Industries Ltd., Viatris Inc. |
Geriatric Medicines Market Segmentation
Therapeutic Area
- Cardiovascular
- Central Nervous System
- Musculoskeletal
- Oncology
- Diabetes and Metabolic
- Respiratory
- Urological
- Ophthalmic
Product Class
- Generic Small Molecule
- Branded Small Molecule
- Biologic
- Biosimilar
Formulation and Delivery Format
- Conventional Oral Solid
- Orodispersible Tablet
- Liquid and Suspension
- Transdermal Patch
- Prefilled Device
- Fixed-Dose Combination
Distribution Channel
- Retail Pharmacy
- Hospital Pharmacy
- Long-Term Care Pharmacy
- Online Pharmacy
Regions
- North America
- Europe
- Asia Pacific
- Latin America
- Middle East & Africa
- Executive Summary
- Global Geriatric Medicines Market Snapshot
- Future Projections, 2026-2033
- Key Market Trends
- Regional Snapshot
- Market Overview
- Market Definition and Report Scope
- Historical Market Trends, 2020-2025
- Market Dynamics
- Drivers Impact Analysis
- Expanding Numbers of Older Patients With Multiple Long-Term Conditions Lift Geriatric Medicine Volumes
- Biosimilar Entry Widens Payer Access to Biologics Prescribed to Older Patients
- Restraints Impact Analysis
- Reference Pricing and Tendering Cap Value Growth Across Reimbursed Geriatric Medicine Portfolios
- Deprescribing Policy and Thin Trial Evidence in Older Patients Constrain Prescription Growth
- Market Opportunities
- Age-Appropriate Formulations and Prefilled Devices Open a Differentiated Revenue Pool
- Rapidly Ageing Middle-Income Health Systems Create New Reimbursed Demand Pools
- Drivers Impact Analysis
- Global Geriatric Medicines Market Outlook, 2020-2033
- Global Geriatric Medicines Market Outlook, by Therapeutic Area, Value (US$ Billion), 2020-2033
- Cardiovascular
- Central Nervous System
- Musculoskeletal
- Oncology
- Diabetes and Metabolic
- Respiratory
- Urological
- Ophthalmic
- Global Geriatric Medicines Market Outlook, by Product Class, Value (US$ Billion), 2020-2033
- Generic Small Molecule
- Branded Small Molecule
- Biologic
- Biosimilar
- Global Geriatric Medicines Market Outlook, by Formulation and Delivery Format, Value (US$ Billion), 2020-2033
- Conventional Oral Solid
- Orodispersible Tablet
- Liquid and Suspension
- Transdermal Patch
- Prefilled Device
- Fixed-Dose Combination
- Global Geriatric Medicines Market Outlook, by Distribution Channel, Value (US$ Billion), 2020-2033
- Retail Pharmacy
- Hospital Pharmacy
- Long-Term Care Pharmacy
- Online Pharmacy
- Global Geriatric Medicines Market Outlook, by Region, Value (US$ Billion), 2020-2033
- North America
- Europe
- Asia Pacific
- Latin America
- Middle East & Africa
- Global Geriatric Medicines Market Outlook, by Therapeutic Area, Value (US$ Billion), 2020-2033
- North America Geriatric Medicines Market Outlook, 2020-2033
- North America Geriatric Medicines Market Outlook, by Therapeutic Area, Value (US$ Billion), 2020-2033
- Cardiovascular
- Central Nervous System
- Musculoskeletal
- Oncology
- Diabetes and Metabolic
- Respiratory
- Urological
- Ophthalmic
- North America Geriatric Medicines Market Outlook, by Product Class, Value (US$ Billion), 2020-2033
- Generic Small Molecule
- Branded Small Molecule
- Biologic
- Biosimilar
- North America Geriatric Medicines Market Outlook, by Formulation and Delivery Format, Value (US$ Billion), 2020-2033
- Conventional Oral Solid
- Orodispersible Tablet
- Liquid and Suspension
- Transdermal Patch
- Prefilled Device
- Fixed-Dose Combination
- North America Geriatric Medicines Market Outlook, by Distribution Channel, Value (US$ Billion), 2020-2033
- Retail Pharmacy
- Hospital Pharmacy
- Long-Term Care Pharmacy
- Online Pharmacy
- North America Geriatric Medicines Market Outlook, by Country, Value (US$ Billion), 2020-2033
- United States Geriatric Medicines Market Outlook, by Therapeutic Area, 2020-2033
- United States Geriatric Medicines Market Outlook, by Product Class, 2020-2033
- United States Geriatric Medicines Market Outlook, by Formulation and Delivery Format, 2020-2033
- United States Geriatric Medicines Market Outlook, by Distribution Channel, 2020-2033
- Canada Geriatric Medicines Market Outlook, by Therapeutic Area, 2020-2033
- Canada Geriatric Medicines Market Outlook, by Product Class, 2020-2033
- Canada Geriatric Medicines Market Outlook, by Formulation and Delivery Format, 2020-2033
- Canada Geriatric Medicines Market Outlook, by Distribution Channel, 2020-2033
- North America Geriatric Medicines Market Outlook, by Therapeutic Area, Value (US$ Billion), 2020-2033
- Europe Geriatric Medicines Market Outlook, 2020-2033
- Europe Geriatric Medicines Market Outlook, by Therapeutic Area, Value (US$ Billion), 2020-2033
- Cardiovascular
- Central Nervous System
- Musculoskeletal
- Oncology
- Diabetes and Metabolic
- Respiratory
- Urological
- Ophthalmic
- Europe Geriatric Medicines Market Outlook, by Product Class, Value (US$ Billion), 2020-2033
- Generic Small Molecule
- Branded Small Molecule
- Biologic
- Biosimilar
- Europe Geriatric Medicines Market Outlook, by Formulation and Delivery Format, Value (US$ Billion), 2020-2033
- Conventional Oral Solid
- Orodispersible Tablet
- Liquid and Suspension
- Transdermal Patch
- Prefilled Device
- Fixed-Dose Combination
- Europe Geriatric Medicines Market Outlook, by Distribution Channel, Value (US$ Billion), 2020-2033
- Retail Pharmacy
- Hospital Pharmacy
- Long-Term Care Pharmacy
- Online Pharmacy
- Europe Geriatric Medicines Market Outlook, by Country, Value (US$ Billion), 2020-2033
- Italy Geriatric Medicines Market Outlook, by Therapeutic Area, 2020-2033
- Italy Geriatric Medicines Market Outlook, by Product Class, 2020-2033
- Italy Geriatric Medicines Market Outlook, by Formulation and Delivery Format, 2020-2033
- Italy Geriatric Medicines Market Outlook, by Distribution Channel, 2020-2033
- Germany Geriatric Medicines Market Outlook, by Therapeutic Area, 2020-2033
- Germany Geriatric Medicines Market Outlook, by Product Class, 2020-2033
- Germany Geriatric Medicines Market Outlook, by Formulation and Delivery Format, 2020-2033
- Germany Geriatric Medicines Market Outlook, by Distribution Channel, 2020-2033
- Spain Geriatric Medicines Market Outlook, by Therapeutic Area, 2020-2033
- Spain Geriatric Medicines Market Outlook, by Product Class, 2020-2033
- Spain Geriatric Medicines Market Outlook, by Formulation and Delivery Format, 2020-2033
- Spain Geriatric Medicines Market Outlook, by Distribution Channel, 2020-2033
- France Geriatric Medicines Market Outlook, by Therapeutic Area, 2020-2033
- France Geriatric Medicines Market Outlook, by Product Class, 2020-2033
- France Geriatric Medicines Market Outlook, by Formulation and Delivery Format, 2020-2033
- France Geriatric Medicines Market Outlook, by Distribution Channel, 2020-2033
- Europe Geriatric Medicines Market Outlook, by Therapeutic Area, Value (US$ Billion), 2020-2033
- Asia Pacific Geriatric Medicines Market Outlook, 2020-2033
- Asia Pacific Geriatric Medicines Market Outlook, by Therapeutic Area, Value (US$ Billion), 2020-2033
- Cardiovascular
- Central Nervous System
- Musculoskeletal
- Oncology
- Diabetes and Metabolic
- Respiratory
- Urological
- Ophthalmic
- Asia Pacific Geriatric Medicines Market Outlook, by Product Class, Value (US$ Billion), 2020-2033
- Generic Small Molecule
- Branded Small Molecule
- Biologic
- Biosimilar
- Asia Pacific Geriatric Medicines Market Outlook, by Formulation and Delivery Format, Value (US$ Billion), 2020-2033
- Conventional Oral Solid
- Orodispersible Tablet
- Liquid and Suspension
- Transdermal Patch
- Prefilled Device
- Fixed-Dose Combination
- Asia Pacific Geriatric Medicines Market Outlook, by Distribution Channel, Value (US$ Billion), 2020-2033
- Retail Pharmacy
- Hospital Pharmacy
- Long-Term Care Pharmacy
- Online Pharmacy
- Asia Pacific Geriatric Medicines Market Outlook, by Country, Value (US$ Billion), 2020-2033
- Japan Geriatric Medicines Market Outlook, by Therapeutic Area, 2020-2033
- Japan Geriatric Medicines Market Outlook, by Product Class, 2020-2033
- Japan Geriatric Medicines Market Outlook, by Formulation and Delivery Format, 2020-2033
- Japan Geriatric Medicines Market Outlook, by Distribution Channel, 2020-2033
- China Geriatric Medicines Market Outlook, by Therapeutic Area, 2020-2033
- China Geriatric Medicines Market Outlook, by Product Class, 2020-2033
- China Geriatric Medicines Market Outlook, by Formulation and Delivery Format, 2020-2033
- China Geriatric Medicines Market Outlook, by Distribution Channel, 2020-2033
- India Geriatric Medicines Market Outlook, by Therapeutic Area, 2020-2033
- India Geriatric Medicines Market Outlook, by Product Class, 2020-2033
- India Geriatric Medicines Market Outlook, by Formulation and Delivery Format, 2020-2033
- India Geriatric Medicines Market Outlook, by Distribution Channel, 2020-2033
- Indonesia Geriatric Medicines Market Outlook, by Therapeutic Area, 2020-2033
- Indonesia Geriatric Medicines Market Outlook, by Product Class, 2020-2033
- Indonesia Geriatric Medicines Market Outlook, by Formulation and Delivery Format, 2020-2033
- Indonesia Geriatric Medicines Market Outlook, by Distribution Channel, 2020-2033
- Thailand Geriatric Medicines Market Outlook, by Therapeutic Area, 2020-2033
- Thailand Geriatric Medicines Market Outlook, by Product Class, 2020-2033
- Thailand Geriatric Medicines Market Outlook, by Formulation and Delivery Format, 2020-2033
- Thailand Geriatric Medicines Market Outlook, by Distribution Channel, 2020-2033
- Asia Pacific Geriatric Medicines Market Outlook, by Therapeutic Area, Value (US$ Billion), 2020-2033
- Latin America Geriatric Medicines Market Outlook, 2020-2033
- Latin America Geriatric Medicines Market Outlook, by Therapeutic Area, Value (US$ Billion), 2020-2033
- Cardiovascular
- Central Nervous System
- Musculoskeletal
- Oncology
- Diabetes and Metabolic
- Respiratory
- Urological
- Ophthalmic
- Latin America Geriatric Medicines Market Outlook, by Product Class, Value (US$ Billion), 2020-2033
- Generic Small Molecule
- Branded Small Molecule
- Biologic
- Biosimilar
- Latin America Geriatric Medicines Market Outlook, by Formulation and Delivery Format, Value (US$ Billion), 2020-2033
- Conventional Oral Solid
- Orodispersible Tablet
- Liquid and Suspension
- Transdermal Patch
- Prefilled Device
- Fixed-Dose Combination
- Latin America Geriatric Medicines Market Outlook, by Distribution Channel, Value (US$ Billion), 2020-2033
- Retail Pharmacy
- Hospital Pharmacy
- Long-Term Care Pharmacy
- Online Pharmacy
- Latin America Geriatric Medicines Market Outlook, by Country, Value (US$ Billion), 2020-2033
- Brazil Geriatric Medicines Market Outlook, by Therapeutic Area, 2020-2033
- Brazil Geriatric Medicines Market Outlook, by Product Class, 2020-2033
- Brazil Geriatric Medicines Market Outlook, by Formulation and Delivery Format, 2020-2033
- Brazil Geriatric Medicines Market Outlook, by Distribution Channel, 2020-2033
- Mexico Geriatric Medicines Market Outlook, by Therapeutic Area, 2020-2033
- Mexico Geriatric Medicines Market Outlook, by Product Class, 2020-2033
- Mexico Geriatric Medicines Market Outlook, by Formulation and Delivery Format, 2020-2033
- Mexico Geriatric Medicines Market Outlook, by Distribution Channel, 2020-2033
- Argentina Geriatric Medicines Market Outlook, by Therapeutic Area, 2020-2033
- Argentina Geriatric Medicines Market Outlook, by Product Class, 2020-2033
- Argentina Geriatric Medicines Market Outlook, by Formulation and Delivery Format, 2020-2033
- Argentina Geriatric Medicines Market Outlook, by Distribution Channel, 2020-2033
- Colombia Geriatric Medicines Market Outlook, by Therapeutic Area, 2020-2033
- Colombia Geriatric Medicines Market Outlook, by Product Class, 2020-2033
- Colombia Geriatric Medicines Market Outlook, by Formulation and Delivery Format, 2020-2033
- Colombia Geriatric Medicines Market Outlook, by Distribution Channel, 2020-2033
- Latin America Geriatric Medicines Market Outlook, by Therapeutic Area, Value (US$ Billion), 2020-2033
- Middle East & Africa Geriatric Medicines Market Outlook, 2020-2033
- Middle East & Africa Geriatric Medicines Market Outlook, by Therapeutic Area, Value (US$ Billion), 2020-2033
- Cardiovascular
- Central Nervous System
- Musculoskeletal
- Oncology
- Diabetes and Metabolic
- Respiratory
- Urological
- Ophthalmic
- Middle East & Africa Geriatric Medicines Market Outlook, by Product Class, Value (US$ Billion), 2020-2033
- Generic Small Molecule
- Branded Small Molecule
- Biologic
- Biosimilar
- Middle East & Africa Geriatric Medicines Market Outlook, by Formulation and Delivery Format, Value (US$ Billion), 2020-2033
- Conventional Oral Solid
- Orodispersible Tablet
- Liquid and Suspension
- Transdermal Patch
- Prefilled Device
- Fixed-Dose Combination
- Middle East & Africa Geriatric Medicines Market Outlook, by Distribution Channel, Value (US$ Billion), 2020-2033
- Retail Pharmacy
- Hospital Pharmacy
- Long-Term Care Pharmacy
- Online Pharmacy
- Middle East & Africa Geriatric Medicines Market Outlook, by Country and Subregion, Value (US$ Billion), 2020-2033
- Gulf Cooperation Council Geriatric Medicines Market Outlook, by Therapeutic Area, 2020-2033
- Gulf Cooperation Council Geriatric Medicines Market Outlook, by Product Class, 2020-2033
- Gulf Cooperation Council Geriatric Medicines Market Outlook, by Formulation and Delivery Format, 2020-2033
- Gulf Cooperation Council Geriatric Medicines Market Outlook, by Distribution Channel, 2020-2033
- Saudi Arabia Geriatric Medicines Market Outlook, by Therapeutic Area, 2020-2033
- Saudi Arabia Geriatric Medicines Market Outlook, by Product Class, 2020-2033
- Saudi Arabia Geriatric Medicines Market Outlook, by Formulation and Delivery Format, 2020-2033
- Saudi Arabia Geriatric Medicines Market Outlook, by Distribution Channel, 2020-2033
- United Arab Emirates Geriatric Medicines Market Outlook, by Therapeutic Area, 2020-2033
- United Arab Emirates Geriatric Medicines Market Outlook, by Product Class, 2020-2033
- United Arab Emirates Geriatric Medicines Market Outlook, by Formulation and Delivery Format, 2020-2033
- United Arab Emirates Geriatric Medicines Market Outlook, by Distribution Channel, 2020-2033
- Israel Geriatric Medicines Market Outlook, by Therapeutic Area, 2020-2033
- Israel Geriatric Medicines Market Outlook, by Product Class, 2020-2033
- Israel Geriatric Medicines Market Outlook, by Formulation and Delivery Format, 2020-2033
- Israel Geriatric Medicines Market Outlook, by Distribution Channel, 2020-2033
- Egypt Geriatric Medicines Market Outlook, by Therapeutic Area, 2020-2033
- Egypt Geriatric Medicines Market Outlook, by Product Class, 2020-2033
- Egypt Geriatric Medicines Market Outlook, by Formulation and Delivery Format, 2020-2033
- Egypt Geriatric Medicines Market Outlook, by Distribution Channel, 2020-2033
- South Africa Geriatric Medicines Market Outlook, by Therapeutic Area, 2020-2033
- South Africa Geriatric Medicines Market Outlook, by Product Class, 2020-2033
- South Africa Geriatric Medicines Market Outlook, by Formulation and Delivery Format, 2020-2033
- South Africa Geriatric Medicines Market Outlook, by Distribution Channel, 2020-2033
- Middle East & Africa Geriatric Medicines Market Outlook, by Therapeutic Area, Value (US$ Billion), 2020-2033
- Competitive Landscape
- Market Concentration and Industry Leaders
- Competitive Differentiation
- Strategic Initiatives
- Recent Industry Developments
- Company Profiles
- Pfizer Inc.
- Novartis AG
- Sanofi
- GSK plc
- AstraZeneca plc
- Bayer AG
- Eli Lilly and Company
- Novo Nordisk A/S
- Takeda Pharmaceutical Company Limited
- Boehringer Ingelheim International GmbH
- Teva Pharmaceutical Industries Ltd.
- Viatris Inc.
- Sandoz Group AG
- Sun Pharmaceutical Industries Ltd.
- Appendix
- Research Methodology
- Report Assumptions
- Acronyms and Abbreviations
Therapeutic Area
- Cardiovascular
- Central Nervous System
- Musculoskeletal
- Oncology
- Diabetes and Metabolic
- Respiratory
- Urological
- Ophthalmic
Product Class
- Generic Small Molecule
- Branded Small Molecule
- Biologic
- Biosimilar
Formulation and Delivery Format
- Conventional Oral Solid
- Orodispersible Tablet
- Liquid and Suspension
- Transdermal Patch
- Prefilled Device
- Fixed-Dose Combination
Distribution Channel
- Retail Pharmacy
- Hospital Pharmacy
- Long-Term Care Pharmacy
- Online Pharmacy
Regions
- North America
- Europe
- Asia Pacific
- Latin America
- Middle East & Africa
Our Research Methodology
Considering the volatility of business today, traditional approaches to strategizing a game plan can be unfruitful if not detrimental. True ambiguity is no way to determine a forecast. A myriad of predetermined factors must be accounted for such as the degree of risk involved, the magnitude of circumstances, as well as conditions or consequences that are not known or unpredictable. To circumvent binary views that cast uncertainty, the application of market research intelligence to strategically posture, move, and enable actionable outcomes is necessary.
View Methodology
Quality Assured
Rigorous Validation Process

Confidentiality Assured
End-to-end Data Security

Custom Research Services
Tailored To Your Objectives
FAQs
The market is valued at US$ 412.0 billion in 2026, measured across medicines and age-appropriate formulations prescribed predominantly to patients above 65 years.
The market is projected to reach US$ 538.0 billion by 2033, a 3.9% CAGR and an absolute dollar opportunity of US$ 126.0 billion over the period.
Cardiovascular holds the largest share at 24% in 2026, supported by continuous reimbursed prescribing of antihypertensive, lipid-lowering and anticoagulant therapy.
Asia Pacific grows fastest at a 5.6% CAGR through 2033, as insurance coverage widens alongside quickly expanding populations above 65 years.
Concentration is medium: protected specialty classes sit with a few originators, while the much larger reimbursed generic base remains fragmented and tender-driven.
Related Reports
Immune Checkpoint Inhibitors Market Size, Share, Insights, Competitive Landscape, and Forecast 2026 to 2033
The global immune checkpoint inhibitors market is valued at US$52.0 billion in 2026, reaching US$68.0 billion by 2033, growing at a 3.91% CAGR
Pharmaceutical Temperature Controlled Packaging Solutions Market Size, Share, Insights, Competitive Landscape, and Forecast 2026 to 2033
Pharmaceutical temperature controlled packaging solutions market to grow from US$ 6.86 billion in 2026 to US$ 13.98 billion by 2033 at a 10.7% CAGR.
Dermatology CRO Market Size, Share, Insights, Competitive Landscape, and Forecast 2026 to 2033
Explore the dermatology CRO market, projected to reach US$ 9.7 billion by 2033 at a 6.6% CAGR, with service, indication and regional insights.
Acetaminophen Market Size, Share, Insights, Competitive Landscape, and Forecast 2026 to 2033
The global acetaminophen market is valued at US$11.70 billion in 2026, reaching US$15.93 billion by 2033, growing at a 4.5% CAGR
Allergy Diagnostics and Therapeutics Market Size, Share, Insights, Competitive Landscape, and Forecast 2026 to 2033
The global allergy diagnostics and therapeutics market is valued at US$41.50 billion in 2026, reaching US$88.30 billion by 2033, growing at an 11.4% CAGR
Homeopathic Products Market Size, Share, Insights, Competitive Landscape, and Forecast 2026 to 2033
The global homeopathic products market is valued at US$59.45 billion in 2026, reaching US$169.21 billion by 2033, growing at a 16.1% CAGR