



Industrial Batteries Market
Industrial Batteries Market Size, Share, Insights, Competitive Landscape, and Forecast 2026 to 2033
Industrial Batteries Market Size and Trend Analysis
How Large Is the Industrial Batteries Market in 2026?
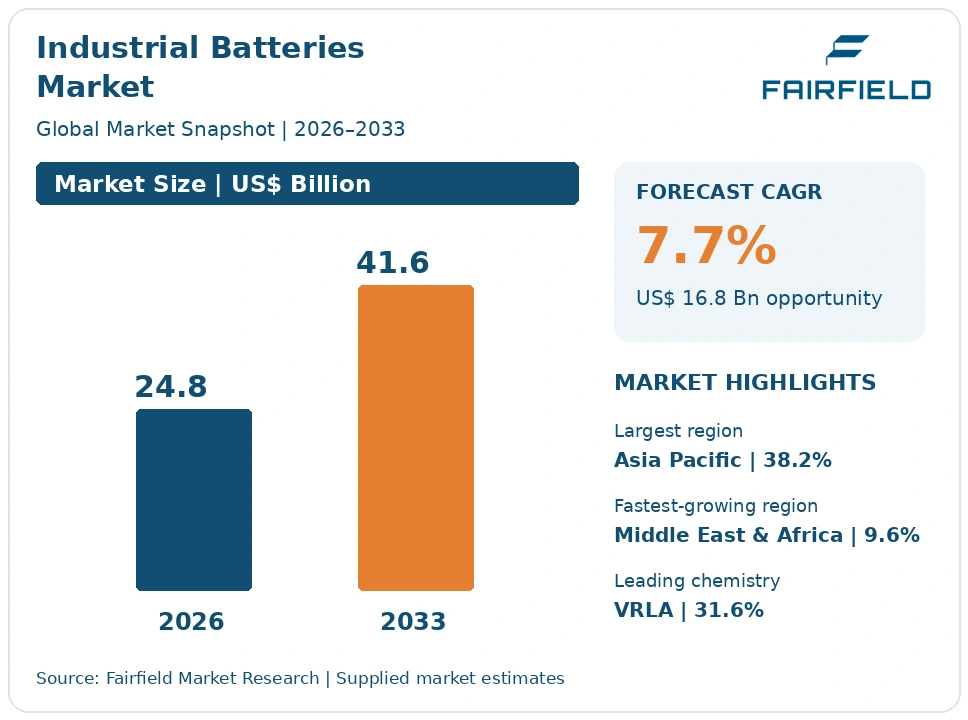
The global Industrial Batteries market size is expected to be valued at US$ 24.8 billion in 2026 and projected to reach US$ 41.6 billion by 2033, growing at a CAGR of 7.7% between 2026 and 2033.
This scope covers batteries built for industrial duty only. Electric vehicle traction batteries and grid-scale energy storage systems are excluded, since either inclusion would change the figure by an order of magnitude. The market grew at roughly a 6.8% CAGR between 2020 and 2025, lifted by data centre construction and warehouse automation. Three forces set direction. Uptime requirements in telecom and computing keep standby replacement cycles firm. Multi-shift materials handling expands motive power demand. Most importantly, lithium iron phosphate is substituting for lead-acid across both applications, which raises average selling value per installed kilowatt-hour even where unit volumes grow slowly. The result is value growth running well ahead of installed capacity growth.
Key Report Takeaways
- By Battery Type: Valve-regulated lead-acid held 31.6% share in 2026, while lithium iron phosphate is projected to expand at a 14.6% CAGR through 2033, driven by opportunity charging, elimination of watering and far longer cycle life.
- By Application: Stationary standby power held 42.6% share in 2026, while motive power is projected to expand at an 8.9% CAGR through 2033, driven by multi-shift warehouse operation and automated guided vehicle fleets.
- By Capacity: The 100–500 Ah band held 34.2% share in 2026, while units above 1,000 Ah are projected to expand at a 9.1% CAGR through 2033, driven by larger uninterruptible power supply strings in hyperscale facilities.
- By End Use Industry: Data centres and IT held 22.4% share in 2026, while warehousing and logistics is projected to expand at a 9.4% CAGR through 2033, driven by same-day fulfilment networks and new distribution centre construction.
- By Geography: Asia Pacific held 38.2% share in 2026, while Middle East & Africa is projected to expand at a 9.6% CAGR through 2033, driven by Gulf data centre construction and African telecom site electrification.
Global Industrial Batteries Market Trends and Insights
Drivers Impact Analysis
Two demand forces account for most of the forecast growth in industrial battery value.
| Driver | Impact on CAGR Forecast | Geographic Relevance | Impact Timeline |
| Uptime and backup runtime requirements in data centres and telecom networks | High | Global, strongest in North America and Asia Pacific | Long term (≥4 years) |
| Multi-shift warehouse operation and materials handling automation | Medium | North America, Europe, Asia Pacific | Medium term (2–4 years) |
Computing and Telecom Uptime Commitments Keep Standby Battery Replacement Firm
Backup runtime obligations are the steadiest source of industrial battery demand. Data centres, exchange buildings, cellular sites and switchgear rooms cannot tolerate an unprotected transfer to generator power. Batteries in these roles are consumable assets with defined service lives, so a large installed base generates predictable replacement demand regardless of economic conditions. Each new computing hall also adds strings that will be replaced several times over the building’s life.
The mechanism is thermal and contractual. Valve-regulated lead-acid life halves for roughly every eight degrees above its rated temperature, so warm rooms shorten replacement intervals and raise lifetime spend. Service level agreements push operators to replace strings before measured capacity falls under eighty percent, rather than at failure. Rising rack power density increases the stored energy needed for the same ride-through time. Monitoring systems now report cell impedance continuously, which converts reactive replacement into scheduled, budgeted procurement.
Multi-Shift Warehousing and Automated Handling Expand Motive Power Battery Demand
Materials handling is the second engine of demand, and it is growing faster than standby. Distribution centres serving next-day and same-day fulfilment increasingly run two or three shifts. Under that duty cycle, a single battery per truck is no longer enough with conventional charging, so operators either buy spare batteries and change them or move to chemistries that accept opportunity charging during breaks.
The causal chain runs through labour and floor space. Battery changing rooms need ventilation, hoists, eyewash stations and trained staff, all of which consume square metres that fulfilment operators would rather use for inventory. Automated guided vehicles and autonomous mobile robots compound the effect, because they are designed to dock and charge briefly rather than to stop for a swap. IEC 62619 provides the safety framework that lets these lithium packs be specified in industrial fleets, which has made procurement committees far more comfortable approving the change.
Restraints Impact Analysis
Two constraints materially slow the pace of industrial battery conversion and growth.
| Restraint | Impact on CAGR Forecast | Geographic Relevance | Impact Timeline |
| Fire safety approval and installation permitting for lithium systems | High | North America and Europe | Medium term (2–4 years) |
| Concentration of lithium cell manufacturing and upstream material supply | Medium | Global | Long term (≥4 years) |
Fire Code Approval for Lithium Installations Delays Conversion in Occupied Buildings
Fire safety approval is the most common reason a lithium conversion stalls. Batteries in occupied buildings sit under local fire codes, and authorities having jurisdiction apply them conservatively to chemistries they have less experience with. Projects are delayed or redesigned, and some operators simply reorder lead-acid because it passes review without argument. The effect is strongest in retrofits, where the room was never designed for the new requirements.
The cost sources are specific. NFPA 855 drives requirements for spacing between units, maximum stored energy per room, detection, ventilation and explosion control, and large-scale fire testing evidence. Cells and systems typically need certification to UL 1973 or IEC 62619, and each enclosure change can trigger re-evaluation. Sprinkler density, structural fire separation and dedicated exhaust add construction cost unrelated to the battery price. Insurers often impose further conditions, and the engineering review itself consumes months of project schedule.
Lithium Cell Supply Concentration Leaves Industrial Assemblers Exposed on Price and Allocation
Supply concentration limits how quickly industrial battery makers can scale lithium offerings. Most companies in this sector assemble packs rather than manufacture cells, so they buy prismatic or cylindrical lithium iron phosphate cells from a small group of producers. When those producers prioritise larger customers, industrial assemblers face long lead times, minimum order quantities and limited ability to negotiate on specification. Margin is set largely outside their control.
The underlying cause is upstream structure. Cell manufacturing capacity, cathode and anode material production, lithium refining and graphite processing are concentrated in a narrow set of locations. Qualifying a second cell source is not a purchasing decision but an engineering programme, requiring new mechanical design, revised battery management calibration, fresh UN 38.3 transport testing and renewed safety certification. That work takes many months. Lead-acid faces no equivalent problem, because its materials, smelters and recycling loop are regional and well established.
Market Opportunities
Lead-Acid Fleet Conversion Opens a Retrofit Battery, Charger and Service Revenue Pool
The installed lead-acid fleet is itself the largest identifiable opportunity. Millions of forklifts, pallet trucks and standby strings already in service will be replaced within the forecast period, and each replacement is a decision point between chemistries. Conversion revenue is larger than a like-for-like sale, because lithium packs usually arrive with new chargers, revised electrical infrastructure, battery management integration and a monitoring contract attached.
The customers creating this pool are fleet operators with hard duty cycles: third-party logistics providers, grocery and cold chain distributors, automotive plants and parcel hubs. Suppliers who already service those accounts capture it most easily, because they hold the truck population data and the maintenance relationship. Total cost of ownership modelling, rather than purchase price, is what closes these deals. Energy monitoring and charger telemetry support the case by showing realised throughput per charging hour across a full operating week.
Battery Passport and Recycled Content Rules Create a Traceability and Second-Life Revenue Pool
Compliance data is becoming a product in its own right. The European Union battery framework requires carbon footprint declarations, recycled content levels, collection performance, supply chain due diligence and a digital battery passport. Suppliers that can produce verified material and performance records for every unit sold gain access to tenders that competitors cannot bid for, and they can charge for the documentation and reporting layer around the hardware.
The demand comes from corporate and public buyers with their own disclosure duties, including logistics operators, telecom carriers and data centre landlords. Capture favours companies with controlled recycling routes, since lead-acid already runs a closed loop that can serve as the template for lithium. Second-life redeployment of retired motive power packs into lighter standby duty adds another revenue line, provided state-of-health data is captured over the pack’s first life.
Segment Analysis
By Battery Type: Valve-Regulated Lead-Acid Leads as Lithium Iron Phosphate Climbs Rapidly
Valve-regulated lead-acid held 31.6% share in 2026, the largest single chemistry position, with flooded lead-acid close behind in motive power. Lead-acid leads on first cost, on a recycling infrastructure that recovers the great majority of material, and on the simple fact that specifying engineers have decades of field data. Lithium iron phosphate is the fastest-growing chemistry at a 14.6% CAGR through 2033. It wins on opportunity charging, zero watering and maintenance, usable depth of discharge, and cycle life that is several times longer in demanding duty. Nickel-cadmium retains niche positions in extreme temperature and switchgear duty, while flow systems remain marginal at this scale. The commercial consequence is a chemistry split by application economics rather than a clean replacement. High-utilisation assets convert first, and lightly cycled backup strings stay with lead-acid considerably longer.
By Application: Stationary Standby Dominates Installed Value While Motive Power Accelerates
Stationary standby power held 42.6% share in 2026, the largest application, because uninterruptible power supplies, telecom sites, exchange buildings and substation switchgear all carry batteries that must be replaced on schedule. The sheer size of that installed base makes standby the value anchor of the sector. Motive power is the fastest-growing application at an 8.9% CAGR through 2033, as warehouses extend operating hours and add automated handling equipment that charges in short bursts. Switchgear and utility substation duty, mining and heavy equipment, and rail and marine auxiliary systems fill the remainder, each with demanding vibration, temperature or reliability requirements. For suppliers, the implication is that standby funds the business while motive power determines who gains share, because motive power is where chemistry conversion is happening fastest and where service relationships are deepest.
By Capacity: Mid-Range Strings Lead Installations While Large Units Grow Fastest
The 100–500 Ah band held 34.2% share in 2026, the leading capacity class, because it matches the most common configurations in telecom cabinets, mid-size uninterruptible power supplies and standard counterbalance forklifts. Volume manufacturing at this size keeps unit costs low and availability high. Units above 1,000 Ah are the fastest-growing class at a 9.1% CAGR through 2033, pulled by hyperscale computing halls, heavy mining equipment and large marine auxiliary systems that need extended autonomy from a single string. Capacities below 100 Ah continue to serve small cabinets, instrumentation and switchgear tripping duty, while the 500–1,000 Ah band covers larger industrial trucks. The practical effect is a widening product range for suppliers, since large-format designs demand different busbar engineering, thermal management and handling equipment than mid-range units do.
By End Use Industry: Data Centres Anchor Demand While Warehousing and Logistics Expands Fastest
Data centres and IT held 22.4% share in 2026, the largest end-use industry, reflecting continued construction of computing capacity and the strict runtime requirements written into colocation contracts. Rising rack density increases stored energy per hall, so even flat facility counts would lift battery value. Warehousing and logistics is the fastest-growing end use at a 9.4% CAGR through 2033, driven by fulfilment network expansion, longer operating hours and automation. Telecommunications, utilities and power, manufacturing, mining, rail and marine, and healthcare and commercial buildings make up the balance. Each buys on a different metric: carriers on total site cost, utilities on reliability, miners on durability under vibration and dust. The business implication is that sales organisations must be structured by industry, because specification language and approval processes differ far more than the hardware does.
Geography Analysis
North America Buys on Fire Code Compliance and Data Centre Construction
North America held 25.6% share in 2026, anchored by the United States with meaningful contribution from Canada and Mexico. Demand concentrates in two pools: computing and telecom backup, especially in the large data centre clusters of Virginia, Texas, Arizona and Georgia, and motive power for a very large forklift and distribution fleet. Specification practice is conservative and code-driven. Projects are reviewed against NFPA 855 and look for cells and systems certified to UL 1973, which lengthens approval timelines for lithium retrofits in occupied buildings. Regional growth sits near 7.4% annually. The clearest change underway is the shift of forklift fleet purchasing toward total cost of ownership evaluation, which favours lithium in multi-shift sites while single-shift operations continue to reorder flooded lead-acid.
Europe’s Battery Regulation Turns Traceability Into a Condition of Supply
Europe held 23.4% share in 2026, with Germany, France, the United Kingdom, Italy, the Netherlands and the Nordic countries providing most demand through manufacturing, logistics property and telecom infrastructure. The defining feature is regulatory. Regulation (EU) 2023/1542 introduces carbon footprint declarations, recycled content thresholds, collection targets, due diligence duties and a digital battery passport, phased over the forecast period. Suppliers that cannot document material provenance will struggle in public and corporate tenders. Lead recycling is already highly organised here, which helps incumbent producers, while lithium collection and recovery capacity is still being built. Growth runs close to 7.2% annually. The notable change is procurement language itself, which increasingly specifies traceable material and end-of-life responsibility alongside electrical performance.
Which Region Is Leading the Industrial Batteries Market?
Asia Pacific leads the market with 38.2% share in 2026, the result of both manufacturing concentration and domestic consumption. China, Japan, South Korea, India, Taiwan and Australia drive the regional total. Cell and pack production is heavily clustered here, which gives regional assemblers shorter lead times and better allocation than importers receive. Demand is broad: telecom tower networks across India and Indonesia, dense port and warehouse automation in China, semiconductor and electronics plants requiring clean backup power in Taiwan and South Korea, and mining operations in Australia. Growth runs around 8.1% annually, ahead of the global pace. The structural change to watch is domestic lithium iron phosphate pricing, which is low enough to make conversion economics work in applications where importers still find lead-acid cheaper.
Latin America Demand Concentrates in Mining, Ports and Telecom Backup
Latin America held 6.4% share in 2026, led by Brazil, Mexico, Chile, Peru and Colombia. Mining is the defining demand source, with copper and lithium operations in the Andes running heavy equipment, substation reserves and remote site backup under harsh conditions. Port modernisation and growing e-commerce distribution add motive power volume, while unreliable grid supply in several markets keeps telecom and commercial backup demand strong. Barriers are substantial. Import duties and currency volatility raise landed costs, informal lead recycling creates environmental and reputational risk, and field service coverage outside major cities is thin. Financing long-payback lithium conversions is also difficult at prevailing interest rates. The main opportunity lies with multinational mining and logistics operators, who apply group-level standards and can fund total cost of ownership upgrades.
Which Region Is Growing Fastest in the Industrial Batteries Market?
Middle East & Africa is growing fastest, at a 9.6% CAGR between 2026 and 2033, from 6.4% share in 2026. Growth is driven by data centre construction in Saudi Arabia, the United Arab Emirates and Qatar, by telecom site build-out and solar hybridisation across Nigeria, Kenya and South Africa, and by mining expansion in South Africa, Zambia and the Democratic Republic of the Congo. Off-grid and weak-grid conditions make backup storage a necessity rather than an upgrade. Barriers remain significant: high ambient temperatures shorten battery life and force derating or active cooling, local manufacturing is limited so nearly everything is imported, and qualified installation and maintenance capacity is scarce. The opportunity is largest in telecom tower portfolios, where operators are replacing ageing lead-acid banks with lithium to reduce theft losses and diesel consumption.
Competitive Landscape
The market is moderately concentrated, and the degree varies sharply by chemistry. Lead-acid manufacturing is consolidated, because smelting, formation and distribution are capital intensive and because recycling logistics reward regional scale. A small group of established producers supplies most motive power and standby lead-acid volume in each region. Lithium supply is far more fragmented at the pack level, since assembly barriers are low and dozens of integrators buy the same cells. The result is a sector where incumbents hold strong positions in the declining chemistry and face many new competitors in the growing one.
Vendors compete on a short list of practical factors. Service network density matters most in motive power, where downtime costs more than the battery. Certification coverage, warranty terms, documented cycle life, charger compatibility and monitoring software decide standby tenders. Price competition is fiercest in commodity valve-regulated units. New entrants typically come from cell manufacturing, with producers such as Contemporary Amperex Technology Co. Limited and BYD Company Limited moving downstream into industrial packs, and from power electronics firms bundling batteries with chargers and telemetry.
Positioning reflects heritage. EnerSys, East Penn Manufacturing Co., Inc., Exide Technologies, Hoppecke Batterien GmbH & Co. KG and C&D Technologies, Inc. built their networks around lead-acid service and are extending them to lithium. GS Yuasa Corporation and Saft Groupe S.A. combine industrial batteries with wider energy businesses. Exide Industries Limited, Amara Raja Energy & Mobility Limited, Narada Power Source Co., Ltd. and Leoch International Technology Limited anchor strong regional positions.
Strategic direction is consistent across the sector: protect the lead-acid installed base and its recycling economics, secure lithium cell supply, and build the traceability and monitoring data that regulated buyers now demand.
Industrial Batteries Industry Leaders
- EnerSys
- East Penn Manufacturing Co., Inc.
- GS Yuasa Corporation
- Exide Technologies
- Hoppecke Batterien GmbH & Co. KG
Recent Industry Developments
May 1992: The Basel Convention entered into force, bringing transboundary shipments of waste lead-acid batteries under prior informed consent – it made regional recycling networks, rather than global ones, the economic default for lead recovery.
2017: The International Electrotechnical Commission published IEC 62619, setting safety requirements for secondary lithium cells and batteries used in industrial applications – it gave procurement teams a common specification for motive power and standby lithium packs.
2019: The National Fire Protection Association issued the first edition of NFPA 855 on the installation of stationary energy storage systems – it standardised spacing, detection and ventilation expectations, and became the main approval hurdle for lithium retrofits.
January 2020: The requirement to make a UN 38.3 test summary available took effect for lithium cell and battery shipments – it added a documented qualification step whenever an industrial assembler changes cell supplier or pack design.
August 2023: Regulation (EU) 2023/1542 on batteries and waste batteries entered into force, with its first obligations applying from February 2024 – it introduced carbon footprint declarations, recycled content rules, due diligence duties and the digital battery passport.
Industrial Batteries Market Report Scope
| Metric | Value |
| Study Period | 2020–2033 |
| Market Size 2026 | US$ 24.8 Billion |
| Market Size 2033 | US$ 41.6 Billion |
| CAGR 2026–2033 | 7.7% |
| Absolute Dollar Opportunity | US$ 16.8 Billion |
| Largest Market | Asia Pacific, 38.2% share in 2026 |
| Fastest-Growing Market | Middle East & Africa, 9.6% CAGR |
| Market Concentration | Medium |
| Major Players | EnerSys, East Penn Manufacturing Co., Inc., GS Yuasa Corporation, Exide Technologies, Hoppecke Batterien GmbH & Co. KG |
This report covers batteries built for industrial duty, including motive power for materials handling, stationary standby for uninterruptible power supplies, telecom and data centres, switchgear reserves, and mining, rail and marine auxiliary units. Electric vehicle traction batteries, grid-scale energy storage systems and consumer electronics cells are excluded. The base year is 2025, the forecast period runs from 2026 to 2033, and values are stated in US$ Billion.
Industrial Batteries Market Segmentation
Battery Type
- Flooded Lead-Acid
- Valve-Regulated Lead-Acid
- Lithium Iron Phosphate
- Other Lithium-Ion
- Nickel-Cadmium
- Flow and Other Chemistries
Application
- Motive Power
- Stationary Standby Power
- Switchgear and Utility Substation
- Mining and Heavy Equipment
- Rail and Marine Auxiliary
Capacity
- Below 100 Ah
- 100–500 Ah
- 500–1,000 Ah
- Above 1,000 Ah
End Use Industry
- Data Centres and IT
- Telecommunications
- Warehousing and Logistics
- Utilities and Power
- Manufacturing
- Mining
- Rail and Marine
- Healthcare and Commercial Buildings
Regions
- North America
- Europe
- Asia Pacific
- Latin America
- Middle East & Africa
- Executive Summary
- Global Industrial Batteries Market Snapshot
- Future Projections
- Key Report Takeaways
- Regional Snapshot
- Market Overview
- Market Definition and Report Scope
- Historical Trends 2020–2025
- Market Dynamics
- Drivers
- Computing and Telecom Uptime Commitments Keep Standby Battery Replacement Firm
- Multi-Shift Warehousing and Automated Handling Expand Motive Power Battery Demand
- Restraints
- Fire Code Approval for Lithium Installations Delays Conversion in Occupied Buildings
- Lithium Cell Supply Concentration Leaves Industrial Assemblers Exposed on Price and Allocation
- Market Opportunities
- Lead-Acid Fleet Conversion Opens a Retrofit Battery, Charger and Service Revenue Pool
- Battery Passport and Recycled Content Rules Create a Traceability and Second-Life Revenue Pool
- Drivers
- Global Industrial Batteries Market Outlook, 2020–2033
- Global Industrial Batteries Market Outlook, by Battery Type, Value (US$ Billion), 2020–2033
- Flooded Lead-Acid
- Valve-Regulated Lead-Acid
- Lithium Iron Phosphate
- Other Lithium-Ion
- Nickel-Cadmium
- Flow and Other Chemistries
- Global Industrial Batteries Market Outlook, by Application, Value (US$ Billion), 2020–2033
- Motive Power
- Stationary Standby Power
- Switchgear and Utility Substation
- Mining and Heavy Equipment
- Rail and Marine Auxiliary
- Global Industrial Batteries Market Outlook, by Capacity, Value (US$ Billion), 2020–2033
- Below 100 Ah
- 100–500 Ah
- 500–1,000 Ah
- Above 1,000 Ah
- Global Industrial Batteries Market Outlook, by End Use Industry, Value (US$ Billion), 2020–2033
- Data Centres and IT
- Telecommunications
- Warehousing and Logistics
- Utilities and Power
- Manufacturing
- Mining
- Rail and Marine
- Healthcare and Commercial Buildings
- Global Industrial Batteries Market Outlook, by Region, Value (US$ Billion), 2020–2033
- North America
- Europe
- Asia Pacific
- Latin America
- Middle East & Africa
- Global Industrial Batteries Market Outlook, by Battery Type, Value (US$ Billion), 2020–2033
- North America Industrial Batteries Market Outlook, 2020–2033
- North America Industrial Batteries Market Outlook, by Battery Type, Value (US$ Billion), 2020–2033
- Flooded Lead-Acid
- Valve-Regulated Lead-Acid
- Lithium Iron Phosphate
- Other Lithium-Ion
- Nickel-Cadmium
- Flow and Other Chemistries
- North America Industrial Batteries Market Outlook, by Application, Value (US$ Billion), 2020–2033
- Motive Power
- Stationary Standby Power
- Switchgear and Utility Substation
- Mining and Heavy Equipment
- Rail and Marine Auxiliary
- North America Industrial Batteries Market Outlook, by Capacity, Value (US$ Billion), 2020–2033
- Below 100 Ah
- 100–500 Ah
- 500–1,000 Ah
- Above 1,000 Ah
- North America Industrial Batteries Market Outlook, by End Use Industry, Value (US$ Billion), 2020–2033
- Data Centres and IT
- Telecommunications
- Warehousing and Logistics
- Utilities and Power
- Manufacturing
- Mining
- Rail and Marine
- Healthcare and Commercial Buildings
- North America Industrial Batteries Market Outlook, by Country, Value (US$ Billion), 2020–2033
- United States Industrial Batteries Market Outlook, by Battery Type, 2020–2033
- United States Industrial Batteries Market Outlook, by Application, 2020–2033
- United States Industrial Batteries Market Outlook, by Capacity, 2020–2033
- United States Industrial Batteries Market Outlook, by End Use Industry, 2020–2033
- Canada Industrial Batteries Market Outlook, by Battery Type, 2020–2033
- Canada Industrial Batteries Market Outlook, by Application, 2020–2033
- Canada Industrial Batteries Market Outlook, by Capacity, 2020–2033
- Canada Industrial Batteries Market Outlook, by End Use Industry, 2020–2033
- Mexico Industrial Batteries Market Outlook, by Battery Type, 2020–2033
- Mexico Industrial Batteries Market Outlook, by Application, 2020–2033
- Mexico Industrial Batteries Market Outlook, by Capacity, 2020–2033
- Mexico Industrial Batteries Market Outlook, by End Use Industry, 2020–2033
- North America Industrial Batteries Market Outlook, by Battery Type, Value (US$ Billion), 2020–2033
- Europe Industrial Batteries Market Outlook, 2020–2033
- Europe Industrial Batteries Market Outlook, by Battery Type, Value (US$ Billion), 2020–2033
- Flooded Lead-Acid
- Valve-Regulated Lead-Acid
- Lithium Iron Phosphate
- Other Lithium-Ion
- Nickel-Cadmium
- Flow and Other Chemistries
- Europe Industrial Batteries Market Outlook, by Application, Value (US$ Billion), 2020–2033
- Motive Power
- Stationary Standby Power
- Switchgear and Utility Substation
- Mining and Heavy Equipment
- Rail and Marine Auxiliary
- Europe Industrial Batteries Market Outlook, by Capacity, Value (US$ Billion), 2020–2033
- Below 100 Ah
- 100–500 Ah
- 500–1,000 Ah
- Above 1,000 Ah
- Europe Industrial Batteries Market Outlook, by End Use Industry, Value (US$ Billion), 2020–2033
- Data Centres and IT
- Telecommunications
- Warehousing and Logistics
- Utilities and Power
- Manufacturing
- Mining
- Rail and Marine
- Healthcare and Commercial Buildings
- Europe Industrial Batteries Market Outlook, by Country, Value (US$ Billion), 2020–2033
- Germany Industrial Batteries Market Outlook, by Battery Type, 2020–2033
- Germany Industrial Batteries Market Outlook, by Application, 2020–2033
- Germany Industrial Batteries Market Outlook, by Capacity, 2020–2033
- Germany Industrial Batteries Market Outlook, by End Use Industry, 2020–2033
- France Industrial Batteries Market Outlook, by Battery Type, 2020–2033
- France Industrial Batteries Market Outlook, by Application, 2020–2033
- France Industrial Batteries Market Outlook, by Capacity, 2020–2033
- France Industrial Batteries Market Outlook, by End Use Industry, 2020–2033
- United Kingdom Industrial Batteries Market Outlook, by Battery Type, 2020–2033
- United Kingdom Industrial Batteries Market Outlook, by Application, 2020–2033
- United Kingdom Industrial Batteries Market Outlook, by Capacity, 2020–2033
- United Kingdom Industrial Batteries Market Outlook, by End Use Industry, 2020–2033
- Italy Industrial Batteries Market Outlook, by Battery Type, 2020–2033
- Italy Industrial Batteries Market Outlook, by Application, 2020–2033
- Italy Industrial Batteries Market Outlook, by Capacity, 2020–2033
- Italy Industrial Batteries Market Outlook, by End Use Industry, 2020–2033
- Netherlands Industrial Batteries Market Outlook, by Battery Type, 2020–2033
- Netherlands Industrial Batteries Market Outlook, by Application, 2020–2033
- Netherlands Industrial Batteries Market Outlook, by Capacity, 2020–2033
- Netherlands Industrial Batteries Market Outlook, by End Use Industry, 2020–2033
- Nordic countries Industrial Batteries Market Outlook, by Battery Type, 2020–2033
- Nordic countries Industrial Batteries Market Outlook, by Application, 2020–2033
- Nordic countries Industrial Batteries Market Outlook, by Capacity, 2020–2033
- Nordic countries Industrial Batteries Market Outlook, by End Use Industry, 2020–2033
- Europe Industrial Batteries Market Outlook, by Battery Type, Value (US$ Billion), 2020–2033
- Asia Pacific Industrial Batteries Market Outlook, 2020–2033
- Asia Pacific Industrial Batteries Market Outlook, by Battery Type, Value (US$ Billion), 2020–2033
- Flooded Lead-Acid
- Valve-Regulated Lead-Acid
- Lithium Iron Phosphate
- Other Lithium-Ion
- Nickel-Cadmium
- Flow and Other Chemistries
- Asia Pacific Industrial Batteries Market Outlook, by Application, Value (US$ Billion), 2020–2033
- Motive Power
- Stationary Standby Power
- Switchgear and Utility Substation
- Mining and Heavy Equipment
- Rail and Marine Auxiliary
- Asia Pacific Industrial Batteries Market Outlook, by Capacity, Value (US$ Billion), 2020–2033
- Below 100 Ah
- 100–500 Ah
- 500–1,000 Ah
- Above 1,000 Ah
- Asia Pacific Industrial Batteries Market Outlook, by End Use Industry, Value (US$ Billion), 2020–2033
- Data Centres and IT
- Telecommunications
- Warehousing and Logistics
- Utilities and Power
- Manufacturing
- Mining
- Rail and Marine
- Healthcare and Commercial Buildings
- Asia Pacific Industrial Batteries Market Outlook, by Country, Value (US$ Billion), 2020–2033
- China Industrial Batteries Market Outlook, by Battery Type, 2020–2033
- China Industrial Batteries Market Outlook, by Application, 2020–2033
- China Industrial Batteries Market Outlook, by Capacity, 2020–2033
- China Industrial Batteries Market Outlook, by End Use Industry, 2020–2033
- Japan Industrial Batteries Market Outlook, by Battery Type, 2020–2033
- Japan Industrial Batteries Market Outlook, by Application, 2020–2033
- Japan Industrial Batteries Market Outlook, by Capacity, 2020–2033
- Japan Industrial Batteries Market Outlook, by End Use Industry, 2020–2033
- South Korea Industrial Batteries Market Outlook, by Battery Type, 2020–2033
- South Korea Industrial Batteries Market Outlook, by Application, 2020–2033
- South Korea Industrial Batteries Market Outlook, by Capacity, 2020–2033
- South Korea Industrial Batteries Market Outlook, by End Use Industry, 2020–2033
- India Industrial Batteries Market Outlook, by Battery Type, 2020–2033
- India Industrial Batteries Market Outlook, by Application, 2020–2033
- India Industrial Batteries Market Outlook, by Capacity, 2020–2033
- India Industrial Batteries Market Outlook, by End Use Industry, 2020–2033
- Taiwan Industrial Batteries Market Outlook, by Battery Type, 2020–2033
- Taiwan Industrial Batteries Market Outlook, by Application, 2020–2033
- Taiwan Industrial Batteries Market Outlook, by Capacity, 2020–2033
- Taiwan Industrial Batteries Market Outlook, by End Use Industry, 2020–2033
- Australia Industrial Batteries Market Outlook, by Battery Type, 2020–2033
- Australia Industrial Batteries Market Outlook, by Application, 2020–2033
- Australia Industrial Batteries Market Outlook, by Capacity, 2020–2033
- Australia Industrial Batteries Market Outlook, by End Use Industry, 2020–2033
- Indonesia Industrial Batteries Market Outlook, by Battery Type, 2020–2033
- Indonesia Industrial Batteries Market Outlook, by Application, 2020–2033
- Indonesia Industrial Batteries Market Outlook, by Capacity, 2020–2033
- Indonesia Industrial Batteries Market Outlook, by End Use Industry, 2020–2033
- Asia Pacific Industrial Batteries Market Outlook, by Battery Type, Value (US$ Billion), 2020–2033
- Latin America Industrial Batteries Market Outlook, 2020–2033
- Latin America Industrial Batteries Market Outlook, by Battery Type, Value (US$ Billion), 2020–2033
- Flooded Lead-Acid
- Valve-Regulated Lead-Acid
- Lithium Iron Phosphate
- Other Lithium-Ion
- Nickel-Cadmium
- Flow and Other Chemistries
- Latin America Industrial Batteries Market Outlook, by Application, Value (US$ Billion), 2020–2033
- Motive Power
- Stationary Standby Power
- Switchgear and Utility Substation
- Mining and Heavy Equipment
- Rail and Marine Auxiliary
- Latin America Industrial Batteries Market Outlook, by Capacity, Value (US$ Billion), 2020–2033
- Below 100 Ah
- 100–500 Ah
- 500–1,000 Ah
- Above 1,000 Ah
- Latin America Industrial Batteries Market Outlook, by End Use Industry, Value (US$ Billion), 2020–2033
- Data Centres and IT
- Telecommunications
- Warehousing and Logistics
- Utilities and Power
- Manufacturing
- Mining
- Rail and Marine
- Healthcare and Commercial Buildings
- Latin America Industrial Batteries Market Outlook, by Country, Value (US$ Billion), 2020–2033
- Brazil Industrial Batteries Market Outlook, by Battery Type, 2020–2033
- Brazil Industrial Batteries Market Outlook, by Application, 2020–2033
- Brazil Industrial Batteries Market Outlook, by Capacity, 2020–2033
- Brazil Industrial Batteries Market Outlook, by End Use Industry, 2020–2033
- Mexico Industrial Batteries Market Outlook, by Battery Type, 2020–2033
- Mexico Industrial Batteries Market Outlook, by Application, 2020–2033
- Mexico Industrial Batteries Market Outlook, by Capacity, 2020–2033
- Mexico Industrial Batteries Market Outlook, by End Use Industry, 2020–2033
- Chile Industrial Batteries Market Outlook, by Battery Type, 2020–2033
- Chile Industrial Batteries Market Outlook, by Application, 2020–2033
- Chile Industrial Batteries Market Outlook, by Capacity, 2020–2033
- Chile Industrial Batteries Market Outlook, by End Use Industry, 2020–2033
- Peru Industrial Batteries Market Outlook, by Battery Type, 2020–2033
- Peru Industrial Batteries Market Outlook, by Application, 2020–2033
- Peru Industrial Batteries Market Outlook, by Capacity, 2020–2033
- Peru Industrial Batteries Market Outlook, by End Use Industry, 2020–2033
- Colombia Industrial Batteries Market Outlook, by Battery Type, 2020–2033
- Colombia Industrial Batteries Market Outlook, by Application, 2020–2033
- Colombia Industrial Batteries Market Outlook, by Capacity, 2020–2033
- Colombia Industrial Batteries Market Outlook, by End Use Industry, 2020–2033
- Latin America Industrial Batteries Market Outlook, by Battery Type, Value (US$ Billion), 2020–2033
- Middle East & Africa Industrial Batteries Market Outlook, 2020–2033
- Middle East & Africa Industrial Batteries Market Outlook, by Battery Type, Value (US$ Billion), 2020–2033
- Flooded Lead-Acid
- Valve-Regulated Lead-Acid
- Lithium Iron Phosphate
- Other Lithium-Ion
- Nickel-Cadmium
- Flow and Other Chemistries
- Middle East & Africa Industrial Batteries Market Outlook, by Application, Value (US$ Billion), 2020–2033
- Motive Power
- Stationary Standby Power
- Switchgear and Utility Substation
- Mining and Heavy Equipment
- Rail and Marine Auxiliary
- Middle East & Africa Industrial Batteries Market Outlook, by Capacity, Value (US$ Billion), 2020–2033
- Below 100 Ah
- 100–500 Ah
- 500–1,000 Ah
- Above 1,000 Ah
- Middle East & Africa Industrial Batteries Market Outlook, by End Use Industry, Value (US$ Billion), 2020–2033
- Data Centres and IT
- Telecommunications
- Warehousing and Logistics
- Utilities and Power
- Manufacturing
- Mining
- Rail and Marine
- Healthcare and Commercial Buildings
- Middle East & Africa Industrial Batteries Market Outlook, by Country, Value (US$ Billion), 2020–2033
- Saudi Arabia Industrial Batteries Market Outlook, by Battery Type, 2020–2033
- Saudi Arabia Industrial Batteries Market Outlook, by Application, 2020–2033
- Saudi Arabia Industrial Batteries Market Outlook, by Capacity, 2020–2033
- Saudi Arabia Industrial Batteries Market Outlook, by End Use Industry, 2020–2033
- United Arab Emirates Industrial Batteries Market Outlook, by Battery Type, 2020–2033
- United Arab Emirates Industrial Batteries Market Outlook, by Application, 2020–2033
- United Arab Emirates Industrial Batteries Market Outlook, by Capacity, 2020–2033
- United Arab Emirates Industrial Batteries Market Outlook, by End Use Industry, 2020–2033
- Qatar Industrial Batteries Market Outlook, by Battery Type, 2020–2033
- Qatar Industrial Batteries Market Outlook, by Application, 2020–2033
- Qatar Industrial Batteries Market Outlook, by Capacity, 2020–2033
- Qatar Industrial Batteries Market Outlook, by End Use Industry, 2020–2033
- Nigeria Industrial Batteries Market Outlook, by Battery Type, 2020–2033
- Nigeria Industrial Batteries Market Outlook, by Application, 2020–2033
- Nigeria Industrial Batteries Market Outlook, by Capacity, 2020–2033
- Nigeria Industrial Batteries Market Outlook, by End Use Industry, 2020–2033
- Kenya Industrial Batteries Market Outlook, by Battery Type, 2020–2033
- Kenya Industrial Batteries Market Outlook, by Application, 2020–2033
- Kenya Industrial Batteries Market Outlook, by Capacity, 2020–2033
- Kenya Industrial Batteries Market Outlook, by End Use Industry, 2020–2033
- South Africa Industrial Batteries Market Outlook, by Battery Type, 2020–2033
- South Africa Industrial Batteries Market Outlook, by Application, 2020–2033
- South Africa Industrial Batteries Market Outlook, by Capacity, 2020–2033
- South Africa Industrial Batteries Market Outlook, by End Use Industry, 2020–2033
- Zambia Industrial Batteries Market Outlook, by Battery Type, 2020–2033
- Zambia Industrial Batteries Market Outlook, by Application, 2020–2033
- Zambia Industrial Batteries Market Outlook, by Capacity, 2020–2033
- Zambia Industrial Batteries Market Outlook, by End Use Industry, 2020–2033
- Democratic Republic of the Congo Industrial Batteries Market Outlook, by Battery Type, 2020–2033
- Democratic Republic of the Congo Industrial Batteries Market Outlook, by Application, 2020–2033
- Democratic Republic of the Congo Industrial Batteries Market Outlook, by Capacity, 2020–2033
- Democratic Republic of the Congo Industrial Batteries Market Outlook, by End Use Industry, 2020–2033
- Middle East & Africa Industrial Batteries Market Outlook, by Battery Type, Value (US$ Billion), 2020–2033
- Competitive Landscape
- Market Concentration and Industry Leaders
- Competitive Differentiation
- Strategic Moves and Market Direction
- Recent Industry Developments
- Company Profiles
- EnerSys
- East Penn Manufacturing Co., Inc.
- Exide Technologies
- GS Yuasa Corporation
- Hoppecke Batterien GmbH & Co. KG
- C&D Technologies, Inc.
- Saft Groupe S.A.
- Contemporary Amperex Technology Co. Limited
- BYD Company Limited
- Narada Power Source Co., Ltd.
- Leoch International Technology Limited
- Exide Industries Limited
- Amara Raja Energy & Mobility Limited
- Appendix
- Research Methodology
- Report Assumptions
- Acronyms and Abbreviations
Battery Type
- Flooded Lead-Acid
- Valve-Regulated Lead-Acid
- Lithium Iron Phosphate
- Other Lithium-Ion
- Nickel-Cadmium
- Flow and Other Chemistries
Application
- Motive Power
- Stationary Standby Power
- Switchgear and Utility Substation
- Mining and Heavy Equipment
- Rail and Marine Auxiliary
Capacity
- Below 100 Ah
- 100–500 Ah
- 500–1,000 Ah
- Above 1,000 Ah
End Use Industry
- Data Centres and IT
- Telecommunications
- Warehousing and Logistics
- Utilities and Power
- Manufacturing
- Mining
- Rail and Marine
- Healthcare and Commercial Buildings
Regions
- North America
- Europe
- Asia Pacific
- Latin America
- Middle East & Africa
Our Research Methodology
Considering the volatility of business today, traditional approaches to strategizing a game plan can be unfruitful if not detrimental. True ambiguity is no way to determine a forecast. A myriad of predetermined factors must be accounted for such as the degree of risk involved, the magnitude of circumstances, as well as conditions or consequences that are not known or unpredictable. To circumvent binary views that cast uncertainty, the application of market research intelligence to strategically posture, move, and enable actionable outcomes is necessary.
View Methodology
Quality Assured
Rigorous Validation Process

Confidentiality Assured
End-to-end Data Security

Custom Research Services
Tailored To Your Objectives
FAQs
The market is valued at US$ 24.8 billion in 2026, excluding electric vehicle traction batteries, grid-scale energy storage systems and consumer electronics cells.
The market is projected to reach US$ 41.6 billion by 2033, growing at a 7.7% CAGR and adding US$ 16.8 billion in absolute opportunity.
Valve-regulated lead-acid leads with 31.6% share in 2026, supported by low first cost, established recycling infrastructure and decades of field reliability data.
Lithium iron phosphate grows fastest at a 14.6% CAGR, while motive power leads applications at an 8.9% CAGR through 2033.
Asia Pacific holds 38.2% share in 2026, and concentration is medium, high in lead-acid manufacturing but fragmented among lithium pack assemblers.
Related Reports
Perovskite Photovoltaics Market Size, Share, Insights, Competitive Landscape, and Forecast 2026 to 2033
Perovskite photovoltaics market to reach US$ 4.8 billion by 2033 at 38.1% CAGR. Explore technologies, regional trends and key companies.
Microgrid Monitoring Systems Market Size, Share, Insights, Competitive Landscape, and Forecast 2026 to 2033
Microgrid monitoring systems market to reach US$ 5.5 billion by 2033 at 14.0% CAGR. Explore components, regional trends and key companies.
Carbon Dioxide Utilization Market Size, Share, Insights, Competitive Landscape, and Forecast 2026 to 2033
Carbon dioxide utilization market to reach US$ 21.6 billion by 2033 at 10.41% CAGR. Explore applications, regions and key companies.
Big Data Analytics in Oil & Gas Market Size, Share, Insights, Competitive Landscape, and Forecast 2026 to 2033
Oil & gas big data analytics market to reach US$ 30.0 billion by 2033 at 12.9% CAGR. Explore segments, regions and key companies.
AI in Oil & Gas Market Size, Share, Insights, Competitive Landscape, and Forecast 2026 to 2033
AI in oil and gas market to reach US$15.4 billion by 2033 at 19.6% CAGR. Explore technologies, applications, regional trends and leading companies.
Industrial Boilers Market Size, Share, Insights, Competitive Landscape, and Forecast 2026 to 2033
Industrial boilers market to reach US$26.0 billion by 2033 at 4.9% CAGR. Explore product types, fuels, regional trends and leading companies.