



Industrial Belt Scale Market
Industrial Belt Scale Market Size, Share, Insights, Competitive Landscape, and Forecast 2026 to 2033
Industrial Belt Scale Market Size and Trend Analysis
How Fast Is the Conveyor Belt Weighing Market Growing?
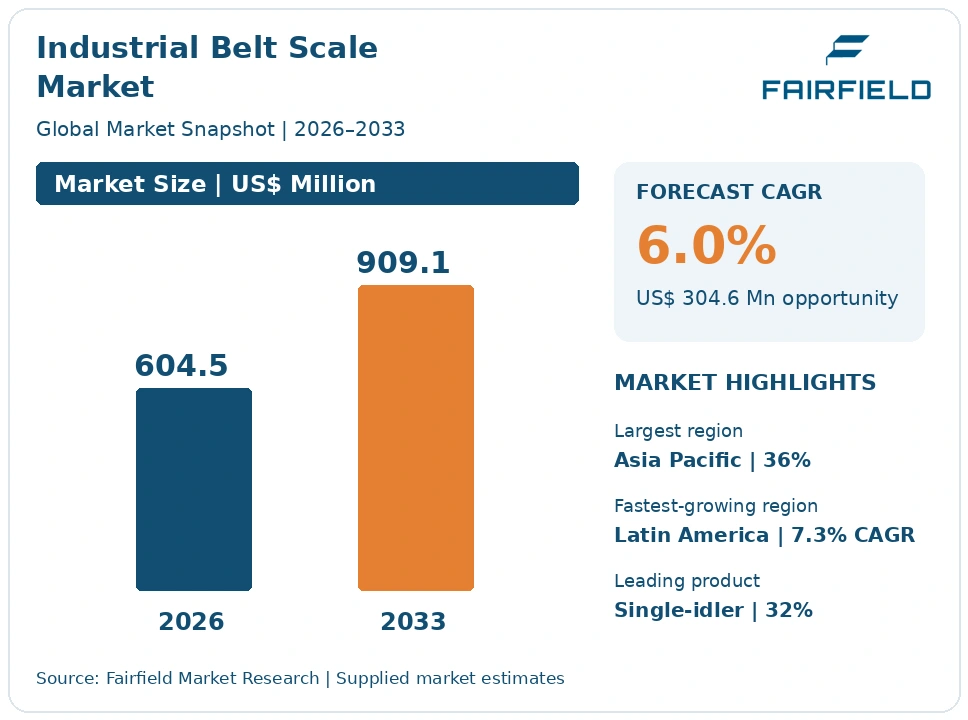
The global Industrial Belt Scale market size is expected to be valued at US$ 0.6 billion in 2026 and projected to reach US$ 0.9 billion by 2033, growing at a CAGR of 6.0% between 2026 and 2033.
In precise terms the market stands at US$ 604.5 million in 2026 and is forecast to reach US$ 909.1 million by 2033, after growing at roughly a 4.4% CAGR between 2020 and 2025. Three factors lift the pace. First, more bulk material now changes ownership on a conveyor, which requires legally approved weighing rather than estimation. Second, mines, cement plants and power stations are tightening material accountability to control cost per tonne. Third, mechanical integrators installed decades ago are being replaced with digital units that log every calibration. Growth is steady rather than dramatic, since this is an instrumentation niche tied to bulk handling capacity.
Key Report Takeaways
- By Product Type: Single-idler belt scales held 32% share in 2026, while full-frame belt scales are projected to expand at a 7.5% CAGR through 2033, as operators specify higher accuracy classes for custody transfer duties.
- By Component: Load cells accounted for 29% of 2026 revenue, while integrators and controllers are forecast to grow at a 7.8% CAGR through 2033, driven by replacement of mechanical totalisers with networked digital units.
- By Accuracy Class: Class 1 instruments held 44% share in 2026, while Class 0.5 systems are set to advance at a 7.9% CAGR through 2033, reflecting stricter approval requirements for trade-settled shipments.
- By End-Use Industry: Mining contributed 30% of 2026 demand, while ports and terminals are projected to rise at a 7.7% CAGR through 2033, supported by bulk terminal expansion and loading rate verification.
- By Geography: Asia Pacific led with 36% share in 2026, while Latin America is forecast to grow at a 7.3% CAGR through 2033, as copper and iron ore operations modernise conveyor instrumentation.
Global Industrial Belt Scale Market Trends and Insights
Drivers Impact Analysis
Two commercial forces explain most of the incremental demand for conveyor weighing systems through 2033.
| Driver | Impact on CAGR Forecast | Geographic Relevance | Impact Timeline |
| Legal-for-trade custody transfer duties under OIML R50 and the Measuring Instruments Directive | High | Europe, Asia Pacific, Latin America | Medium term 2–4 years |
| Material accountability and yield control programmes in mining, cement and power | High | Global | Long term ≥4 years |
Custody Transfer Rules Are Pushing Operators Toward Approved Conveyor Weighing Systems
Legal metrology requirements are the firmest source of demand for belt scales. When bulk material is bought, sold, taxed or billed on the basis of a conveyor measurement, the instrument must hold a type approval and be verified in service. Operators that previously accepted indicative weighing must now install approved equipment, keep verification records and submit to periodic inspection, which converts a maintenance item into a regulated asset with a defined replacement cycle.
The framework is specific. OIML R 50 sets requirements for continuous totalising automatic weighing instruments, and the Measuring Instruments Directive 2014/32/EU applies them in the European Union through Annex MI-006. In the United States, NIST Handbook 44 defines tolerances for belt-conveyor scale systems and the National Type Evaluation Program certifies designs before state weights and measures officials approve their use. Port terminals, cement despatch and coal supply contracts are the applications where approval is non-negotiable.
Tonne-Level Material Accountability Is Making Belt Scales a Process Control Instrument
Belt scales are increasingly bought as process instruments rather than as commercial meters. Mines, cement plants and power stations track mass flow at every transfer point to reconcile stockpiles, measure plant recovery and control cost per tonne. A single percentage point of unexplained loss across a high-throughput circuit represents real money, so operators install more scales per site than they did a decade ago and connect them to plant historians.
The mechanism is economic rather than regulatory. In cement, kiln feed and clinker rates set fuel consumption, so weighing accuracy feeds directly into energy cost per tonne. In coal-fired generation, blend ratios and heat rate calculations depend on belt measurements. In mineral processing, feed tonnage underpins recovery and reagent dosing. Weigh feeders extend the same principle to controlled dosing, which is why they are now specified alongside measurement-only scales on new circuits.
Restraints Impact Analysis
Two technical realities limit both accuracy in service and the willingness to upgrade.
| Restraint | Impact on CAGR Forecast | Geographic Relevance | Impact Timeline |
| Cost and production disruption of in-situ calibration with test chains and material tests | High | Global | Long term ≥4 years |
| Belt tension, alignment and idler condition degrading accuracy class in service | Medium | Asia Pacific, Latin America, Middle East & Africa | Medium term 2–4 years |
In-Situ Calibration Cost and Conveyor Downtime Limit Belt Scale Upgrades
Calibration, not purchase price, is the expense that shapes buying behaviour in conveyor weighing. A belt scale must be calibrated on its own conveyor, under running conditions, and verification for trade use generally requires a material test using a known mass weighed on a reference instrument. That takes the conveyor out of production, occupies several people and must be repeated at set intervals, so operators limit how many approved scales they install.
The cost sources are specific and recurring. A material test needs a reference weighbridge, haulage and a quantity of product circulated through the system, while chain calibration requires handling equipment and a full belt run. On remote mine sites, travel and accommodation for a qualified technician can exceed the labour charge. Because lost conveying time at a bulk terminal carries a high hourly value, calibration is frequently deferred, which weakens confidence in the measurement.
Belt Tension, Alignment and Idler Wear Erode Accuracy Class After Commissioning
Mechanical condition determines whether a belt scale holds the accuracy class it was approved for. A system certified to Class 0.5 on a correctly aligned conveyor can drift well outside tolerance once idlers wear, the belt mistracks or tension changes with load and temperature. Buyers who have experienced this drift become reluctant to specify higher accuracy classes, because they doubt the installation will sustain the performance they paid for.
The underlying causes are structural and environmental. Belt scales measure a small load difference against a large tare, so stiffness of the conveyor frame, idler alignment either side of the weigh area, splice passage, and material build-up on the belt all introduce error. Wind loading on long open conveyors, temperature effects on load cells, and vibration from nearby crushers add further variation. Correcting these conditions requires conveyor engineering work that sits outside the instrument supplier’s scope.
Market Opportunities
Replacing Mechanical Integrators With Digital Units Opens a Large Retrofit Pool
The installed base of mechanical and early analogue integrators is the clearest near-term revenue pool in conveyor weighing. Many operating sites still run totalisers that display a count but hold no calibration history, no diagnostics and no network connection. Replacing the integrator while keeping the existing weighframe, load cells and speed sensor is a low-cost, low-disruption project, which lets suppliers sell into sites that would never fund a complete scale replacement.
Instrument suppliers and their distributors are positioned to capture this, with demand from maintenance and metering teams at cement plants, power stations and older mining operations. Digital integrators add stored calibration records, linearisation across the load range, fault alarms and standard industrial protocols that feed plant historians directly. For legal-for-trade sites the stored audit trail is particularly valuable, since it simplifies the evidence required at periodic verification by an inspection body.
Remote Calibration Monitoring Creates a Recurring Service Revenue Stream
Continuous accuracy monitoring turns a periodic calibration visit into an ongoing service contract. Instead of waiting for a scheduled material test, suppliers can track zero drift, span checks, load cell imbalance and speed sensor signal quality remotely, then intervene only when the data indicates a problem. This reduces unnecessary site visits, shortens conveyor downtime and gives operators defensible evidence of measurement quality between formal verifications.
Instrument makers, service specialists and large distributors can build this business, with demand strongest among multi-site operators in mining, cement and port handling that cannot keep metrology staff at every location. Automatic zero tracking and electronic span verification routines supply much of the underlying data without stopping production. Rising expectations for documented measurement in emissions reporting and contract settlement give operators an additional reason to pay for continuous assurance rather than annual checks.
Segment Analysis
By Product Type: Single-Idler Scales Lead Volume While Full-Frame Systems Grow Fastest
Single-idler belt scales held 32% share in 2026, the largest product type, because they are the lowest-cost option for process measurement and suit the majority of plant transfer points where indicative accuracy is sufficient. Two-idler and multi-idler designs follow, offering better averaging over belt irregularities, and weigh feeders occupy a distinct niche where dosing control matters as much as measurement. Full-frame belt scales are the fastest-growing type at a 7.5% CAGR to 2033, because weighing across a longer span reduces the influence of individual idler alignment and makes higher accuracy classes achievable in service. The commercial implication is a widening price spread: process-duty scales face strong price competition, while approved high-accuracy installations command premium pricing and pull calibration services along with them.
By Component: Load Cells Carry the Largest Share as Digital Integrators Expand Quickest
Load cells accounted for 29% of 2026 revenue, the largest component category, since every weighframe carries multiple cells and they are the part most often replaced after overload or moisture ingress. Weighframes and mechanical assemblies, speed sensors, and calibration and field services make up the remainder. Integrators and controllers are the fastest-growing component at a 7.8% CAGR through 2033, as sites replace mechanical totalisers with digital units that store calibration history, run diagnostics and publish mass flow over industrial networks. Suppliers benefit from this shift because electronics carry higher gross margin than fabricated steel and create a route into service agreements. It also changes the buying centre: integrator upgrades are often approved by instrumentation and control teams rather than by bulk handling engineers.
By Accuracy Class: Class 1 Dominates Installed Duty While Class 0.5 Gains Share
Class 1 instruments held 44% share in 2026, the largest accuracy class, covering most inventory, process control and internal accountability duties where a one percent tolerance is commercially acceptable. Class 2 systems remain common on older process conveyors and in lower-value material flows. Class 0.5 is the fastest-growing class at a 7.9% CAGR to 2033, driven by contracts settled directly on conveyor measurement, where buyers and sellers want the tightest practical tolerance and regulators require type approval under OIML R 50. Class 0.2 remains a small, specialised group. The trend raises the engineering content of each sale, because achieving a tighter class depends on conveyor design, idler quality and calibration discipline as much as on the instrument, which favours suppliers with field engineering depth.
By End-Use Industry: Mining Anchors Demand While Ports and Terminals Grow Fastest
Mining accounted for 30% of 2026 demand, the largest end-use industry, reflecting the number of conveyors in a modern mine and the value of accurate feed and product tonnage for plant recovery calculations. Aggregates and cement follow, with power generation, agriculture and food processing, and chemicals and fertilizers contributing steady volumes. Ports and terminals form the fastest-growing end use at a 7.7% CAGR to 2033, because bulk terminals are expanding capacity and increasingly settle loading and discharge quantities on belt measurement rather than draft survey. The pattern matters for suppliers because terminal projects specify approved instruments, redundant measurement and documented verification, so the revenue per installation is well above the average process-duty scale sold into a plant. Mining demand is also broadening beyond coal and iron ore into battery raw materials such as lithium, copper and cobalt, where new concentrator circuits install weighing at every major transfer point.
Geography Analysis
North America Buys Belt Scales Under a Strict Weights and Measures Regime
North America holds 22% share in 2026 and grows at a 5.0% CAGR to 2033. The United States accounts for most of the demand, spread across coal and aggregate handling, cement production, grain terminals on the Mississippi and the Great Lakes, and copper and gold mining in the west. Canada adds potash, oil sands and forest product handling. The distinguishing feature is regulatory: NIST Handbook 44 sets tolerances, the National Type Evaluation Program certifies designs, and state weights and measures officials enforce verification, so suppliers must hold current certificates to compete. Grain and fertilizer handling under dust-hazard classification also raises specification requirements. The main change is retrofit activity, as ageing integrators at long-established plants are replaced with networked digital units.
Europe Links Belt Scale Specification to Legal Metrology and Explosive Atmosphere Rules
Europe represents 21% of 2026 demand and expands at a 4.6% CAGR, the slowest regional rate, reflecting a mature installed base. Germany, France, Poland, Italy and Spain host most of the activity through cement production, aggregates, steel, chemicals and major bulk ports including Rotterdam, Antwerp and Hamburg. Legal-for-trade use is governed by the Measuring Instruments Directive 2014/32/EU, with Annex MI-006 covering automatic weighing instruments, while ATEX requirements apply where scales sit in coal, biomass or grain dust zones. Declining domestic coal handling has removed one traditional source of demand. Biomass and waste-derived fuel handling partly replaces it, and these materials demand careful weighing because their value varies with moisture content.
Which Region Is Leading the Industrial Belt Scale Market?
Asia Pacific leads the industrial belt scale market with 36% share in 2026, growing at a 6.8% CAGR to 2033. China alone operates an enormous population of conveyors across coal mining, thermal power, cement and steel, and supports a deep base of domestic scale manufacturers that compete hard on price. India adds rapid growth in cement capacity, coal handling plants and port infrastructure. Australia and Indonesia contribute high-specification demand from iron ore, coal and bauxite export terminals, where loading quantities are settled contractually. Japan and South Korea add steel and cement duty. The region leads simply because it moves the most bulk material, and export terminal operators are steadily upgrading to approved, higher accuracy class instruments.
Which Region Is Growing Fastest in the Industrial Belt Scale Market?
Latin America is growing fastest at a 7.3% CAGR to 2033, from 11% share in 2026. Chile and Peru drive demand through copper concentrators, where long overland conveyors carry ore and concentrate between remote sites and ports. Brazil adds iron ore, bauxite, sugar, soybean and cement handling, with major export terminals settling cargo quantities on conveyor measurement. Mexico and Colombia contribute cement and coal duty. Barriers remain real: import duties raise landed instrument costs, qualified calibration technicians are concentrated near mining hubs, and currency movements complicate service contracts. The change shaping the region is the shift from truck haulage to overland conveying on large mining projects, which multiplies the number of measurement points per operation.
Middle East & Africa Adds Belt Scale Demand From Mining and Cement Capacity
Middle East & Africa accounts for 10% of 2026 demand and grows at a 6.6% CAGR. South Africa leads through coal, platinum, chrome and manganese operations with extensive conveyor networks. Saudi Arabia and the United Arab Emirates add cement, aggregates, phosphate and aluminium handling, while Egypt, Morocco, Zambia and the Democratic Republic of the Congo contribute phosphate, copper and cobalt duty. Bulk export terminals on the Red Sea and the Gulf specify approved instruments for cargo settlement. Barriers include limited local calibration infrastructure, long lead times for spare parts and heavy dust loading that shortens component life. The opportunity lies in service partnerships, since operators increasingly prefer suppliers that can guarantee regional verification support rather than ship instruments alone.
Competitive Landscape
The market is moderately concentrated, with a clear split between global instrument groups and regional specialists. A handful of established suppliers hold strong positions in approved, high accuracy class systems for custody transfer, where type approval certificates, a service network and a reference list of terminal installations form genuine barriers to entry. Below that tier the market fragments quickly: many national manufacturers build competent process-duty scales, and in China and India local producers supply the bulk of standard installations at prices that imported equipment cannot match.
Competition rests on approvals, accuracy retained in service and the ability to calibrate. Buyers compare type approval coverage in their jurisdiction, demonstrated performance after commissioning, availability of a technician who can perform a material test at short notice, and the quality of the integrator’s diagnostics and data interfaces. Price is decisive only in process-duty applications. New approaches are coming from load cell and electronics specialists who supply digital weighing modules to scale builders, and from conveyor engineering firms bundling weighing into belt system contracts.
Strategic activity concentrates on service coverage and electronics. Suppliers are extending calibration and verification networks into mining regions where travel time dominates service economics, since a guaranteed response window often wins the contract. They are also modernising integrator platforms with stored calibration histories, standard industrial protocols and remote diagnostics, because these features move the sale from a replacement part to a monitored asset. Several firms bundle weighing with related bulk handling instruments such as belt scanners and sampling systems.
Strategic direction across the supplier group is consistent: approvals in more jurisdictions, data-rich integrators, condition monitoring that reduces unnecessary site visits, and designs that tolerate dust, vibration and misalignment. Firms including Siemens, Thermo Fisher Scientific, Schenck Process Group, Mettler-Toledo International, Precia Molen, Rice Lake Weighing Systems and Thayer Scale are visible across these themes in differing measure.
Industrial Belt Scale Industry Leaders
- Siemens
- Thermo Fisher Scientific
- Schenck Process Group
- Mettler-Toledo International
- Precia Molen
Recent Industry Developments
April 2016: The Measuring Instruments Directive 2014/32/EU became applicable across the European Union, with Annex MI-006 covering automatic weighing instruments – it fixed the conformity assessment route that continuous totalising belt weighers must follow for legal-for-trade use in member states.
April 2016: The ATEX Directive 2014/34/EU became applicable to equipment intended for potentially explosive atmospheres – a requirement that directly shapes belt scale, load cell and integrator selection in coal, biomass, grain and fertilizer handling zones.
January 2025: The 2025 edition of NIST Handbook 44 took effect in the United States, maintaining the tolerance and installation requirements for belt-conveyor scale systems that state weights and measures officials enforce – the annual cycle keeps approved designs under continuous review.
Industrial Belt Scale Market Report Scope
| Metric | Value |
| Study Period | 2020–2033 |
| Market Size 2026 | US$ 0.6 Billion |
| Market Size 2033 | US$ 0.9 Billion |
| CAGR 2026–2033 | 6.0% |
| Absolute Dollar Opportunity | US$ 0.3 Billion |
| Largest Market | Asia Pacific (36% share in 2026) |
| Fastest-Growing Market | Latin America (7.3% CAGR) |
| Market Concentration | Medium |
| Major Players | Siemens, Thermo Fisher Scientific, Schenck Process Group, Mettler-Toledo International, Precia Molen |
This report covers conveyor belt weighing systems for continuous bulk material measurement: single, multi and full-frame belt scales, weigh feeders, load cells, speed sensors, integrators and controllers, plus calibration and verification services. Static weighbridges, hopper and tank weighing, checkweighers and laboratory balances are excluded. The base year is 2025, and the forecast period runs from 2026 to 2033, with all values expressed in US$ Billion.
Industrial Belt Scale Market Segmentation
Product Type
- Single-Idler Belt Scales
- Two-Idler Belt Scales
- Multi-Idler Belt Scales
- Full-Frame Belt Scales
- Weigh Feeders
Component
- Load Cells
- Speed Sensors
- Integrators and Controllers
- Weighframes and Mechanical Assemblies
- Calibration and Services
Accuracy Class
- Class 0.2
- Class 0.5
- Class 1
- Class 2
End-Use Industry
- Mining
- Aggregates and Cement
- Power Generation
- Ports and Terminals
- Agriculture and Food Processing
- Chemicals and Fertilizers
Regions
- North America
- Europe
- Asia Pacific
- Latin America
- Middle East & Africa
- Executive Summary
- Global Industrial Belt Scale Market Snapshot
- Future Projections
- Key Report Takeaways
- Regional Snapshot
- Market Overview
- Market Definition and Report Scope
- Historical Trends 2020–2025
- Market Dynamics
- Drivers
- Custody Transfer Rules Are Pushing Operators Toward Approved Conveyor Weighing Systems
- Tonne-Level Material Accountability Is Making Belt Scales a Process Control Instrument
- Restraints
- In-Situ Calibration Cost and Conveyor Downtime Limit Belt Scale Upgrades
- Belt Tension, Alignment and Idler Wear Erode Accuracy Class After Commissioning
- Market Opportunities
- Replacing Mechanical Integrators With Digital Units Opens a Large Retrofit Pool
- Remote Calibration Monitoring Creates a Recurring Service Revenue Stream
- Drivers
- Global Industrial Belt Scale Market Outlook, 2020–2033
- Global Industrial Belt Scale Market Outlook, by Product Type, Value (US$ Billion), 2020–2033
- Single-Idler Belt Scales
- Two-Idler Belt Scales
- Multi-Idler Belt Scales
- Full-Frame Belt Scales
- Weigh Feeders
- Global Industrial Belt Scale Market Outlook, by Component, Value (US$ Billion), 2020–2033
- Load Cells
- Speed Sensors
- Integrators and Controllers
- Weighframes and Mechanical Assemblies
- Calibration and Services
- Global Industrial Belt Scale Market Outlook, by Accuracy Class, Value (US$ Billion), 2020–2033
- Class 0.2
- Class 0.5
- Class 1
- Class 2
- Global Industrial Belt Scale Market Outlook, by End-Use Industry, Value (US$ Billion), 2020–2033
- Mining
- Aggregates and Cement
- Power Generation
- Ports and Terminals
- Agriculture and Food Processing
- Chemicals and Fertilizers
- Global Industrial Belt Scale Market Outlook, by Region, Value (US$ Billion), 2020–2033
- North America
- Europe
- Asia Pacific
- Latin America
- Middle East & Africa
- Global Industrial Belt Scale Market Outlook, by Product Type, Value (US$ Billion), 2020–2033
- North America Industrial Belt Scale Market Outlook, 2020–2033
- North America Industrial Belt Scale Market Outlook, by Product Type, Value (US$ Billion), 2020–2033
- Single-Idler Belt Scales
- Two-Idler Belt Scales
- Multi-Idler Belt Scales
- Full-Frame Belt Scales
- Weigh Feeders
- North America Industrial Belt Scale Market Outlook, by Component, Value (US$ Billion), 2020–2033
- Load Cells
- Speed Sensors
- Integrators and Controllers
- Weighframes and Mechanical Assemblies
- Calibration and Services
- North America Industrial Belt Scale Market Outlook, by Accuracy Class, Value (US$ Billion), 2020–2033
- Class 0.2
- Class 0.5
- Class 1
- Class 2
- North America Industrial Belt Scale Market Outlook, by End-Use Industry, Value (US$ Billion), 2020–2033
- Mining
- Aggregates and Cement
- Power Generation
- Ports and Terminals
- Agriculture and Food Processing
- Chemicals and Fertilizers
- North America Industrial Belt Scale Market Outlook, by Country, Value (US$ Billion), 2020–2033
- United States Industrial Belt Scale Market Outlook, by Product Type, 2020–2033
- United States Industrial Belt Scale Market Outlook, by Component, 2020–2033
- United States Industrial Belt Scale Market Outlook, by Accuracy Class, 2020–2033
- United States Industrial Belt Scale Market Outlook, by End-Use Industry, 2020–2033
- Canada Industrial Belt Scale Market Outlook, by Product Type, 2020–2033
- Canada Industrial Belt Scale Market Outlook, by Component, 2020–2033
- Canada Industrial Belt Scale Market Outlook, by Accuracy Class, 2020–2033
- Canada Industrial Belt Scale Market Outlook, by End-Use Industry, 2020–2033
- North America Industrial Belt Scale Market Outlook, by Product Type, Value (US$ Billion), 2020–2033
- Europe Industrial Belt Scale Market Outlook, 2020–2033
- Europe Industrial Belt Scale Market Outlook, by Product Type, Value (US$ Billion), 2020–2033
- Single-Idler Belt Scales
- Two-Idler Belt Scales
- Multi-Idler Belt Scales
- Full-Frame Belt Scales
- Weigh Feeders
- Europe Industrial Belt Scale Market Outlook, by Component, Value (US$ Billion), 2020–2033
- Load Cells
- Speed Sensors
- Integrators and Controllers
- Weighframes and Mechanical Assemblies
- Calibration and Services
- Europe Industrial Belt Scale Market Outlook, by Accuracy Class, Value (US$ Billion), 2020–2033
- Class 0.2
- Class 0.5
- Class 1
- Class 2
- Europe Industrial Belt Scale Market Outlook, by End-Use Industry, Value (US$ Billion), 2020–2033
- Mining
- Aggregates and Cement
- Power Generation
- Ports and Terminals
- Agriculture and Food Processing
- Chemicals and Fertilizers
- Europe Industrial Belt Scale Market Outlook, by Country, Value (US$ Billion), 2020–2033
- Germany Industrial Belt Scale Market Outlook, by Product Type, 2020–2033
- Germany Industrial Belt Scale Market Outlook, by Component, 2020–2033
- Germany Industrial Belt Scale Market Outlook, by Accuracy Class, 2020–2033
- Germany Industrial Belt Scale Market Outlook, by End-Use Industry, 2020–2033
- France Industrial Belt Scale Market Outlook, by Product Type, 2020–2033
- France Industrial Belt Scale Market Outlook, by Component, 2020–2033
- France Industrial Belt Scale Market Outlook, by Accuracy Class, 2020–2033
- France Industrial Belt Scale Market Outlook, by End-Use Industry, 2020–2033
- Poland Industrial Belt Scale Market Outlook, by Product Type, 2020–2033
- Poland Industrial Belt Scale Market Outlook, by Component, 2020–2033
- Poland Industrial Belt Scale Market Outlook, by Accuracy Class, 2020–2033
- Poland Industrial Belt Scale Market Outlook, by End-Use Industry, 2020–2033
- Italy Industrial Belt Scale Market Outlook, by Product Type, 2020–2033
- Italy Industrial Belt Scale Market Outlook, by Component, 2020–2033
- Italy Industrial Belt Scale Market Outlook, by Accuracy Class, 2020–2033
- Italy Industrial Belt Scale Market Outlook, by End-Use Industry, 2020–2033
- Spain Industrial Belt Scale Market Outlook, by Product Type, 2020–2033
- Spain Industrial Belt Scale Market Outlook, by Component, 2020–2033
- Spain Industrial Belt Scale Market Outlook, by Accuracy Class, 2020–2033
- Spain Industrial Belt Scale Market Outlook, by End-Use Industry, 2020–2033
- Europe Industrial Belt Scale Market Outlook, by Product Type, Value (US$ Billion), 2020–2033
- Asia Pacific Industrial Belt Scale Market Outlook, 2020–2033
- Asia Pacific Industrial Belt Scale Market Outlook, by Product Type, Value (US$ Billion), 2020–2033
- Single-Idler Belt Scales
- Two-Idler Belt Scales
- Multi-Idler Belt Scales
- Full-Frame Belt Scales
- Weigh Feeders
- Asia Pacific Industrial Belt Scale Market Outlook, by Component, Value (US$ Billion), 2020–2033
- Load Cells
- Speed Sensors
- Integrators and Controllers
- Weighframes and Mechanical Assemblies
- Calibration and Services
- Asia Pacific Industrial Belt Scale Market Outlook, by Accuracy Class, Value (US$ Billion), 2020–2033
- Class 0.2
- Class 0.5
- Class 1
- Class 2
- Asia Pacific Industrial Belt Scale Market Outlook, by End-Use Industry, Value (US$ Billion), 2020–2033
- Mining
- Aggregates and Cement
- Power Generation
- Ports and Terminals
- Agriculture and Food Processing
- Chemicals and Fertilizers
- Asia Pacific Industrial Belt Scale Market Outlook, by Country, Value (US$ Billion), 2020–2033
- China Industrial Belt Scale Market Outlook, by Product Type, 2020–2033
- China Industrial Belt Scale Market Outlook, by Component, 2020–2033
- China Industrial Belt Scale Market Outlook, by Accuracy Class, 2020–2033
- China Industrial Belt Scale Market Outlook, by End-Use Industry, 2020–2033
- India Industrial Belt Scale Market Outlook, by Product Type, 2020–2033
- India Industrial Belt Scale Market Outlook, by Component, 2020–2033
- India Industrial Belt Scale Market Outlook, by Accuracy Class, 2020–2033
- India Industrial Belt Scale Market Outlook, by End-Use Industry, 2020–2033
- Australia Industrial Belt Scale Market Outlook, by Product Type, 2020–2033
- Australia Industrial Belt Scale Market Outlook, by Component, 2020–2033
- Australia Industrial Belt Scale Market Outlook, by Accuracy Class, 2020–2033
- Australia Industrial Belt Scale Market Outlook, by End-Use Industry, 2020–2033
- Indonesia Industrial Belt Scale Market Outlook, by Product Type, 2020–2033
- Indonesia Industrial Belt Scale Market Outlook, by Component, 2020–2033
- Indonesia Industrial Belt Scale Market Outlook, by Accuracy Class, 2020–2033
- Indonesia Industrial Belt Scale Market Outlook, by End-Use Industry, 2020–2033
- Japan Industrial Belt Scale Market Outlook, by Product Type, 2020–2033
- Japan Industrial Belt Scale Market Outlook, by Component, 2020–2033
- Japan Industrial Belt Scale Market Outlook, by Accuracy Class, 2020–2033
- Japan Industrial Belt Scale Market Outlook, by End-Use Industry, 2020–2033
- South Korea Industrial Belt Scale Market Outlook, by Product Type, 2020–2033
- South Korea Industrial Belt Scale Market Outlook, by Component, 2020–2033
- South Korea Industrial Belt Scale Market Outlook, by Accuracy Class, 2020–2033
- South Korea Industrial Belt Scale Market Outlook, by End-Use Industry, 2020–2033
- Asia Pacific Industrial Belt Scale Market Outlook, by Product Type, Value (US$ Billion), 2020–2033
- Latin America Industrial Belt Scale Market Outlook, 2020–2033
- Latin America Industrial Belt Scale Market Outlook, by Product Type, Value (US$ Billion), 2020–2033
- Single-Idler Belt Scales
- Two-Idler Belt Scales
- Multi-Idler Belt Scales
- Full-Frame Belt Scales
- Weigh Feeders
- Latin America Industrial Belt Scale Market Outlook, by Component, Value (US$ Billion), 2020–2033
- Load Cells
- Speed Sensors
- Integrators and Controllers
- Weighframes and Mechanical Assemblies
- Calibration and Services
- Latin America Industrial Belt Scale Market Outlook, by Accuracy Class, Value (US$ Billion), 2020–2033
- Class 0.2
- Class 0.5
- Class 1
- Class 2
- Latin America Industrial Belt Scale Market Outlook, by End-Use Industry, Value (US$ Billion), 2020–2033
- Mining
- Aggregates and Cement
- Power Generation
- Ports and Terminals
- Agriculture and Food Processing
- Chemicals and Fertilizers
- Latin America Industrial Belt Scale Market Outlook, by Country, Value (US$ Billion), 2020–2033
- Chile Industrial Belt Scale Market Outlook, by Product Type, 2020–2033
- Chile Industrial Belt Scale Market Outlook, by Component, 2020–2033
- Chile Industrial Belt Scale Market Outlook, by Accuracy Class, 2020–2033
- Chile Industrial Belt Scale Market Outlook, by End-Use Industry, 2020–2033
- Peru Industrial Belt Scale Market Outlook, by Product Type, 2020–2033
- Peru Industrial Belt Scale Market Outlook, by Component, 2020–2033
- Peru Industrial Belt Scale Market Outlook, by Accuracy Class, 2020–2033
- Peru Industrial Belt Scale Market Outlook, by End-Use Industry, 2020–2033
- Brazil Industrial Belt Scale Market Outlook, by Product Type, 2020–2033
- Brazil Industrial Belt Scale Market Outlook, by Component, 2020–2033
- Brazil Industrial Belt Scale Market Outlook, by Accuracy Class, 2020–2033
- Brazil Industrial Belt Scale Market Outlook, by End-Use Industry, 2020–2033
- Mexico Industrial Belt Scale Market Outlook, by Product Type, 2020–2033
- Mexico Industrial Belt Scale Market Outlook, by Component, 2020–2033
- Mexico Industrial Belt Scale Market Outlook, by Accuracy Class, 2020–2033
- Mexico Industrial Belt Scale Market Outlook, by End-Use Industry, 2020–2033
- Colombia Industrial Belt Scale Market Outlook, by Product Type, 2020–2033
- Colombia Industrial Belt Scale Market Outlook, by Component, 2020–2033
- Colombia Industrial Belt Scale Market Outlook, by Accuracy Class, 2020–2033
- Colombia Industrial Belt Scale Market Outlook, by End-Use Industry, 2020–2033
- Latin America Industrial Belt Scale Market Outlook, by Product Type, Value (US$ Billion), 2020–2033
- Middle East & Africa Industrial Belt Scale Market Outlook, 2020–2033
- Middle East & Africa Industrial Belt Scale Market Outlook, by Product Type, Value (US$ Billion), 2020–2033
- Single-Idler Belt Scales
- Two-Idler Belt Scales
- Multi-Idler Belt Scales
- Full-Frame Belt Scales
- Weigh Feeders
- Middle East & Africa Industrial Belt Scale Market Outlook, by Component, Value (US$ Billion), 2020–2033
- Load Cells
- Speed Sensors
- Integrators and Controllers
- Weighframes and Mechanical Assemblies
- Calibration and Services
- Middle East & Africa Industrial Belt Scale Market Outlook, by Accuracy Class, Value (US$ Billion), 2020–2033
- Class 0.2
- Class 0.5
- Class 1
- Class 2
- Middle East & Africa Industrial Belt Scale Market Outlook, by End-Use Industry, Value (US$ Billion), 2020–2033
- Mining
- Aggregates and Cement
- Power Generation
- Ports and Terminals
- Agriculture and Food Processing
- Chemicals and Fertilizers
- Middle East & Africa Industrial Belt Scale Market Outlook, by Country, Value (US$ Billion), 2020–2033
- South Africa Industrial Belt Scale Market Outlook, by Product Type, 2020–2033
- South Africa Industrial Belt Scale Market Outlook, by Component, 2020–2033
- South Africa Industrial Belt Scale Market Outlook, by Accuracy Class, 2020–2033
- South Africa Industrial Belt Scale Market Outlook, by End-Use Industry, 2020–2033
- Saudi Arabia Industrial Belt Scale Market Outlook, by Product Type, 2020–2033
- Saudi Arabia Industrial Belt Scale Market Outlook, by Component, 2020–2033
- Saudi Arabia Industrial Belt Scale Market Outlook, by Accuracy Class, 2020–2033
- Saudi Arabia Industrial Belt Scale Market Outlook, by End-Use Industry, 2020–2033
- United Arab Emirates Industrial Belt Scale Market Outlook, by Product Type, 2020–2033
- United Arab Emirates Industrial Belt Scale Market Outlook, by Component, 2020–2033
- United Arab Emirates Industrial Belt Scale Market Outlook, by Accuracy Class, 2020–2033
- United Arab Emirates Industrial Belt Scale Market Outlook, by End-Use Industry, 2020–2033
- Egypt Industrial Belt Scale Market Outlook, by Product Type, 2020–2033
- Egypt Industrial Belt Scale Market Outlook, by Component, 2020–2033
- Egypt Industrial Belt Scale Market Outlook, by Accuracy Class, 2020–2033
- Egypt Industrial Belt Scale Market Outlook, by End-Use Industry, 2020–2033
- Morocco Industrial Belt Scale Market Outlook, by Product Type, 2020–2033
- Morocco Industrial Belt Scale Market Outlook, by Component, 2020–2033
- Morocco Industrial Belt Scale Market Outlook, by Accuracy Class, 2020–2033
- Morocco Industrial Belt Scale Market Outlook, by End-Use Industry, 2020–2033
- Zambia Industrial Belt Scale Market Outlook, by Product Type, 2020–2033
- Zambia Industrial Belt Scale Market Outlook, by Component, 2020–2033
- Zambia Industrial Belt Scale Market Outlook, by Accuracy Class, 2020–2033
- Zambia Industrial Belt Scale Market Outlook, by End-Use Industry, 2020–2033
- Democratic Republic of the Congo Industrial Belt Scale Market Outlook, by Product Type, 2020–2033
- Democratic Republic of the Congo Industrial Belt Scale Market Outlook, by Component, 2020–2033
- Democratic Republic of the Congo Industrial Belt Scale Market Outlook, by Accuracy Class, 2020–2033
- Democratic Republic of the Congo Industrial Belt Scale Market Outlook, by End-Use Industry, 2020–2033
- Middle East & Africa Industrial Belt Scale Market Outlook, by Product Type, Value (US$ Billion), 2020–2033
- Competitive Landscape
- Market Concentration and Industry Leaders
- Competitive Differentiation
- Strategic Moves and Market Direction
- Recent Industry Developments
- Company Profiles
- Siemens
- Thermo Fisher Scientific
- Schenck Process Group
- Mettler-Toledo International
- Precia Molen
- Rice Lake Weighing Systems
- Avery Weigh-Tronix
- Thayer Scale
- Tecnetics Industries
- Beltway Scales
- Control Systems Technology
- Flintec
- Vishay Precision Group
- Hardy Process Solutions
- Kanawha Scales & Systems
- Appendix
- Research Methodology
- Report Assumptions
- Acronyms and Abbreviations
Product Type
- Single-Idler Belt Scales
- Two-Idler Belt Scales
- Multi-Idler Belt Scales
- Full-Frame Belt Scales
- Weigh Feeders
Component
- Load Cells
- Speed Sensors
- Integrators and Controllers
- Weighframes and Mechanical Assemblies
- Calibration and Services
Accuracy Class
- Class 0.2
- Class 0.5
- Class 1
- Class 2
End-Use Industry
- Mining
- Aggregates and Cement
- Power Generation
- Ports and Terminals
- Agriculture and Food Processing
- Chemicals and Fertilizers
Regions
- North America
- Europe
- Asia Pacific
- Latin America
- Middle East & Africa
Our Research Methodology
Considering the volatility of business today, traditional approaches to strategizing a game plan can be unfruitful if not detrimental. True ambiguity is no way to determine a forecast. A myriad of predetermined factors must be accounted for such as the degree of risk involved, the magnitude of circumstances, as well as conditions or consequences that are not known or unpredictable. To circumvent binary views that cast uncertainty, the application of market research intelligence to strategically posture, move, and enable actionable outcomes is necessary.
View Methodology
Quality Assured
Rigorous Validation Process

Confidentiality Assured
End-to-end Data Security

Custom Research Services
Tailored To Your Objectives
FAQs
The market is valued at US$ 604.5 million in 2026, covering belt scales, weigh feeders, load cells, integrators and the calibration services supporting them.
Revenue is projected to reach US$ 909.1 million by 2033 at a 6.0% CAGR, giving an absolute dollar opportunity of about US$ 0.3 billion.
Single-idler belt scales hold 32% share in 2026, because they are the lowest-cost option for the process-duty transfer points that dominate installations.
Ports and terminals grow fastest at a 7.7% CAGR through 2033, as bulk terminals expand and settle cargo quantities on conveyor measurement.
Asia Pacific leads with 36% share in 2026, because it moves more bulk material through coal, cement, steel and export terminal conveyors than anywhere else.
Related Reports
Industrial Automation and Control System Market Size, Share, Insights, Competitive Landscape, and Forecast 2026 to 2033
Industrial automation and control system market to reach US$289.7 billion by 2033 at 6.8% CAGR. Explore trends, segments, regions and key players.
Fabric Filter Market Size, Share, Insights, Competitive Landscape, and Forecast 2026 to 2033
The global fabric filter market is valued at US$11.2 billion in 2026, reaching US$16.4 billion by 2033, growing at a 5.6% CAGR
Grow Lights Market Size, Share, Insights, Competitive Landscape, and Forecast 2026 to 2033
The global grow lights market is valued at US$4.1 billion in 2026, reaching US$7.7 billion by 2033, growing at a 9.4% CAGR
Ground Penetrating Radar Market Size, Share, Insights, Competitive Landscape, and Forecast 2026 to 2033
The global ground penetrating radar market is valued at US$0.70 billion in 2026, reaching US$1.20 billion by 2033, growing at an 8.0% CAGR
3D Machine Vision Market Size, Share, Insights, Competitive Landscape, and Forecast 2026 to 2033
The global 3D machine vision market is valued at US$9.10 billion in 2026, reaching US$22.30 billion by 2033, growing at a 13.7% CAGR
3D Laser Scanner Market Size, Share, Insights, Competitive Landscape, and Forecast 2026 to 2033
The global 3D laser scanner market is valued at US$2.00 billion in 2026, reaching US$3.66 billion by 2033, growing at a 9.0% CAGR