



Industrial Biomanufacturing Market
Industrial Biomanufacturing Market Size, Share, Insights, Competitive Landscape, and Forecast 2026 to 2033
Industrial Biomanufacturing Market Size and Trend Analysis
How Fast Will Industrial Biomanufacturing Grow Through 2033?
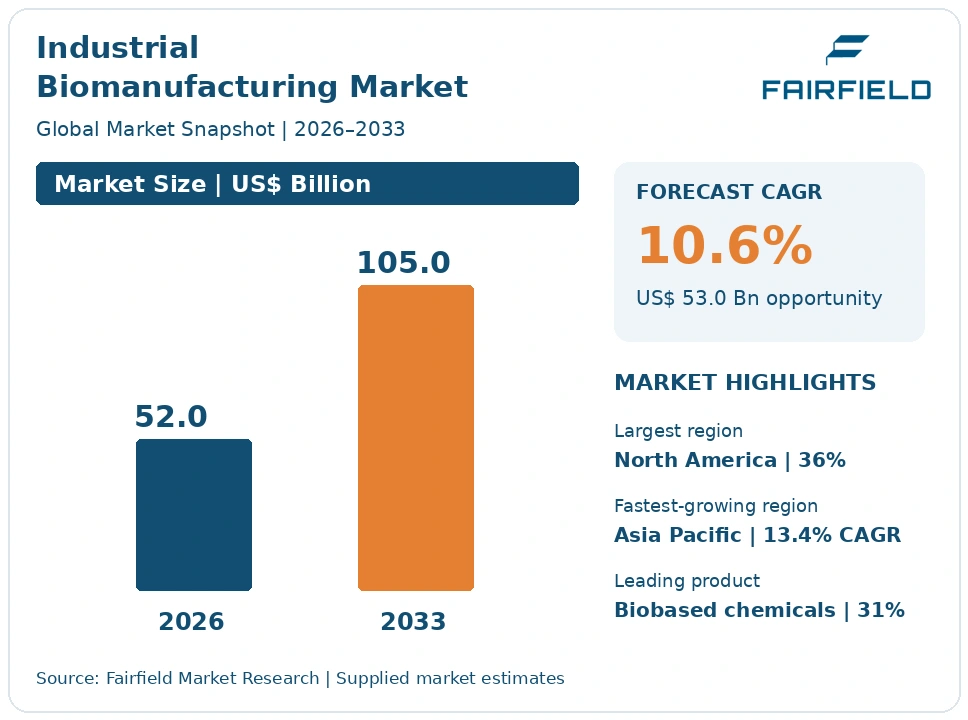
The global industrial biomanufacturing market size is expected to be valued at US$ 52.0 billion in 2026 and projected to reach US$ 105.0 billion by 2033, growing at a CAGR of 10.6% between 2026 and 2033.
Between 2020 and 2025 the sector expanded at roughly 9.1% a year, slower than early forecasts because commercial-scale tanks stayed scarce. Three factors now carry growth. Public procurement rules reward biobased carbon content, strain and enzyme engineering keep cutting titre-related costs, and food, materials and agriculture buyers want supply chains independent of crude oil. Growth remains capacity-constrained rather than demand-constrained. Fermentation volume, not customer interest, sets the ceiling in most product lines. The direction through 2033 is steady compounding led by ingredients, enzymes and specialty chemicals, with commodity displacement of petrochemicals progressing only where scale and feedstock economics genuinely align.
Key Report Takeaways
- By Product Type: Biobased Chemicals & Polymer Intermediates held 31% share in 2026, while Precision-Fermentation Proteins & Ingredients is projected to expand at a 15.8% CAGR through 2033, driven by regulatory clearance of fermentation-derived dairy and egg proteins.
- By Process Technology: Biomass Fermentation held 42% share in 2026, while Precision Fermentation is projected to expand at a 15.4% CAGR through 2033, supported by falling strain development timelines and better analytical control of product purity.
- By Feedstock: First-Generation Sugars held 56% share in 2026, while Waste Gases & C1 Feedstocks is projected to expand at a 14.9% CAGR through 2033, reflecting gas fermentation plants built beside steel and refinery off-gas streams.
- By End-Use Industry: Chemicals & Materials held 29% share in 2026, while Food & Beverage Ingredients is projected to expand at a 14.2% CAGR through 2033, as brand owners reformulate around animal-free proteins, fats and sweeteners.
- By Geography: North America held 36% share in 2026, while Asia Pacific is projected to expand at a 13.4% CAGR through 2033, helped by low-cost sugar feedstock and new contract fermentation capacity.
Global Industrial Biomanufacturing Market Trends and Insights
Drivers Impact Analysis
The two drivers below carry the strongest measurable effect on fermentation-based production volumes through 2033.
| Driver | Impact on CAGR Forecast | Geographic Relevance | Impact Timeline |
| Biobased procurement policy and bioeconomy programmes | High | North America, Europe | Medium term 2–4 years |
| Strain engineering and enzyme performance gains | High | Global | Long term ≥4 years |
Public Biobased Procurement Rules Pull Fermentation Products Into Mainstream Supply Chains
Government purchasing rules are now a dependable demand floor for industrial biotechnology output. The USDA BioPreferred programme obliges federal agencies and their contractors to prefer qualifying biobased products, and ASTM D6866 radiocarbon testing gives buyers an auditable biobased carbon figure. That combination converts a sustainability preference into a procurement specification, which purchasing managers can defend internally.
The causal chain runs from verification to contracts. Once biobased content is measurable, it can be written into tenders, so fermentation-derived surfactants, lubricants, solvents and polymer intermediates compete on a defined attribute rather than on price alone. Europe adds the same pull through bioeconomy policy and the coming EU Biotech Act, while the National Biotechnology and Biomanufacturing Initiative in the United States directs federal research and purchasing toward domestic fermentation capacity and biobased chemicals.
Strain and Enzyme Engineering Gains Lower Fermentation Cost per Kilogram
Better biology is the main reason unit costs are falling across industrial fermentation. Higher product titres, faster growth rates and cleaner by-product profiles let a producer extract more saleable kilograms from the same tank hours. Because tank time is the scarcest input in this sector, every titre improvement effectively adds capacity without new steel, which widens the range of molecules that can be made profitably.
Three technical changes drive this. Automated design-build-test cycles compress strain development from years to months, machine learning narrows the enzyme variants worth testing in the laboratory, and improved downstream processing recovers more product from each broth. Industrial enzymes themselves benefit, since engineered variants work at higher temperatures and lower doses in detergents, textiles, baking and animal feed. The result is a slow, compounding reduction in cost per kilogram across biobased chemicals.
Restraints Impact Analysis
Both restraints below are structural and will shape achievable volumes well beyond the forecast period.
| Restraint | Impact on CAGR Forecast | Geographic Relevance | Impact Timeline |
| Shortage of commercial-scale fermentation capacity | High | Global | Long term ≥4 years |
| Cost per kilogram above petrochemical incumbents | High | Global | Long term ≥4 years |
Shortage of Commercial-Scale Fermentation Tanks Caps Industrial Biomanufacturing Output
Large-tank scarcity is the binding constraint on this market. Outside pharmaceutical manufacturing, the installed base of fermenters above 200,000 litres is small and heavily booked, so promising products stall between pilot batches and commercial supply. Several early movers have been wound up or had assets written down after failing to secure affordable volume, and that pattern has made lenders noticeably more cautious about new greenfield plants.
The cause is capital intensity combined with asset specificity. A commercial fermentation train needs tanks, utilities, sterile air, cooling and tailored downstream separation, and installed cost per litre stays high because much of the equipment cannot be bought as standard packages. Sterilisation, cleaning and turnaround also consume tank hours that generate no product. Purpose-built plants suit one process family, so repurposing idle assets for another molecule is slower and dearer than buyers expect.
Cost per Kilogram Above Petrochemical Incumbents Slows Buyer Switching
For most molecules, fermentation output still costs more per kilogram than the petrochemical equivalent, and that gap governs adoption. Procurement teams in chemicals, coatings and packaging work to tight specifications and thin margins, so they accept a premium only where a regulation, a customer mandate or a genuine performance advantage justifies it. Volumes therefore concentrate in specialty applications rather than commodity tonnage.
The cost structure explains why. Feedstock sugar, tank depreciation, utilities and separation each carry real expense, and dilute aqueous broths make recovery and purification unusually energy-hungry compared with distilling a hydrocarbon stream. Petrochemical plants also run at a scale fermentation rarely matches, spreading fixed costs across far more tonnes. Until titres, yields and plant utilisation all improve together, biobased chemicals will keep competing on attributes rather than on landed cost.
Market Opportunities
Waste Gas and Residue Feedstocks Open a Cheaper Carbon Pool for Fermentation
Non-food carbon sources represent the clearest untapped revenue pool in industrial biotechnology. Steel mill off-gas, refinery gases, captured carbon dioxide, agricultural residues and glycerol by-products can be bought far below refined sugar, and several are liabilities their owners will pay to remove. Converting that carbon into ethanol, acetone, proteins or polymer precursors creates margin that sugar-fed routes cannot reach at the same scale.
Capture favours operators who can site plants beside the emitter and handle variable gas composition. Heavy industry supplies the feedstock, while fuel blenders, chemical buyers and animal nutrition firms supply the demand. Lignocellulosic residue processing benefits from the same logic where pretreatment costs are controlled. Supportive policy helps, as biobased content verification and low-carbon fuel rules both reward carbon that never passed through a food crop.
Contract Fermentation and Downstream Processing Services Create a Capacity-as-a-Service Pool
Selling tank time is becoming a business in its own right. Because scarce capacity is the sector’s bottleneck, owners of commercial-scale fermenters, centrifuges, filtration trains and spray dryers can earn reliable fees without taking product risk. Toll manufacturing, process transfer, scale-up engineering and analytical services together form a services pool that grows even when individual product ventures fail.
Food ingredient developers, biosurfactant firms and materials start-ups create most of this demand, since few can finance their own plant. Established fermentation operators in brewing, enzymes, amino acids and citric acid are well placed to convert idle or convertible capacity into contract revenue. Strain engineering providers extend the same model upstream. Regulatory frameworks reinforce it, because a contract site with documented food-grade controls shortens novel food and safety review for its customers.
Segment Analysis
By Product Type: Biobased Chemicals Lead While Precision-Fermentation Ingredients Accelerate
Biobased Chemicals & Polymer Intermediates led product type with 31% share in 2026, because organic acids, diols, solvents and polymer precursors already have established buyers and proven process routes. Lactic and succinic acid chemistry, bio-based 1,3-propanediol and fermentation-derived monomers plug directly into existing polymer plants, so customers need no new equipment. Precision-Fermentation Proteins & Ingredients is the fastest-growing product type at a 15.8% CAGR to 2033, as dairy, egg and structural proteins clear food safety review and enter commercial products. Industrial Enzymes remain the most profitable line per litre of capacity, while Biosurfactants and mycelium-based materials stay small but grow quickly. For producers, the implication is clear: specialty value, not commodity tonnage, funds the next round of capacity.
By Process Technology: Biomass Fermentation Dominates as Precision Fermentation Scales Faster
Biomass Fermentation held 42% of 2026 revenue, reflecting decades of installed capacity in ethanol, amino acids, organic acids and yeast products. These processes use robust organisms, tolerate feedstock variation and run in plants that are already paid down, which keeps their cost base hard to beat. Precision Fermentation is expanding fastest at a 15.4% CAGR, because engineered microbes can make a single defined molecule at high purity, which commands ingredient-grade pricing. Enzymatic Biocatalysis occupies a middle position, converting substrates in simpler reactors without full cell cultivation. Cell-free synthesis remains early and capital-light but is limited by cofactor costs and short enzyme lifetimes. Process choice also dictates plant design, since precision routes demand tighter sterility, finer analytical control and more elaborate purification trains than classical biomass fermentation. The practical consequence is a two-speed industry, where legacy fermentation funds cash flow and precision routes attract investment.
By Feedstock: First-Generation Sugars Still Dominate While Waste Gases Grow Quickest
First-Generation Sugars supplied 56% of fermentation feedstock value in 2026, as corn dextrose and sugarcane syrup are clean, consistent and available in tonnage quantities near existing plants. Process developers prefer them because yields are predictable and regulatory questions are minimal. Waste Gases & C1 Feedstocks form the fastest-growing category at a 14.9% CAGR, since carbon monoxide, methane and captured carbon dioxide cost little and carry a strong emissions story. Lignocellulosic residues sit between the two, held back by pretreatment cost and enzyme loading rather than by availability. Glycerol and lipid by-products serve niche oleochemical and biosurfactant routes where their fatty acid profile is an advantage rather than a compromise. Feedstock cost typically accounts for a large share of variable production expense, so even modest price differences change which molecules are viable. Feedstock choice increasingly determines plant siting, pushing new projects toward mills, refineries and agricultural processing hubs rather than traditional chemical parks.
By End-Use Industry: Chemicals and Materials Lead While Food Ingredients Expand Fastest
Chemicals & Materials was the largest end-use industry with 29% share in 2026, driven by coatings, lubricants, detergents, packaging and textile chemistry buyers who can specify biobased carbon content in tenders. These customers purchase in tonnage and sign multi-year contracts, which suits fermentation economics. Food & Beverage Ingredients is growing fastest at a 14.2% CAGR, as proteins, fats, sweeteners and flavour compounds made by precision fermentation reach retail products. Agriculture and animal nutrition follow, using fermentation-derived feed enzymes and biostimulants. Personal care adopts biosurfactants for mildness and biodegradability, while textile processors use enzymes to cut water and energy use in finishing. Energy and fuels remain volume-heavy but price-sensitive, and only move when fuel policy or carbon pricing closes the gap with refined hydrocarbons. For suppliers, the lesson is that regulated, specification-driven buyers pay best for verified biobased performance.
Geography Analysis
Which Region Is Leading the Industrial Biomanufacturing Market?
North America leads the industrial biomanufacturing market with 36% share in 2026, built on abundant corn-derived sugar, deep venture and project finance, and the broadest base of pilot and demonstration plants. The United States supplies most of that value, with Canada contributing enzyme and ingredient production. Federal policy reinforces the position: the National Biotechnology and Biomanufacturing Initiative directs research funding and procurement toward domestic production, while the USDA BioPreferred programme and FDA generally recognised as safe notifications give biobased chemicals and fermentation-derived food ingredients a defined route to market. The main regional constraint is the same one seen worldwide, namely too few commercial-scale tanks. The clearest opportunity is converting underused ethanol and amino acid assets into higher-value contract fermentation capacity near existing feedstock supply.
Europe Pairs Strict Contained-Use Rules With Deep Bioeconomy Policy Support
Europe holds roughly 27% of 2026 revenue and grows at about 9.3% annually, anchored by Germany, the Netherlands, France and Denmark. The region has unusual strength in industrial enzymes, biosurfactants and fermentation know-how, supported by long-established research clusters and strong downstream chemical buyers. Regulation shapes practice closely: Directive 2009/41/EC governs the contained use of genetically modified micro-organisms, Directive 2001/18/EC covers deliberate release, and Regulation (EU) 2015/2283 gates novel food ingredients. Those rules raise compliance effort but give approved products durable credibility. The announced EU Biotech Act and the bloc’s bioeconomy strategy aim to speed scale-up decisions. The principal barrier is energy and utility cost, which weighs heavily on energy-intensive separation and drying steps.
Which Region Is Growing Fastest in the Industrial Biomanufacturing Market?
Asia Pacific is the fastest-growing geography, expanding at a 13.4% CAGR between 2026 and 2033 from 26% share in 2026. China leads on installed fermentation volume, having built very large amino acid, organic acid, vitamin and enzyme plants that now pivot toward higher-value molecules. India adds low-cost sugar feedstock, strong process engineering and a growing contract fermentation base. Singapore, Japan and South Korea contribute precision fermentation, alternative protein and strain engineering capability supported by national bioeconomy programmes. Lower installed cost per litre is the decisive advantage, because plants can be built for less than comparable Western projects. The main risks are feedstock competition with food use and uneven approval pathways for fermentation-derived ingredients across national regulators.
Latin America Turns Sugarcane Feedstock Advantage Into Fermentation Investment
Latin America accounts for about 7% of 2026 revenue and should grow near 11.2% annually, with Brazil the decisive market. Sugarcane delivers the cheapest fermentable carbon available at scale anywhere, and decades of ethanol operation have created engineers, logistics and co-located mills that new projects can use. Argentina, Colombia and Mexico add smaller enzyme, organic acid and ingredient operations. Barriers are real: project finance is costly, currency volatility complicates long payback investments, and downstream purification capacity is thinner than fermentation capacity, so higher-purity products often need export processing. The clearest change underway is the shift from fuel ethanol toward chemicals, biosurfactants and proteins that earn more revenue from each tonne of cane sugar.
Middle East & Africa Builds Early Capacity Around Food Security and Diversification
Middle East & Africa represents roughly 4% of 2026 revenue, growing at about 9.8% yearly from a small installed base. Gulf states fund fermentation projects as part of economic diversification, pairing petrochemical engineering skills with sovereign capital, while South Africa has established enzyme and ingredient activity. Food security motivates much of the interest, since fermentation can produce proteins and nutritional ingredients without arable land or large water withdrawals. Barriers dominate the near term: limited local strain engineering talent, dependence on imported equipment, immature approval pathways for novel ingredients, and high cooling loads in hot climates that raise utility costs. The notable opportunity lies in gas fermentation, where abundant industrial carbon streams could feed protein and chemical production.
Competitive Landscape
The industrial biomanufacturing market is moderately concentrated, and concentration differs sharply by product line. Industrial enzymes are dominated by a few large producers with deep strain libraries and global service networks, while biobased chemicals, biosurfactants and fermentation-derived food ingredients remain fragmented across diversified chemical and ingredient groups, specialist fermentation firms and venture-funded developers. Consolidation has been shaped as much by failure as by acquisition, because several early-stage producers have exited and their assets have changed hands at discounts, transferring scarce capacity to better-capitalised owners.
Competition rests on access to tank capacity, demonstrated cost per kilogram at commercial scale, strain performance, downstream purification skill and regulatory track record. Buyers increasingly ask for audited biobased carbon content and food-grade documentation before signing supply agreements, so quality systems are a competitive asset rather than an overhead. New entrants arrive from two directions: strain engineering and automation specialists moving downstream into production, and established fermentation operators in brewing, ethanol and amino acids moving upstream into higher-value molecules.
Strategic activity is concentrated on securing capacity rather than on expanding portfolios. Common moves include tolling agreements with contract fermentation sites, joint ventures that share construction risk, co-location with sugar mills or industrial gas sources, and partnerships pairing a technology owner with a manufacturer that already holds steel in the ground. Several participants have narrowed their pipelines to one or two molecules with credible route-to-scale economics.
Strategic direction across the sector now favours disciplined scale-up. Vendors are building asset-light models, licensing processes, validating unit economics at demonstration scale before committing capital, and choosing applications where customers pay for a verified attribute. That shift reflects hard lessons about capital intensity in fermentation.
Industrial Biomanufacturing Industry Leaders
- Novonesis
- BASF SE
- DSM-Firmenich
- Cargill, Incorporated
- Ginkgo Bioworks Holdings, Inc.
Recent Industry Developments
May 2009: the European Union adopted Directive 2009/41/EC on the contained use of genetically modified micro-organisms – it remains the baseline compliance framework for engineered production strains used in European fermentation plants.
January 2018: Regulation (EU) 2015/2283 on novel foods became applicable across the European Union – it created the single authorisation route that precision-fermentation food ingredients must clear before commercial sale.
September 2022: the United States issued an executive order on advancing biotechnology and biomanufacturing innovation, launching the National Biotechnology and Biomanufacturing Initiative – it tied federal research funding and procurement to domestic non-pharmaceutical fermentation capacity.
March 2024: the European Commission adopted a communication on boosting biotechnology and biomanufacturing in the European Union and signalled preparation of an EU Biotech Act – it set the direction for a dedicated legislative route to faster industrial scale-up.
Industrial Biomanufacturing Market Report Scope
| Metric | Value |
| Study Period | 2020–2033 |
| Market Size 2026 | US$ 52.0 Billion |
| Market Size 2033 | US$ 105.0 Billion |
| CAGR 2026–2033 | 10.6% |
| Absolute Dollar Opportunity | US$ 53.0 Billion |
| Largest Market | North America (36% share in 2026) |
| Fastest-Growing Market | Asia Pacific (13.4% CAGR) |
| Market Concentration | Medium |
| Major Players | Novonesis, BASF SE, DSM-Firmenich, Cargill, Incorporated, Ginkgo Bioworks Holdings, Inc. |
This report covers biological production of non-pharmaceutical goods at commercial scale. Included are precision fermentation ingredients, industrial enzymes, biobased chemicals and polymer intermediates, biosurfactants, mycelium and cell-derived materials, fermentation-derived biofuels, and the contract fermentation, bioreactor and strain engineering services behind them. Manufacture of biologic drugs is excluded, as it forms a separate market. The base year is 2025 and the forecast period runs from 2026 to 2033, in US$ Billion.
Industrial Biomanufacturing Market Segmentation
Product Type
- Biobased Chemicals & Polymer Intermediates
- Industrial Enzymes
- Precision-Fermentation Proteins & Ingredients
- Biosurfactants
- Mycelium & Cell-Derived Materials
- Fermentation-Derived Biofuels
Process Technology
- Biomass Fermentation
- Precision Fermentation
- Enzymatic Biocatalysis
- Cell-Free Synthesis
Feedstock
- First-Generation Sugars
- Lignocellulosic & Agricultural Residues
- Waste Gases & C1 Feedstocks
- Glycerol & Lipid By-Products
End-Use Industry
- Chemicals & Materials
- Food & Beverage Ingredients
- Agriculture & Animal Nutrition
- Personal Care & Home Care
- Energy & Fuels
- Textiles
Regions
- North America
- Europe
- Asia Pacific
- Latin America
- Middle East & Africa
- Executive Summary
- Global Industrial Biomanufacturing Market Snapshot
- Future Projections
- Key Report Takeaways
- Regional Snapshot
- Market Overview
- Market Definition and Report Scope
- Historical Trends 2020–2025
- Market Dynamics
- Drivers
- Public Biobased Procurement Rules Pull Fermentation Products Into Mainstream Supply Chains
- Strain and Enzyme Engineering Gains Lower Fermentation Cost per Kilogram
- Restraints
- Shortage of Commercial-Scale Fermentation Tanks Caps Industrial Biomanufacturing Output
- Cost per Kilogram Above Petrochemical Incumbents Slows Buyer Switching
- Market Opportunities
- Waste Gas and Residue Feedstocks Open a Cheaper Carbon Pool for Fermentation
- Contract Fermentation and Downstream Processing Services Create a Capacity-as-a-Service Pool
- Drivers
- Global Industrial Biomanufacturing Market Outlook, 2020–2033
- Global Industrial Biomanufacturing Market Outlook, by Product Type, Value (US$ Billion), 2020–2033
- Biobased Chemicals & Polymer Intermediates
- Industrial Enzymes
- Precision-Fermentation Proteins & Ingredients
- Biosurfactants
- Mycelium & Cell-Derived Materials
- Fermentation-Derived Biofuels
- Global Industrial Biomanufacturing Market Outlook, by Process Technology, Value (US$ Billion), 2020–2033
- Biomass Fermentation
- Precision Fermentation
- Enzymatic Biocatalysis
- Cell-Free Synthesis
- Global Industrial Biomanufacturing Market Outlook, by Feedstock, Value (US$ Billion), 2020–2033
- First-Generation Sugars
- Lignocellulosic & Agricultural Residues
- Waste Gases & C1 Feedstocks
- Glycerol & Lipid By-Products
- Global Industrial Biomanufacturing Market Outlook, by End-Use Industry, Value (US$ Billion), 2020–2033
- Chemicals & Materials
- Food & Beverage Ingredients
- Agriculture & Animal Nutrition
- Personal Care & Home Care
- Energy & Fuels
- Textiles
- Global Industrial Biomanufacturing Market Outlook, by Region, Value (US$ Billion), 2020–2033
- North America
- Europe
- Asia Pacific
- Latin America
- Middle East & Africa
- Global Industrial Biomanufacturing Market Outlook, by Product Type, Value (US$ Billion), 2020–2033
- North America Industrial Biomanufacturing Market Outlook, 2020–2033
- North America Industrial Biomanufacturing Market Outlook, by Product Type, Value (US$ Billion), 2020–2033
- Biobased Chemicals & Polymer Intermediates
- Industrial Enzymes
- Precision-Fermentation Proteins & Ingredients
- Biosurfactants
- Mycelium & Cell-Derived Materials
- Fermentation-Derived Biofuels
- North America Industrial Biomanufacturing Market Outlook, by Process Technology, Value (US$ Billion), 2020–2033
- Biomass Fermentation
- Precision Fermentation
- Enzymatic Biocatalysis
- Cell-Free Synthesis
- North America Industrial Biomanufacturing Market Outlook, by Feedstock, Value (US$ Billion), 2020–2033
- First-Generation Sugars
- Lignocellulosic & Agricultural Residues
- Waste Gases & C1 Feedstocks
- Glycerol & Lipid By-Products
- North America Industrial Biomanufacturing Market Outlook, by End-Use Industry, Value (US$ Billion), 2020–2033
- Chemicals & Materials
- Food & Beverage Ingredients
- Agriculture & Animal Nutrition
- Personal Care & Home Care
- Energy & Fuels
- Textiles
- North America Industrial Biomanufacturing Market Outlook, by Country, Value (US$ Billion), 2020–2033
- United States Industrial Biomanufacturing Market Outlook, by Product Type, 2020–2033
- United States Industrial Biomanufacturing Market Outlook, by Process Technology, 2020–2033
- United States Industrial Biomanufacturing Market Outlook, by Feedstock, 2020–2033
- United States Industrial Biomanufacturing Market Outlook, by End-Use Industry, 2020–2033
- Canada Industrial Biomanufacturing Market Outlook, by Product Type, 2020–2033
- Canada Industrial Biomanufacturing Market Outlook, by Process Technology, 2020–2033
- Canada Industrial Biomanufacturing Market Outlook, by Feedstock, 2020–2033
- Canada Industrial Biomanufacturing Market Outlook, by End-Use Industry, 2020–2033
- North America Industrial Biomanufacturing Market Outlook, by Product Type, Value (US$ Billion), 2020–2033
- Europe Industrial Biomanufacturing Market Outlook, 2020–2033
- Europe Industrial Biomanufacturing Market Outlook, by Product Type, Value (US$ Billion), 2020–2033
- Biobased Chemicals & Polymer Intermediates
- Industrial Enzymes
- Precision-Fermentation Proteins & Ingredients
- Biosurfactants
- Mycelium & Cell-Derived Materials
- Fermentation-Derived Biofuels
- Europe Industrial Biomanufacturing Market Outlook, by Process Technology, Value (US$ Billion), 2020–2033
- Biomass Fermentation
- Precision Fermentation
- Enzymatic Biocatalysis
- Cell-Free Synthesis
- Europe Industrial Biomanufacturing Market Outlook, by Feedstock, Value (US$ Billion), 2020–2033
- First-Generation Sugars
- Lignocellulosic & Agricultural Residues
- Waste Gases & C1 Feedstocks
- Glycerol & Lipid By-Products
- Europe Industrial Biomanufacturing Market Outlook, by End-Use Industry, Value (US$ Billion), 2020–2033
- Chemicals & Materials
- Food & Beverage Ingredients
- Agriculture & Animal Nutrition
- Personal Care & Home Care
- Energy & Fuels
- Textiles
- Europe Industrial Biomanufacturing Market Outlook, by Country, Value (US$ Billion), 2020–2033
- Germany Industrial Biomanufacturing Market Outlook, by Product Type, 2020–2033
- Germany Industrial Biomanufacturing Market Outlook, by Process Technology, 2020–2033
- Germany Industrial Biomanufacturing Market Outlook, by Feedstock, 2020–2033
- Germany Industrial Biomanufacturing Market Outlook, by End-Use Industry, 2020–2033
- Netherlands Industrial Biomanufacturing Market Outlook, by Product Type, 2020–2033
- Netherlands Industrial Biomanufacturing Market Outlook, by Process Technology, 2020–2033
- Netherlands Industrial Biomanufacturing Market Outlook, by Feedstock, 2020–2033
- Netherlands Industrial Biomanufacturing Market Outlook, by End-Use Industry, 2020–2033
- France Industrial Biomanufacturing Market Outlook, by Product Type, 2020–2033
- France Industrial Biomanufacturing Market Outlook, by Process Technology, 2020–2033
- France Industrial Biomanufacturing Market Outlook, by Feedstock, 2020–2033
- France Industrial Biomanufacturing Market Outlook, by End-Use Industry, 2020–2033
- Denmark Industrial Biomanufacturing Market Outlook, by Product Type, 2020–2033
- Denmark Industrial Biomanufacturing Market Outlook, by Process Technology, 2020–2033
- Denmark Industrial Biomanufacturing Market Outlook, by Feedstock, 2020–2033
- Denmark Industrial Biomanufacturing Market Outlook, by End-Use Industry, 2020–2033
- Europe Industrial Biomanufacturing Market Outlook, by Product Type, Value (US$ Billion), 2020–2033
- Asia Pacific Industrial Biomanufacturing Market Outlook, 2020–2033
- Asia Pacific Industrial Biomanufacturing Market Outlook, by Product Type, Value (US$ Billion), 2020–2033
- Biobased Chemicals & Polymer Intermediates
- Industrial Enzymes
- Precision-Fermentation Proteins & Ingredients
- Biosurfactants
- Mycelium & Cell-Derived Materials
- Fermentation-Derived Biofuels
- Asia Pacific Industrial Biomanufacturing Market Outlook, by Process Technology, Value (US$ Billion), 2020–2033
- Biomass Fermentation
- Precision Fermentation
- Enzymatic Biocatalysis
- Cell-Free Synthesis
- Asia Pacific Industrial Biomanufacturing Market Outlook, by Feedstock, Value (US$ Billion), 2020–2033
- First-Generation Sugars
- Lignocellulosic & Agricultural Residues
- Waste Gases & C1 Feedstocks
- Glycerol & Lipid By-Products
- Asia Pacific Industrial Biomanufacturing Market Outlook, by End-Use Industry, Value (US$ Billion), 2020–2033
- Chemicals & Materials
- Food & Beverage Ingredients
- Agriculture & Animal Nutrition
- Personal Care & Home Care
- Energy & Fuels
- Textiles
- Asia Pacific Industrial Biomanufacturing Market Outlook, by Country, Value (US$ Billion), 2020–2033
- China Industrial Biomanufacturing Market Outlook, by Product Type, 2020–2033
- China Industrial Biomanufacturing Market Outlook, by Process Technology, 2020–2033
- China Industrial Biomanufacturing Market Outlook, by Feedstock, 2020–2033
- China Industrial Biomanufacturing Market Outlook, by End-Use Industry, 2020–2033
- India Industrial Biomanufacturing Market Outlook, by Product Type, 2020–2033
- India Industrial Biomanufacturing Market Outlook, by Process Technology, 2020–2033
- India Industrial Biomanufacturing Market Outlook, by Feedstock, 2020–2033
- India Industrial Biomanufacturing Market Outlook, by End-Use Industry, 2020–2033
- Singapore Industrial Biomanufacturing Market Outlook, by Product Type, 2020–2033
- Singapore Industrial Biomanufacturing Market Outlook, by Process Technology, 2020–2033
- Singapore Industrial Biomanufacturing Market Outlook, by Feedstock, 2020–2033
- Singapore Industrial Biomanufacturing Market Outlook, by End-Use Industry, 2020–2033
- Japan Industrial Biomanufacturing Market Outlook, by Product Type, 2020–2033
- Japan Industrial Biomanufacturing Market Outlook, by Process Technology, 2020–2033
- Japan Industrial Biomanufacturing Market Outlook, by Feedstock, 2020–2033
- Japan Industrial Biomanufacturing Market Outlook, by End-Use Industry, 2020–2033
- South Korea Industrial Biomanufacturing Market Outlook, by Product Type, 2020–2033
- South Korea Industrial Biomanufacturing Market Outlook, by Process Technology, 2020–2033
- South Korea Industrial Biomanufacturing Market Outlook, by Feedstock, 2020–2033
- South Korea Industrial Biomanufacturing Market Outlook, by End-Use Industry, 2020–2033
- Asia Pacific Industrial Biomanufacturing Market Outlook, by Product Type, Value (US$ Billion), 2020–2033
- Latin America Industrial Biomanufacturing Market Outlook, 2020–2033
- Latin America Industrial Biomanufacturing Market Outlook, by Product Type, Value (US$ Billion), 2020–2033
- Biobased Chemicals & Polymer Intermediates
- Industrial Enzymes
- Precision-Fermentation Proteins & Ingredients
- Biosurfactants
- Mycelium & Cell-Derived Materials
- Fermentation-Derived Biofuels
- Latin America Industrial Biomanufacturing Market Outlook, by Process Technology, Value (US$ Billion), 2020–2033
- Biomass Fermentation
- Precision Fermentation
- Enzymatic Biocatalysis
- Cell-Free Synthesis
- Latin America Industrial Biomanufacturing Market Outlook, by Feedstock, Value (US$ Billion), 2020–2033
- First-Generation Sugars
- Lignocellulosic & Agricultural Residues
- Waste Gases & C1 Feedstocks
- Glycerol & Lipid By-Products
- Latin America Industrial Biomanufacturing Market Outlook, by End-Use Industry, Value (US$ Billion), 2020–2033
- Chemicals & Materials
- Food & Beverage Ingredients
- Agriculture & Animal Nutrition
- Personal Care & Home Care
- Energy & Fuels
- Textiles
- Latin America Industrial Biomanufacturing Market Outlook, by Country, Value (US$ Billion), 2020–2033
- Brazil Industrial Biomanufacturing Market Outlook, by Product Type, 2020–2033
- Brazil Industrial Biomanufacturing Market Outlook, by Process Technology, 2020–2033
- Brazil Industrial Biomanufacturing Market Outlook, by Feedstock, 2020–2033
- Brazil Industrial Biomanufacturing Market Outlook, by End-Use Industry, 2020–2033
- Argentina Industrial Biomanufacturing Market Outlook, by Product Type, 2020–2033
- Argentina Industrial Biomanufacturing Market Outlook, by Process Technology, 2020–2033
- Argentina Industrial Biomanufacturing Market Outlook, by Feedstock, 2020–2033
- Argentina Industrial Biomanufacturing Market Outlook, by End-Use Industry, 2020–2033
- Colombia Industrial Biomanufacturing Market Outlook, by Product Type, 2020–2033
- Colombia Industrial Biomanufacturing Market Outlook, by Process Technology, 2020–2033
- Colombia Industrial Biomanufacturing Market Outlook, by Feedstock, 2020–2033
- Colombia Industrial Biomanufacturing Market Outlook, by End-Use Industry, 2020–2033
- Mexico Industrial Biomanufacturing Market Outlook, by Product Type, 2020–2033
- Mexico Industrial Biomanufacturing Market Outlook, by Process Technology, 2020–2033
- Mexico Industrial Biomanufacturing Market Outlook, by Feedstock, 2020–2033
- Mexico Industrial Biomanufacturing Market Outlook, by End-Use Industry, 2020–2033
- Latin America Industrial Biomanufacturing Market Outlook, by Product Type, Value (US$ Billion), 2020–2033
- Middle East & Africa Industrial Biomanufacturing Market Outlook, 2020–2033
- Middle East & Africa Industrial Biomanufacturing Market Outlook, by Product Type, Value (US$ Billion), 2020–2033
- Biobased Chemicals & Polymer Intermediates
- Industrial Enzymes
- Precision-Fermentation Proteins & Ingredients
- Biosurfactants
- Mycelium & Cell-Derived Materials
- Fermentation-Derived Biofuels
- Middle East & Africa Industrial Biomanufacturing Market Outlook, by Process Technology, Value (US$ Billion), 2020–2033
- Biomass Fermentation
- Precision Fermentation
- Enzymatic Biocatalysis
- Cell-Free Synthesis
- Middle East & Africa Industrial Biomanufacturing Market Outlook, by Feedstock, Value (US$ Billion), 2020–2033
- First-Generation Sugars
- Lignocellulosic & Agricultural Residues
- Waste Gases & C1 Feedstocks
- Glycerol & Lipid By-Products
- Middle East & Africa Industrial Biomanufacturing Market Outlook, by End-Use Industry, Value (US$ Billion), 2020–2033
- Chemicals & Materials
- Food & Beverage Ingredients
- Agriculture & Animal Nutrition
- Personal Care & Home Care
- Energy & Fuels
- Textiles
- Middle East & Africa Industrial Biomanufacturing Market Outlook, by Country, Value (US$ Billion), 2020–2033
- South Africa Industrial Biomanufacturing Market Outlook, by Product Type, 2020–2033
- South Africa Industrial Biomanufacturing Market Outlook, by Process Technology, 2020–2033
- South Africa Industrial Biomanufacturing Market Outlook, by Feedstock, 2020–2033
- South Africa Industrial Biomanufacturing Market Outlook, by End-Use Industry, 2020–2033
- Middle East & Africa Industrial Biomanufacturing Market Outlook, by Product Type, Value (US$ Billion), 2020–2033
- Competitive Landscape
- Market Concentration and Industry Leaders
- Competitive Differentiation
- Strategic Moves and Market Direction
- Recent Industry Developments
- Company Profiles
- Novonesis
- BASF SE
- DSM-Firmenich
- Cargill, Incorporated
- Ginkgo Bioworks Holdings, Inc.
- International Flavors & Fragrances Inc.
- Archer-Daniels-Midland Company
- Corbion N.V.
- Evonik Industries AG
- Kerry Group plc
- Lallemand Inc.
- LanzaTech Global, Inc.
- Appendix
- Research Methodology
- Report Assumptions
- Acronyms and Abbreviations
Product Type
- Biobased Chemicals & Polymer Intermediates
- Industrial Enzymes
- Precision-Fermentation Proteins & Ingredients
- Biosurfactants
- Mycelium & Cell-Derived Materials
- Fermentation-Derived Biofuels
Process Technology
- Biomass Fermentation
- Precision Fermentation
- Enzymatic Biocatalysis
- Cell-Free Synthesis
Feedstock
- First-Generation Sugars
- Lignocellulosic & Agricultural Residues
- Waste Gases & C1 Feedstocks
- Glycerol & Lipid By-Products
End-Use Industry
- Chemicals & Materials
- Food & Beverage Ingredients
- Agriculture & Animal Nutrition
- Personal Care & Home Care
- Energy & Fuels
- Textiles
Regions
- North America
- Europe
- Asia Pacific
- Latin America
- Middle East & Africa
Our Research Methodology
Considering the volatility of business today, traditional approaches to strategizing a game plan can be unfruitful if not detrimental. True ambiguity is no way to determine a forecast. A myriad of predetermined factors must be accounted for such as the degree of risk involved, the magnitude of circumstances, as well as conditions or consequences that are not known or unpredictable. To circumvent binary views that cast uncertainty, the application of market research intelligence to strategically posture, move, and enable actionable outcomes is necessary.
View Methodology
Quality Assured
Rigorous Validation Process

Confidentiality Assured
End-to-end Data Security

Custom Research Services
Tailored To Your Objectives
FAQs
The market is valued at US$ 52.0 billion in 2026, covering non-pharmaceutical fermentation products, industrial enzymes, biobased chemicals and related production services worldwide.
Revenue is projected to reach US$ 105.0 billion by 2033, growing at a 10.6% CAGR and adding an absolute dollar opportunity of US$ 53.0 billion.
Biobased Chemicals & Polymer Intermediates lead with 31% share in 2026, supported by established polymer and specialty chemical buyers and proven organic acid routes.
Asia Pacific grows fastest at a 13.4% CAGR to 2033, helped by low installed cost per litre, cheap sugar feedstock and expanding contract fermentation.
Concentration is medium, with enzymes held by a few large producers while biobased chemicals, biosurfactants and fermentation-derived ingredients stay fragmented across many suppliers.
Related Reports
Clinical Nutrition Market Size, Share, Insights, Competitive Landscape, and Forecast 2026 to 2033
The global clinical nutrition market is valued at US$35.90 billion in 2026, reaching US$51.50 billion by 2033, growing at a 5.29% CAGR
Fluoroquinolones Market Size, Share, Insights, Competitive Landscape, and Forecast 2026 to 2033
The global fluoroquinolones market is valued at US$9.4 billion in 2026, reaching US$10.6 billion by 2033, growing at a 1.73% CAGR
Fabry Disease Treatment Market Size, Share, Insights, Competitive Landscape, and Forecast 2026 to 2033
The global Fabry disease treatment market is valued at US$2.2 billion in 2026, reaching US$3.3 billion by 2033, growing at a 6.0% CAGR
gRNA Market Size, Share, Insights, Competitive Landscape, and Forecast 2026 to 2033
The global gRNA market is valued at US$0.40 billion in 2026, reaching US$0.90 billion by 2033, growing at a 12.3% CAGR
Pharmaceutical Glass Ampoules Market Size, Share, Insights, Competitive Landscape, and Forecast 2026 to 2033
The global pharmaceutical glass ampoules market is valued at US$1.4 billion in 2026, reaching US$1.9 billion by 2033, growing at a 4.5% CAGR
Mouth Ulcers Treatment Market Size, Share, Insights, Competitive Landscape, and Forecast 2026 to 2033
The global mouth ulcers treatment market is valued at US$1.2 billion in 2026, reaching US$1.7 billion by 2033, growing at a 5.1% CAGR