



Laser Technologies in Manufacturing Market
Laser Technologies in Manufacturing Market Size, Share, Insights, Competitive Landscape, and Forecast 2026 to 2033
Laser Technologies in Manufacturing Market Size, Share, Insights, Competitive Landscape, and Forecast 2026 to 2033
How Fast Will Industrial Laser Manufacturing Systems Grow by 2033?
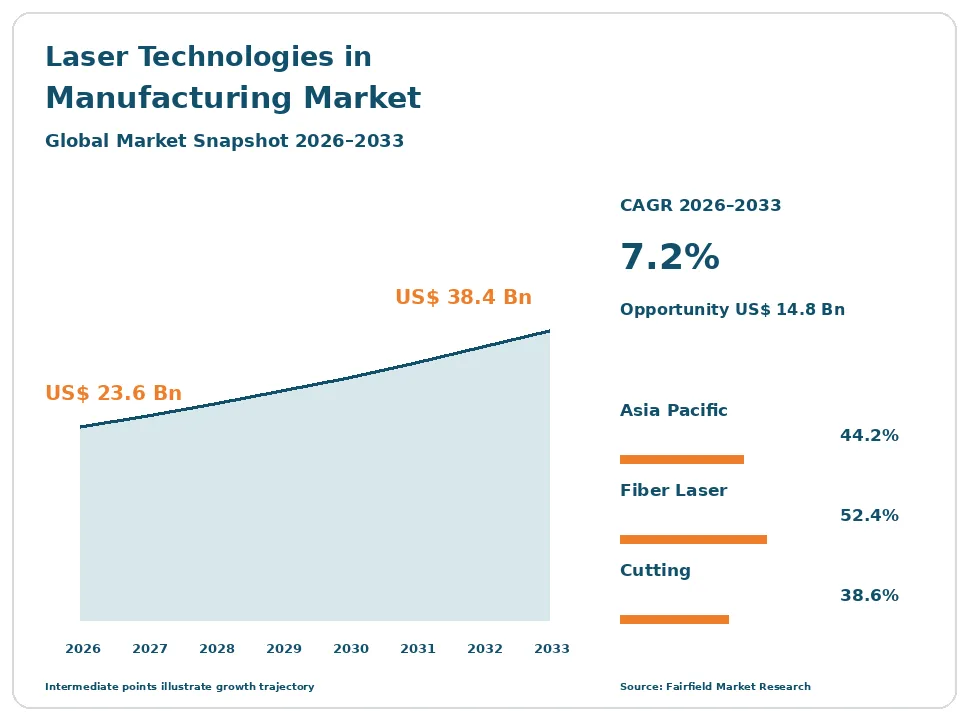
The global Laser Technologies in Manufacturing market size is expected to be valued at US$ 23.6 billion in 2026 and projected to reach US$ 38.4 billion by 2033, growing at a CAGR of 7.2% between 2026 and 2033. These values count complete laser processing systems and their integration, not bare sources.
The market expanded at a 6.1% CAGR between 2020 and 2025. Growth came from fabricators replacing plasma and punching equipment with multi-kilowatt fiber cutters. Three forces carry the forecast. Source prices fell sharply, putting high-power cutting within reach of small job shops. Battery cell and module assembly created a large new welding workload that resistance methods cannot serve well. Marking, cleaning and micromachining kept widening into new substrates. The direction is clear: unit volumes rise faster than revenue, because the price per watt keeps falling while the value migrates toward automation, process software and service.
Key Report Takeaways
- By Source Type: Fiber Laser held 52.4% share in 2026, while Ultrashort Pulse Laser sources are projected to expand at an 11.2% CAGR through 2033, driven by cold-ablation work on display glass, medical polymers and thin films.
- By Process: Cutting held 38.6% share in 2026, while Welding and Brazing is projected to grow at a 9.4% CAGR through 2033, as battery pack assembly demands thousands of low-heat joints per unit.
- By End-use Industry: General Metal Fabrication and Job Shops held 27.3% share in 2026, while Battery Manufacturing is projected to rise at a 12.1% CAGR through 2033, following new cell and module plant commissioning.
- By Power Output: 1 kW to 6 kW systems held 41.5% share in 2026, while the Above 6 kW class is projected to advance at a 9.1% CAGR through 2033, because thick-section cutting now runs economically at higher power.
- By Geography: Asia Pacific held 44.2% share in 2026, while Latin America is projected to record an 8.7% CAGR through 2033, supported by automotive and appliance fabrication investment in Mexico and Brazil.
Global Laser Technologies in Manufacturing Market Trends and Insights
Drivers Impact Analysis
| Driver | Impact on CAGR Forecast | Geographic Relevance | Impact Timeline |
| Collapse in high-power fiber laser source prices | High | Global, led by Asia Pacific | Short term (≤2 years) |
| Laser welding of battery cells, modules and electronics | High | Asia Pacific, Europe, North America | Medium term (2–4 years) |
Two forces account for most of the forecast growth in industrial laser processing.
Falling Fiber Laser Source Prices Move Value Into Machines, Software and Service
The price of a high-power fiber laser source has fallen far enough to change who buys laser equipment. Machines that once suited only tier-one suppliers now sit in small job shops, which has widened the installed base and lifted unit volumes across metal fabrication. The commercial consequence is a shift in where margin sits. A source and a cutting head are close to commodities, so the money has moved to the system builder’s productivity, the motion platform, the nesting and process software, automation such as tower storage, and the service contract.
Scale economics and new entrants, principally in China, drove the decline. Pump diode yields improved, output per module rose, and capacity additions outpaced demand. Source makers have seen margins compress as a result, and several now sell subsystems and complete machines to recover value further down the chain.
Battery and Electronics Assembly Creates Genuinely New Laser Welding Volume
Battery manufacturing has added a workload that did not exist at scale a decade ago and that laser processing suits better than any alternative. A single pack needs thousands of tab, busbar and can-seal joints, each fast, repeatable and made with little heat input into cells that degrade when heated. Resistance welding struggles with dissimilar copper and aluminium stacks and with the cycle times cell lines require. That requirement converts directly into installed laser welding capacity.
Electronics assembly reinforces the same demand. Sensor housings, connectors and hermetic packages need narrow, clean seams on thin sections. Beam shaping, green and blue wavelengths for copper, and closed-loop depth monitoring have made the process controllable enough for production sign-off, and weld quality levels defined in ISO 13919 give buyers a common acceptance language.
Restraints Impact Analysis
| Restraint | Impact on CAGR Forecast | Geographic Relevance | Impact Timeline |
| Capital cycles and a fast existing installed base | Medium | North America, Europe | Short term (≤2 years) |
| Shortage of laser programming and process engineering skills | Medium | Global | Long term (≥4 years) |
Two conditions restrain the pace of system replacement and new installation.
Capital Cycles and a Fast Installed Base Delay Laser Cutter Replacement
Fabrication equipment is bought against order books, not against technology cycles. A job shop commits to a cutting cell when backlog and financing cost justify it, so laser system demand tracks industrial capital spending closely and falls quickly when interest rates rise or automotive and construction orders soften. The effect is visible in order intake swings far larger than the underlying growth rate.
The second part of the problem is the quality of what is already installed. A six-kilowatt fiber cutter bought five years ago still runs close to the speed of a new one on thin sheet, because cutting speed on thin material is now limited by motion and gas dynamics rather than by available power. When the incremental gain from replacement shrinks, the payback calculation stretches, and buyers defer. Shops often add automation to existing machines instead of replacing them.
Programming and Process Engineering Skills Shortages Constrain Laser Capacity Use
The binding constraint in many plants is people rather than machines. Installed laser systems frequently run below their rated capability because too few staff can program complex nests, set welding parameters for new joint geometries, or diagnose process faults. Utilisation losses of this kind delay repeat orders, since a shop that cannot load its first machine will not buy a second.
The cause is structural. Laser processing sits between optics, metallurgy and controls, and few training routes cover all three. Experienced process engineers are retiring faster than apprenticeship and technical college programmes replace them. Vendors have responded with parameter libraries, guided setup and remote process support, and beam characterisation practice defined in ISO 11146 and ISO 11554 helps standardise how a source is specified and verified, but transferring judgement about real parts remains slow.
Market Opportunities
Ultrashort Pulse Lasers Open Glass, Display and Medical Micromachining Revenue
Picosecond and femtosecond sources open an application pool that thermal processes cannot reach. Cold ablation removes material with minimal heat-affected zone, which allows cutting of chemically strengthened display glass, drilling of fine vias, texturing of implant surfaces and structuring of polymer medical devices. These are high-value, low-volume-per-part applications where the customer pays for precision rather than throughput, so system prices and margins sit well above commodity cutting.
Precision component makers, display and semiconductor packaging suppliers and medical device manufacturers create the demand. Capture depends on application know-how more than on hardware, since the recipe for each substrate is the hard part. Rising average pulse power has lifted throughput enough to make production economics work, and micromachining lines increasingly ship as turnkey cells with vision alignment, which suits integrators with strong process laboratories.
Laser Cleaning, Additive Manufacturing and Service Build Recurring Revenue Pools
Three adjacent pools extend the addressable market beyond machine sales. Laser cleaning replaces abrasive blasting and chemical stripping for weld preparation, mould maintenance and corrosion removal, with no consumable media and no effluent to treat. Metal additive manufacturing, covered by the ISO/ASTM 52900 terminology framework, adds powder bed fusion and directed energy deposition platforms into aerospace and medical supply chains. Service, spare optics, consumables and software subscriptions turn an installed base into annuity revenue.
System builders and their channel partners are positioned to capture these pools. Maintenance, repair and overhaul operations and foundries drive cleaning demand, while aerospace and orthopaedic manufacturers drive additive adoption. Fleet monitoring software, remote diagnostics and process data packages are becoming paid products, which gives vendors revenue that does not swing with the capital cycle.
Segment Analysis
By Source Type: Fiber Sources Lead While Ultrashort Pulse Lasers Scale Fastest
Fiber Laser sources accounted for 52.4% of the market in 2026, holding the lead because wall-plug efficiency, beam quality and fibre delivery suit sheet metal cutting and remote welding better than any alternative, and because falling prices removed the cost objection. CO2 Laser platforms retain non-metal cutting work, while Solid-State and Disk Laser and Diode and Direct Diode Laser sources serve deep-penetration welding, cladding and heat treatment.
Ultrashort Pulse Laser sources are growing fastest at an 11.2% CAGR to 2033, as picosecond and femtosecond platforms move from laboratories into display, semiconductor packaging and medical device production. Excimer Laser systems remain tied to annealing and lithography-adjacent steps. For suppliers, the implication is clear: commodity source volume funds scale, while short-pulse platforms carry the margin.
By Process: Cutting Holds the Largest Share as Welding and Brazing Accelerates
Cutting represented 38.6% of process revenue in 2026, reflecting the sheer number of flat-sheet machines installed across job shops and the fact that cutting was the first process to reach cost parity with mechanical methods. Marking and Engraving follows, supported by traceability rules that require permanent part identification, with Drilling, Surface Treatment and Annealing and Semiconductor Processing filling specialised roles.
Welding and Brazing is the fastest-growing process at a 9.4% CAGR, pulled by battery pack assembly, e-motor hairpin joining and body-in-white work. Additive Manufacturing and Micromachining and Structuring grow from smaller bases. The business implication is that process mix is shifting from material removal toward joining, which favours suppliers with beam shaping, seam tracking and weld monitoring capability rather than raw cutting speed.
By End-use Industry: Fabrication Shops Lead While Battery Plants Grow Quickest
General Metal Fabrication and Job Shops held 27.3% share in 2026, the largest single block because thousands of independent shops each buy one or two machines and replace them on a rolling basis. Automotive and Transport follows, with Electronics and Semiconductors, Aerospace, Medical Devices and Consumer Goods accounting for the balance of installed capacity.
Battery Manufacturing is expanding fastest at a 12.1% CAGR, because every new cell and module plant specifies laser welding, cleaning and marking lines from the outset rather than retrofitting them. Aerospace demand is governed by qualification frameworks, which slows adoption but locks in suppliers once approved. The mix shift means vendors increasingly sell into project-based plant programmes rather than one machine at a time.
By Power Output: Mid-Range Systems Dominate While High-Power Units Gain Share
The 1 kW to 6 kW class accounted for 41.5% of the market in 2026. This band covers the bulk of general sheet metal work, where it delivers the best balance of cutting speed, assist gas consumption and machine cost, making it the default specification for a first laser purchase. The Below 1 kW class serves marking, micromachining and fine welding.
Systems rated Above 6 kW are growing fastest at a 9.1% CAGR, as plate fabricators, shipyards and structural steel processors move thick-section work from plasma and oxyfuel onto laser platforms. Falling cost per watt made the step economic. The effect on suppliers is a widening product ladder, with higher-power machines carrying more automation content and higher service revenue per installation.
Geography Analysis
North America Anchors Laser Demand in Aerospace, Medical and Heavy Fabrication
North America accounted for 23.6% of the market in 2026 and is projected to grow at a 6.3% CAGR to 2033. The United States supplies most of the regional demand, with Canada and Mexico adding fabrication and automotive volume. Aerospace and medical device manufacturing give the region an unusually high share of qualified, high-value processes, where drilling, micromachining and additive platforms are specified against documented material and process approvals.
Operation is governed by the ANSI Z136 series for safe use of lasers alongside federal performance requirements for laser products, which shapes guarding and interlock design on every installed system. Reshoring programmes and semiconductor plant construction have added new welding, marking and cleaning capacity. The main constraint is skilled labour, which pushes buyers toward automated loading and guided process setup.
Europe Sustains Premium System Building and Automotive Welding Demand
Europe held 22.4% share in 2026 and is forecast to expand at a 5.6% CAGR, the slowest of the five regions. Germany, Italy, Switzerland, France and Turkey form the core, with Germany and Italy also home to much of the world’s premium machine-tool building capability. Regional demand concentrates in automotive body and e-motor production, machinery manufacturing and precision engineering.
Compliance is a defining feature. Machines must meet IEC 60825 classification, ISO 11553 safety requirements for laser processing machines, and machinery and electromagnetic compatibility rules before sale. Energy costs and soft automotive output have slowed replacement spending. The clearest regional opportunity sits in battery and e-mobility lines, and in retrofitting automation onto a large base of serviceable machines rather than replacing them outright.
Which Region Is Leading the Laser Technologies in Manufacturing Market?
Asia Pacific leads the market with 44.2% share in 2026 and is projected to grow at a 7.9% CAGR through 2033. China accounts for most of that total, supported by Japan, South Korea, Taiwan and India. The region combines the largest sheet metal fabrication base, the densest electronics assembly cluster and the bulk of global battery cell capacity, which together consume cutting, marking and welding systems in volume.
Domestic source and system manufacturing is the structural advantage. Chinese producers scaled fiber laser output and pushed prices down, which expanded the local installed base faster than anywhere else and created an export position in mid-range machines. Japan and South Korea contribute precision and semiconductor-adjacent processing. The region’s weakness is intense price competition, which has compressed margins for builders selling standard cutting platforms.
Which Region Is Growing Fastest in the Laser Technologies in Manufacturing Market?
Latin America is growing fastest at an 8.7% CAGR through 2033, from 5.2% share in 2026. Mexico drives the expansion as automotive, appliance and electronics suppliers add fabrication capacity to serve nearshoring programmes, with Brazil contributing agricultural equipment, structural steel and general job-shop demand, and Argentina and Colombia adding smaller volumes.
Growth starts from a small base, so percentage gains overstate absolute revenue. Barriers are real: import duties and currency movement raise landed machine cost, financing for small fabricators is expensive, and local service networks for optics and spare parts remain thin. Buyers respond by favouring suppliers with regional stock and training. The opportunity lies in first-time laser purchases replacing plasma and mechanical cutting in medium-sized shops.
Middle East & Africa Builds Laser Capacity Around Industrial Diversification
Middle East & Africa held 4.6% share in 2026 and is projected to advance at an 8.0% CAGR. Saudi Arabia, the United Arab Emirates, Egypt, Turkey’s neighbouring trade corridors and South Africa provide most of the activity. Diversification programmes in the Gulf states fund new fabrication, pipe processing and defence-related manufacturing plants, which specify laser cutting and welding from the start.
Oil and gas services remain the steadiest buyer, using cutting and cladding for pipe and valve work. Barriers include limited process engineering depth, dependence on imported machines and uneven power quality in some markets. Export control treatment of high-power and ultrashort pulse sources under dual-use lists also affects which systems may be supplied. Training partnerships and local service hubs are the practical route to growth.
Competitive Landscape
The market is moderately concentrated at the source level and fragmented at the system level. A small group of source makers supplies a large share of high-power fiber output, while several hundred machine builders assemble cutting, welding and marking systems around purchased or in-house sources. That split explains most competitive behaviour. Source suppliers have integrated forward into subsystems and complete machines to recover margin lost to price erosion, and machine builders have integrated backward into optics and beam delivery to protect differentiation.
Competition now turns on productivity per installed machine rather than on laser power. Buyers compare nesting efficiency, automation integration, uptime, service response and total cost per metre or per joint. Software has become a decisive factor, covering offline programming, process monitoring, fleet analytics and parameter libraries that shorten setup for new parts. Compliance capability is also a competitive asset, since machines must satisfy laser classification, machinery safety and electromagnetic compatibility requirements in each market. Chinese system builders have taken meaningful share in mid-range cutting by combining low source cost with improving build quality, and they have shifted price expectations in every region they enter.
Strategic activity has concentrated on building application depth and recurring revenue. Vendors are adding process laboratories, expanding service and spare-parts networks, and bundling training with equipment sales. Several have widened their automation portfolios to sell cells rather than standalone machines, and others have narrowed toward defensible niches such as ultrashort pulse micromachining, additive platforms or semiconductor processing.
The prevailing strategic direction is away from selling watts and toward selling verified process outcomes. Suppliers are investing in beam shaping, closed-loop monitoring, qualification support and digital services, while treating standard cutting hardware as a volume business that funds the rest.
Laser Technologies in Manufacturing Industry Leaders
- TRUMPF SE + Co. KG
- Coherent Corp.
- IPG Photonics Corporation
- Han’s Laser Technology Industry Group Co., Ltd.
- Amada Co., Ltd.
Recent Industry Developments
- May 2014: The International Electrotechnical Commission published the third edition of IEC 60825-1, the laser product safety classification standard – it remains the reference that determines how industrial laser systems are classed, guarded and labelled for sale worldwide.
- 2015: ISO 11553 safety requirements for laser processing machines were consolidated into their current structure – gave machine builders a single, auditable basis for enclosure, interlock and access design on production systems.
- 2021: ISO and ASTM International issued the revised ISO/ASTM 52900 additive manufacturing terminology standard – established the shared vocabulary that powder bed fusion and directed energy deposition qualification programmes now depend on.
- 2022: The American National Standards Institute Z136.1 safe use of lasers standard was revised – updated control measures and hazard evaluation practice for every United States facility operating industrial laser equipment.
- 2023: The European Union adopted its new Machinery Regulation, replacing the earlier Machinery Directive and applying from January 2027 – adds digital documentation and cybersecurity duties for laser processing machinery placed on the European market.
Companies Covered in the Report
- TRUMPF SE + Co. KG
- Coherent Corp.
- IPG Photonics Corporation
- Han’s Laser Technology Industry Group Co., Ltd.
- Amada Co., Ltd.
- Bystronic AG
- Jenoptik AG
- nLIGHT, Inc.
- MKS Instruments, Inc.
- Lumentum Holdings Inc.
- Mitsubishi Electric Corporation
- Wuhan Raycus Fiber Laser Technologies Co., Ltd.
- Maxphotonics Co., Ltd.
- LPKF Laser & Electronics SE
- Prima Industrie S.p.A.
Laser Technologies in Manufacturing Market Report Scope
This study covers industrial laser sources, complete processing systems and the integration around them used in production. Reported values count complete systems and integration, not sources alone, since the two differ by a large multiple. Laboratory, medical treatment, defence weapon and telecommunications lasers are excluded. The base year is 2025, the forecast period runs from 2026 to 2033, and all values are stated in US$ Billion.
Source Type
- Fiber Laser
- CO2 Laser
- Solid-State and Disk Laser
- Diode and Direct Diode Laser
- Excimer Laser
- Ultrashort Pulse Laser
Process
- Cutting
- Welding and Brazing
- Marking and Engraving
- Drilling
- Additive Manufacturing
- Surface Treatment
- Micromachining and Structuring
- Annealing and Semiconductor Processing
End-use Industry
- Automotive and Transport
- General Metal Fabrication and Job Shops
- Electronics and Semiconductors
- Medical Devices
- Aerospace
- Battery Manufacturing
- Consumer Goods
Power Output
- Below 1 kW
- 1 kW to 6 kW
- Above 6 kW
Regions
- North America
- Europe
- Asia Pacific
- Latin America
- Middle East & Africa
Key Questions Answered in the Report
How big is the laser technologies in manufacturing market in 2026?
The market is valued at US$ 23.6 billion in 2026, covering complete industrial laser processing systems and the integration supplied with them.
What is the forecast size and growth rate to 2033?
The market is projected to reach US$ 38.4 billion by 2033, growing at a 7.2% CAGR and adding US$ 14.8 billion in absolute opportunity.
Which laser source type holds the largest share?
Fiber Laser sources lead with 52.4% share in 2026, supported by high efficiency, fibre beam delivery and sharply reduced prices per watt.
Which process and end-use segments are growing fastest?
Welding and Brazing grows fastest among processes at 9.4%, while Battery Manufacturing leads end uses at a 12.1% CAGR through 2033.
Which region leads and how concentrated is the market?
Asia Pacific leads with 44.2% share in 2026, and concentration is medium, with concentrated source supply and a fragmented system-building base.
1. Executive Summary
1.1. Global Laser Technologies in Manufacturing Market Snapshot
1.2. Future Projections, 2026-2033
1.3. Key Market Trends
1.4. Regional Snapshot
2. Market Overview
2.1. Market Definition and Report Scope
2.2. Historical Market Trends, 2020-2025
2.3. Market Dynamics
2.3.1. Drivers Impact Analysis
2.3.1.1. Falling Fiber Laser Source Prices Move Value Into Machines, Software and Service
2.3.1.2. Battery and Electronics Assembly Creates Genuinely New Laser Welding Volume
2.3.2. Restraints Impact Analysis
2.3.2.1. Capital Cycles and a Fast Installed Base Delay Laser Cutter Replacement
2.3.2.2. Programming and Process Engineering Skills Shortages Constrain Laser Capacity Use
2.3.3. Market Opportunities
2.3.3.1. Ultrashort Pulse Lasers Open Glass, Display and Medical Micromachining Revenue
2.3.3.2. Laser Cleaning, Additive Manufacturing and Service Build Recurring Revenue Pools
3. Global Laser Technologies in Manufacturing Market Outlook, 2020-2033
3.1. Global Laser Technologies in Manufacturing Market Outlook, by Source Type, Value (US$ Billion), 2020-2033
3.1.1. Fiber Laser
3.1.2. CO2 Laser
3.1.3. Solid-State and Disk Laser
3.1.4. Diode and Direct Diode Laser
3.1.5. Excimer Laser
3.1.6. Ultrashort Pulse Laser
3.2. Global Laser Technologies in Manufacturing Market Outlook, by Process, Value (US$ Billion), 2020-2033
3.2.1. Cutting
3.2.2. Welding and Brazing
3.2.3. Marking and Engraving
3.2.4. Drilling
3.2.5. Additive Manufacturing
3.2.6. Surface Treatment
3.2.7. Micromachining and Structuring
3.2.8. Annealing and Semiconductor Processing
3.3. Global Laser Technologies in Manufacturing Market Outlook, by End-use Industry, Value (US$ Billion), 2020-2033
3.3.1. Automotive and Transport
3.3.2. General Metal Fabrication and Job Shops
3.3.3. Electronics and Semiconductors
3.3.4. Medical Devices
3.3.5. Aerospace
3.3.6. Battery Manufacturing
3.3.7. Consumer Goods
3.4. Global Laser Technologies in Manufacturing Market Outlook, by Power Output, Value (US$ Billion), 2020-2033
3.4.1. Below 1 kW
3.4.2. 1 kW to 6 kW
3.4.3. Above 6 kW
3.5. Global Laser Technologies in Manufacturing Market Outlook, by Region, Value (US$ Billion), 2020-2033
3.5.1. North America
3.5.2. Europe
3.5.3. Asia Pacific
3.5.4. Latin America
3.5.5. Middle East & Africa
4. North America Laser Technologies in Manufacturing Market Outlook, 2020-2033
4.1. North America Laser Technologies in Manufacturing Market Outlook, by Source Type, Value (US$ Billion), 2020-2033
4.1.1. Fiber Laser
4.1.2. CO2 Laser
4.1.3. Solid-State and Disk Laser
4.1.4. Diode and Direct Diode Laser
4.1.5. Excimer Laser
4.1.6. Ultrashort Pulse Laser
4.2. North America Laser Technologies in Manufacturing Market Outlook, by Process, Value (US$ Billion), 2020-2033
4.2.1. Cutting
4.2.2. Welding and Brazing
4.2.3. Marking and Engraving
4.2.4. Drilling
4.2.5. Additive Manufacturing
4.2.6. Surface Treatment
4.2.7. Micromachining and Structuring
4.2.8. Annealing and Semiconductor Processing
4.3. North America Laser Technologies in Manufacturing Market Outlook, by End-use Industry, Value (US$ Billion), 2020-2033
4.3.1. Automotive and Transport
4.3.2. General Metal Fabrication and Job Shops
4.3.3. Electronics and Semiconductors
4.3.4. Medical Devices
4.3.5. Aerospace
4.3.6. Battery Manufacturing
4.3.7. Consumer Goods
4.4. North America Laser Technologies in Manufacturing Market Outlook, by Power Output, Value (US$ Billion), 2020-2033
4.4.1. Below 1 kW
4.4.2. 1 kW to 6 kW
4.4.3. Above 6 kW
4.5. North America Laser Technologies in Manufacturing Market Outlook, by Country, Value (US$ Billion), 2020-2033
4.5.1. United States Laser Technologies in Manufacturing Market Outlook, by Source Type, 2020-2033
4.5.2. United States Laser Technologies in Manufacturing Market Outlook, by Process, 2020-2033
4.5.3. United States Laser Technologies in Manufacturing Market Outlook, by End-use Industry, 2020-2033
4.5.4. United States Laser Technologies in Manufacturing Market Outlook, by Power Output, 2020-2033
4.5.5. Canada Laser Technologies in Manufacturing Market Outlook, by Source Type, 2020-2033
4.5.6. Canada Laser Technologies in Manufacturing Market Outlook, by Process, 2020-2033
4.5.7. Canada Laser Technologies in Manufacturing Market Outlook, by End-use Industry, 2020-2033
4.5.8. Canada Laser Technologies in Manufacturing Market Outlook, by Power Output, 2020-2033
4.5.9. Mexico Laser Technologies in Manufacturing Market Outlook, by Source Type, 2020-2033
4.5.10. Mexico Laser Technologies in Manufacturing Market Outlook, by Process, 2020-2033
4.5.11. Mexico Laser Technologies in Manufacturing Market Outlook, by End-use Industry, 2020-2033
4.5.12. Mexico Laser Technologies in Manufacturing Market Outlook, by Power Output, 2020-2033
5. Europe Laser Technologies in Manufacturing Market Outlook, 2020-2033
5.1. Europe Laser Technologies in Manufacturing Market Outlook, by Source Type, Value (US$ Billion), 2020-2033
5.1.1. Fiber Laser
5.1.2. CO2 Laser
5.1.3. Solid-State and Disk Laser
5.1.4. Diode and Direct Diode Laser
5.1.5. Excimer Laser
5.1.6. Ultrashort Pulse Laser
5.2. Europe Laser Technologies in Manufacturing Market Outlook, by Process, Value (US$ Billion), 2020-2033
5.2.1. Cutting
5.2.2. Welding and Brazing
5.2.3. Marking and Engraving
5.2.4. Drilling
5.2.5. Additive Manufacturing
5.2.6. Surface Treatment
5.2.7. Micromachining and Structuring
5.2.8. Annealing and Semiconductor Processing
5.3. Europe Laser Technologies in Manufacturing Market Outlook, by End-use Industry, Value (US$ Billion), 2020-2033
5.3.1. Automotive and Transport
5.3.2. General Metal Fabrication and Job Shops
5.3.3. Electronics and Semiconductors
5.3.4. Medical Devices
5.3.5. Aerospace
5.3.6. Battery Manufacturing
5.3.7. Consumer Goods
5.4. Europe Laser Technologies in Manufacturing Market Outlook, by Power Output, Value (US$ Billion), 2020-2033
5.4.1. Below 1 kW
5.4.2. 1 kW to 6 kW
5.4.3. Above 6 kW
5.5. Europe Laser Technologies in Manufacturing Market Outlook, by Country, Value (US$ Billion), 2020-2033
5.5.1. Germany Laser Technologies in Manufacturing Market Outlook, by Source Type, 2020-2033
5.5.2. Germany Laser Technologies in Manufacturing Market Outlook, by Process, 2020-2033
5.5.3. Germany Laser Technologies in Manufacturing Market Outlook, by End-use Industry, 2020-2033
5.5.4. Germany Laser Technologies in Manufacturing Market Outlook, by Power Output, 2020-2033
5.5.5. Italy Laser Technologies in Manufacturing Market Outlook, by Source Type, 2020-2033
5.5.6. Italy Laser Technologies in Manufacturing Market Outlook, by Process, 2020-2033
5.5.7. Italy Laser Technologies in Manufacturing Market Outlook, by End-use Industry, 2020-2033
5.5.8. Italy Laser Technologies in Manufacturing Market Outlook, by Power Output, 2020-2033
5.5.9. Switzerland Laser Technologies in Manufacturing Market Outlook, by Source Type, 2020-2033
5.5.10. Switzerland Laser Technologies in Manufacturing Market Outlook, by Process, 2020-2033
5.5.11. Switzerland Laser Technologies in Manufacturing Market Outlook, by End-use Industry, 2020-2033
5.5.12. Switzerland Laser Technologies in Manufacturing Market Outlook, by Power Output, 2020-2033
5.5.13. France Laser Technologies in Manufacturing Market Outlook, by Source Type, 2020-2033
5.5.14. France Laser Technologies in Manufacturing Market Outlook, by Process, 2020-2033
5.5.15. France Laser Technologies in Manufacturing Market Outlook, by End-use Industry, 2020-2033
5.5.16. France Laser Technologies in Manufacturing Market Outlook, by Power Output, 2020-2033
5.5.17. Turkey Laser Technologies in Manufacturing Market Outlook, by Source Type, 2020-2033
5.5.18. Turkey Laser Technologies in Manufacturing Market Outlook, by Process, 2020-2033
5.5.19. Turkey Laser Technologies in Manufacturing Market Outlook, by End-use Industry, 2020-2033
5.5.20. Turkey Laser Technologies in Manufacturing Market Outlook, by Power Output, 2020-2033
6. Asia Pacific Laser Technologies in Manufacturing Market Outlook, 2020-2033
6.1. Asia Pacific Laser Technologies in Manufacturing Market Outlook, by Source Type, Value (US$ Billion), 2020-2033
6.1.1. Fiber Laser
6.1.2. CO2 Laser
6.1.3. Solid-State and Disk Laser
6.1.4. Diode and Direct Diode Laser
6.1.5. Excimer Laser
6.1.6. Ultrashort Pulse Laser
6.2. Asia Pacific Laser Technologies in Manufacturing Market Outlook, by Process, Value (US$ Billion), 2020-2033
6.2.1. Cutting
6.2.2. Welding and Brazing
6.2.3. Marking and Engraving
6.2.4. Drilling
6.2.5. Additive Manufacturing
6.2.6. Surface Treatment
6.2.7. Micromachining and Structuring
6.2.8. Annealing and Semiconductor Processing
6.3. Asia Pacific Laser Technologies in Manufacturing Market Outlook, by End-use Industry, Value (US$ Billion), 2020-2033
6.3.1. Automotive and Transport
6.3.2. General Metal Fabrication and Job Shops
6.3.3. Electronics and Semiconductors
6.3.4. Medical Devices
6.3.5. Aerospace
6.3.6. Battery Manufacturing
6.3.7. Consumer Goods
6.4. Asia Pacific Laser Technologies in Manufacturing Market Outlook, by Power Output, Value (US$ Billion), 2020-2033
6.4.1. Below 1 kW
6.4.2. 1 kW to 6 kW
6.4.3. Above 6 kW
6.5. Asia Pacific Laser Technologies in Manufacturing Market Outlook, by Country, Value (US$ Billion), 2020-2033
6.5.1. China Laser Technologies in Manufacturing Market Outlook, by Source Type, 2020-2033
6.5.2. China Laser Technologies in Manufacturing Market Outlook, by Process, 2020-2033
6.5.3. China Laser Technologies in Manufacturing Market Outlook, by End-use Industry, 2020-2033
6.5.4. China Laser Technologies in Manufacturing Market Outlook, by Power Output, 2020-2033
6.5.5. Japan Laser Technologies in Manufacturing Market Outlook, by Source Type, 2020-2033
6.5.6. Japan Laser Technologies in Manufacturing Market Outlook, by Process, 2020-2033
6.5.7. Japan Laser Technologies in Manufacturing Market Outlook, by End-use Industry, 2020-2033
6.5.8. Japan Laser Technologies in Manufacturing Market Outlook, by Power Output, 2020-2033
6.5.9. South Korea Laser Technologies in Manufacturing Market Outlook, by Source Type, 2020-2033
6.5.10. South Korea Laser Technologies in Manufacturing Market Outlook, by Process, 2020-2033
6.5.11. South Korea Laser Technologies in Manufacturing Market Outlook, by End-use Industry, 2020-2033
6.5.12. South Korea Laser Technologies in Manufacturing Market Outlook, by Power Output, 2020-2033
6.5.13. Taiwan Laser Technologies in Manufacturing Market Outlook, by Source Type, 2020-2033
6.5.14. Taiwan Laser Technologies in Manufacturing Market Outlook, by Process, 2020-2033
6.5.15. Taiwan Laser Technologies in Manufacturing Market Outlook, by End-use Industry, 2020-2033
6.5.16. Taiwan Laser Technologies in Manufacturing Market Outlook, by Power Output, 2020-2033
6.5.17. India Laser Technologies in Manufacturing Market Outlook, by Source Type, 2020-2033
6.5.18. India Laser Technologies in Manufacturing Market Outlook, by Process, 2020-2033
6.5.19. India Laser Technologies in Manufacturing Market Outlook, by End-use Industry, 2020-2033
6.5.20. India Laser Technologies in Manufacturing Market Outlook, by Power Output, 2020-2033
7. Latin America Laser Technologies in Manufacturing Market Outlook, 2020-2033
7.1. Latin America Laser Technologies in Manufacturing Market Outlook, by Source Type, Value (US$ Billion), 2020-2033
7.1.1. Fiber Laser
7.1.2. CO2 Laser
7.1.3. Solid-State and Disk Laser
7.1.4. Diode and Direct Diode Laser
7.1.5. Excimer Laser
7.1.6. Ultrashort Pulse Laser
7.2. Latin America Laser Technologies in Manufacturing Market Outlook, by Process, Value (US$ Billion), 2020-2033
7.2.1. Cutting
7.2.2. Welding and Brazing
7.2.3. Marking and Engraving
7.2.4. Drilling
7.2.5. Additive Manufacturing
7.2.6. Surface Treatment
7.2.7. Micromachining and Structuring
7.2.8. Annealing and Semiconductor Processing
7.3. Latin America Laser Technologies in Manufacturing Market Outlook, by End-use Industry, Value (US$ Billion), 2020-2033
7.3.1. Automotive and Transport
7.3.2. General Metal Fabrication and Job Shops
7.3.3. Electronics and Semiconductors
7.3.4. Medical Devices
7.3.5. Aerospace
7.3.6. Battery Manufacturing
7.3.7. Consumer Goods
7.4. Latin America Laser Technologies in Manufacturing Market Outlook, by Power Output, Value (US$ Billion), 2020-2033
7.4.1. Below 1 kW
7.4.2. 1 kW to 6 kW
7.4.3. Above 6 kW
7.5. Latin America Laser Technologies in Manufacturing Market Outlook, by Country, Value (US$ Billion), 2020-2033
7.5.1. Mexico Laser Technologies in Manufacturing Market Outlook, by Source Type, 2020-2033
7.5.2. Mexico Laser Technologies in Manufacturing Market Outlook, by Process, 2020-2033
7.5.3. Mexico Laser Technologies in Manufacturing Market Outlook, by End-use Industry, 2020-2033
7.5.4. Mexico Laser Technologies in Manufacturing Market Outlook, by Power Output, 2020-2033
7.5.5. Brazil Laser Technologies in Manufacturing Market Outlook, by Source Type, 2020-2033
7.5.6. Brazil Laser Technologies in Manufacturing Market Outlook, by Process, 2020-2033
7.5.7. Brazil Laser Technologies in Manufacturing Market Outlook, by End-use Industry, 2020-2033
7.5.8. Brazil Laser Technologies in Manufacturing Market Outlook, by Power Output, 2020-2033
7.5.9. Argentina Laser Technologies in Manufacturing Market Outlook, by Source Type, 2020-2033
7.5.10. Argentina Laser Technologies in Manufacturing Market Outlook, by Process, 2020-2033
7.5.11. Argentina Laser Technologies in Manufacturing Market Outlook, by End-use Industry, 2020-2033
7.5.12. Argentina Laser Technologies in Manufacturing Market Outlook, by Power Output, 2020-2033
7.5.13. Colombia Laser Technologies in Manufacturing Market Outlook, by Source Type, 2020-2033
7.5.14. Colombia Laser Technologies in Manufacturing Market Outlook, by Process, 2020-2033
7.5.15. Colombia Laser Technologies in Manufacturing Market Outlook, by End-use Industry, 2020-2033
7.5.16. Colombia Laser Technologies in Manufacturing Market Outlook, by Power Output, 2020-2033
8. Middle East & Africa Laser Technologies in Manufacturing Market Outlook, 2020-2033
8.1. Middle East & Africa Laser Technologies in Manufacturing Market Outlook, by Source Type, Value (US$ Billion), 2020-2033
8.1.1. Fiber Laser
8.1.2. CO2 Laser
8.1.3. Solid-State and Disk Laser
8.1.4. Diode and Direct Diode Laser
8.1.5. Excimer Laser
8.1.6. Ultrashort Pulse Laser
8.2. Middle East & Africa Laser Technologies in Manufacturing Market Outlook, by Process, Value (US$ Billion), 2020-2033
8.2.1. Cutting
8.2.2. Welding and Brazing
8.2.3. Marking and Engraving
8.2.4. Drilling
8.2.5. Additive Manufacturing
8.2.6. Surface Treatment
8.2.7. Micromachining and Structuring
8.2.8. Annealing and Semiconductor Processing
8.3. Middle East & Africa Laser Technologies in Manufacturing Market Outlook, by End-use Industry, Value (US$ Billion), 2020-2033
8.3.1. Automotive and Transport
8.3.2. General Metal Fabrication and Job Shops
8.3.3. Electronics and Semiconductors
8.3.4. Medical Devices
8.3.5. Aerospace
8.3.6. Battery Manufacturing
8.3.7. Consumer Goods
8.4. Middle East & Africa Laser Technologies in Manufacturing Market Outlook, by Power Output, Value (US$ Billion), 2020-2033
8.4.1. Below 1 kW
8.4.2. 1 kW to 6 kW
8.4.3. Above 6 kW
8.5. Middle East & Africa Laser Technologies in Manufacturing Market Outlook, by Country, Value (US$ Billion), 2020-2033
8.5.1. Saudi Arabia Laser Technologies in Manufacturing Market Outlook, by Source Type, 2020-2033
8.5.2. Saudi Arabia Laser Technologies in Manufacturing Market Outlook, by Process, 2020-2033
8.5.3. Saudi Arabia Laser Technologies in Manufacturing Market Outlook, by End-use Industry, 2020-2033
8.5.4. Saudi Arabia Laser Technologies in Manufacturing Market Outlook, by Power Output, 2020-2033
8.5.5. United Arab Emirates Laser Technologies in Manufacturing Market Outlook, by Source Type, 2020-2033
8.5.6. United Arab Emirates Laser Technologies in Manufacturing Market Outlook, by Process, 2020-2033
8.5.7. United Arab Emirates Laser Technologies in Manufacturing Market Outlook, by End-use Industry, 2020-2033
8.5.8. United Arab Emirates Laser Technologies in Manufacturing Market Outlook, by Power Output, 2020-2033
8.5.9. Egypt Laser Technologies in Manufacturing Market Outlook, by Source Type, 2020-2033
8.5.10. Egypt Laser Technologies in Manufacturing Market Outlook, by Process, 2020-2033
8.5.11. Egypt Laser Technologies in Manufacturing Market Outlook, by End-use Industry, 2020-2033
8.5.12. Egypt Laser Technologies in Manufacturing Market Outlook, by Power Output, 2020-2033
8.5.13. South Africa Laser Technologies in Manufacturing Market Outlook, by Source Type, 2020-2033
8.5.14. South Africa Laser Technologies in Manufacturing Market Outlook, by Process, 2020-2033
8.5.15. South Africa Laser Technologies in Manufacturing Market Outlook, by End-use Industry, 2020-2033
8.5.16. South Africa Laser Technologies in Manufacturing Market Outlook, by Power Output, 2020-2033
9. Competitive Landscape
9.1. Market Concentration and Industry Leaders
9.2. Competitive Differentiation
9.3. Strategic Initiatives
9.4. Recent Industry Developments
9.5. Company Profiles
9.5.1. TRUMPF SE + Co. KG
9.5.2. Coherent Corp.
9.5.3. IPG Photonics Corporation
9.5.4. Han's Laser Technology Industry Group Co., Ltd.
9.5.5. Amada Co., Ltd.
9.5.6. Bystronic AG
9.5.7. Jenoptik AG
9.5.8. nLIGHT, Inc.
9.5.9. MKS Instruments, Inc.
9.5.10. Lumentum Holdings Inc.
9.5.11. Mitsubishi Electric Corporation
9.5.12. Wuhan Raycus Fiber Laser Technologies Co., Ltd.
9.5.13. Maxphotonics Co., Ltd.
9.5.14. LPKF Laser & Electronics SE
9.5.15. Prima Industrie S.p.A.
10. Appendix
10.1. Research Methodology
10.2. Report Assumptions
10.3. Acronyms and Abbreviations
| Source Type | Fiber Laser, CO2 Laser, Solid-State and Disk Laser, Diode and Direct Diode Laser, Excimer Laser, Ultrashort Pulse Laser |
| Process | Cutting, Welding and Brazing, Marking and Engraving, Drilling, Additive Manufacturing, Surface Treatment, Micromachining and Structuring, Annealing and Semiconductor Processing |
| End-use Industry | Automotive and Transport, General Metal Fabrication and Job Shops, Electronics and Semiconductors, Medical Devices, Aerospace, Battery Manufacturing, Consumer Goods |
| Power Output | Below 1 kW, 1 kW to 6 kW, Above 6 kW |
| Regions | North America, Europe, Asia Pacific, Latin America, Middle East & Africa |
Our Research Methodology
Considering the volatility of business today, traditional approaches to strategizing a game plan can be unfruitful if not detrimental. True ambiguity is no way to determine a forecast. A myriad of predetermined factors must be accounted for such as the degree of risk involved, the magnitude of circumstances, as well as conditions or consequences that are not known or unpredictable. To circumvent binary views that cast uncertainty, the application of market research intelligence to strategically posture, move, and enable actionable outcomes is necessary.
View Methodology
Quality Assured
Rigorous Validation Process

Confidentiality Assured
End-to-end Data Security

Custom Research Services
Tailored To Your Objectives
FAQs
The market is valued at US$ 23.6 billion in 2026, covering complete industrial laser processing systems and the integration supplied with them.
The market is projected to reach US$ 38.4 billion by 2033, growing at a 7.2% CAGR and adding US$ 14.8 billion in absolute opportunity.
Fiber Laser sources lead with 52.4% share in 2026, supported by high efficiency, fibre beam delivery and sharply reduced prices per watt.
Welding and Brazing grows fastest among processes at 9.4%, while Battery Manufacturing leads end uses at a 12.1% CAGR through 2033.
Asia Pacific leads with 44.2% share in 2026, and concentration is medium, with concentrated source supply and a fragmented system-building base.
Related Reports
High Torque Stepper Motor Market Size, Share, Insights, Competitive Landscape, and Forecast 2026 to 2033
Explore the high torque stepper motor market, projected to reach US$ 3.6 billion by 2033 at a 6.6% CAGR, with product and regional insights.
FBG Interrogator Market Size, Share, Insights, Competitive Landscape, and Forecast 2026 to 2033
Explore the FBG interrogator market, projected to reach US$ 316.7 million by 2033 at an 8.5% CAGR, with technology, application and regional insights.
Conveying Equipment Market Size, Share, Insights, Competitive Landscape, and Forecast 2026 to 2033
Explore the conveying equipment market, projected to reach US$ 56.9 billion by 2033 at a 4.5% CAGR, with equipment, services and regional insights.
Bakery Packaging Machine Market Size, Share, Insights, Competitive Landscape, and Forecast 2026 to 2033
Explore the bakery packaging machine market, projected to reach US$ 4.44 billion by 2033 at a 4.6% CAGR, with automation, machine and regional insights.
EPC Construction Market Size, Share, Insights, Competitive Landscape, and Forecast 2026 to 2033
EPC construction market to grow from US$ 331.5 billion in 2026 to US$ 424.6 billion by 2033 at a 3.6% CAGR. Explore services, contracts and regional trends.
Hydraulic Manifold Market Size, Share, Insights, Competitive Landscape, and Forecast 2026 to 2033
Hydraulic manifold market to grow from US$ 750.0 million in 2026 to US$ 947.8 million by 2033 at a 3.4% CAGR. Explore types, applications and regional trends.