



Low Rolling Resistance Tire Market
Low Rolling Resistance Tire Market Size, Share, Insights, Competitive Landscape, and Forecast 2026 to 2033
Low Rolling Resistance Tire Market Size and Trend Analysis
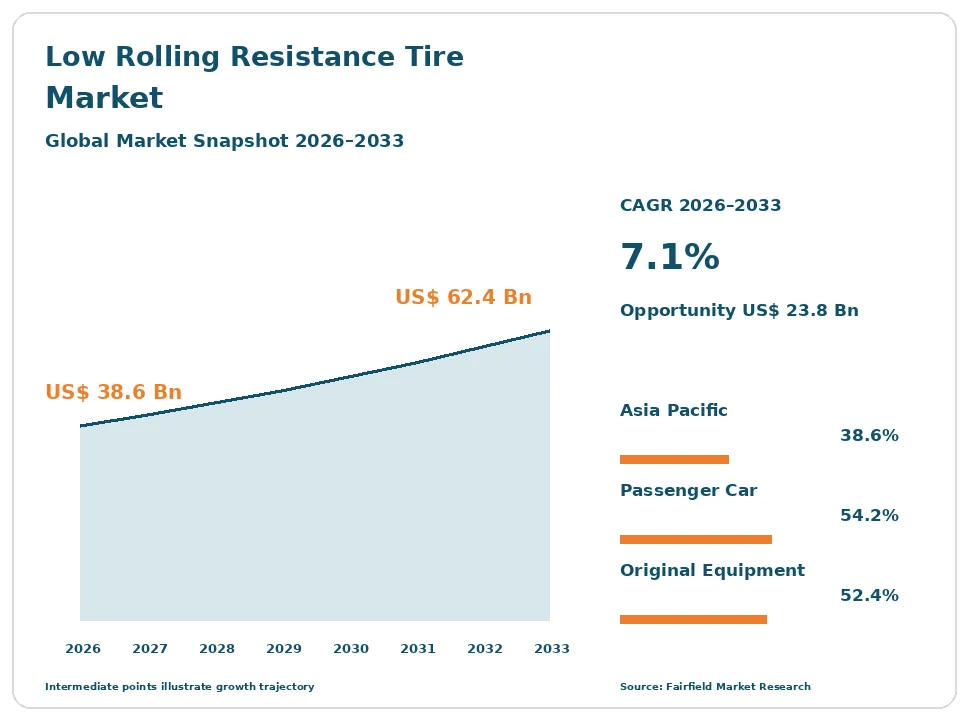
The global low rolling resistance tire market size is expected to be valued at US$ 38.6 billion in 2026 and projected to reach US$ 62.4 billion by 2033, growing at a CAGR of 7.1% between 2026 and 2033.
Between 2020 and 2025 the category grew at about 6.2% a year, faster than the tire market as a whole but constrained by a hard engineering limit. Rolling resistance, wet grip and tread wear pull against each other: a compound tuned to roll easily usually gives up wet braking distance or mileage, and the history of this product is the management of that triangle. Labelling schemes grade each attribute separately, letting a manufacturer sell a low rolling resistance grade openly rather than hide the trade-off behind a claim. Electric vehicles turn rolling resistance into a range specification that must be met at original equipment approval. Commercial fleets, measuring fuel cost per kilometre directly, buy the grade on arithmetic. Growth is specification-led rather than fashion-led.
Key Report Takeaways
- By Vehicle Type: Passenger car fitments held 54.2% share in 2026, while electric vehicle-specific fitments are projected to expand at a 12.4% CAGR through 2033, driven by higher load ratings and range targets written into original equipment specifications.
- By Sales Channel: Original equipment held 52.4% share in 2026, while the replacement channel is projected to grow at a 7.8% CAGR through 2033, driven by labelled tires reaching their first renewal and by faster wear on heavier vehicles.
- By Rolling Resistance Class: Class C held 38.5% share in 2026, while Class A is projected to advance at an 11.2% CAGR through 2033, driven by manufacturers chasing the top label grade to support fleet carbon reporting.
- By Technology: Silica-silane tread compounds held 46.8% share in 2026, while functionalised solution styrene-butadiene polymers are projected to expand at a 9.8% CAGR through 2033, driven by the need to cut hysteresis without losing wet grip.
- By Geography: Asia Pacific held 38.6% share in 2026, while Middle East & Africa is projected to post an 8.1% CAGR through 2033, driven by fuel-cost-sensitive commercial fleets and rising labelled tire availability.
Global Low Rolling Resistance Tire Market Trends and Insights
Drivers Impact Analysis
| Driver | Impact on CAGR Forecast | Geographic Relevance | Impact Timeline |
| Tire labelling schemes making rolling resistance a purchasable specification | High | Europe, Asia Pacific, North America | Medium term (2–4 years) |
| Electric vehicle mass, torque and range targets hardening original equipment specifications | High | Asia Pacific, Europe, North America | Long term (≥4 years) |
Two forces decide how much labelled low rolling resistance product the industry can sell through 2033.
Labelling Schemes Turn Rolling Resistance Into a Specification Buyers Can Actually Purchase
Labelling is what converted an engineering property into a product people can buy. Before grading existed, a manufacturer could claim low rolling resistance but a buyer could not verify it, so the attribute carried no reliable price. A graded scale changes that: the fuel efficiency class sits on the tire, on the shelf label and in a public database, and a fleet or retail buyer can compare two products on a common test.
The mechanism matters because the grades are reported separately. The EU tyre labelling regulation grades fuel efficiency, wet grip and external rolling noise individually, with a QR code linking to a product database, so a low rolling resistance claim cannot conceal a weak wet grip class. UNECE Regulation No. 117 sets the limit values and test methods behind those grades. Japan and China run comparable labelling programmes, spreading the same purchasing behaviour.
Electric Vehicle Mass, Torque and Range Targets Harden Rolling Resistance Specifications
Electric vehicles changed the tire specification sheet in three specific ways, and each one pushes original equipment toward low rolling resistance construction. A battery pack adds several hundred kilograms, so load ratings rise. Electric motors deliver peak torque instantly, which stresses the tread. Range is the headline number on which the vehicle is sold, so engineers fight for every percentage point, and rolling resistance is one of the few remaining levers after aerodynamics and mass.
The commercial consequence runs in two directions. Original equipment fitments are specified harder than on comparable combustion vehicles, and approval demands a rolling resistance coefficient target alongside the usual grip and noise requirements. At the same time, the heavier vehicle and instant torque wear those tires faster, so the same car returns to the replacement market sooner. Higher specification at fitment and shorter service life together raise value per vehicle.
Restraints Impact Analysis
| Restraint | Impact on CAGR Forecast | Geographic Relevance | Impact Timeline |
| Price premium and the difficulty of proving fuel or range savings to retail buyers | High | Global | Short term (≤2 years) |
| Tire abrasion, wear particle rules and chemistry under regulatory review | Medium | Europe, North America | Medium term (2–4 years) |
Two forces hold back conversion and now raise questions about the compound itself.
Price Premium and Unprovable Savings Slow Retail Uptake of Low Rolling Resistance Tires
The premium over an equivalent standard tire is the clearest brake on this category in the retail channel. A fleet can model fuel per hundred kilometres across a million kilometres and justify the difference. A private motorist replacing two tires cannot observe the saving at all, because fuel consumption varies more with driving style, load and weather than with the tire’s grade. The payback is real but invisible, so price usually wins at the counter.
The trade-off penalty compounds the problem. Buyers who know that a compound tuned for low hysteresis tends to concede wet braking distance or tread life treat the whole category with suspicion, and independent testing that shows shorter mileage reinforces that view. Fitters often recommend a mid-grade product as the safer sale. Where no national labelling scheme operates, the buyer has no graded evidence to overcome the doubt.
Tire Abrasion Rules and Compound Chemistry Reviews Create New Regulatory Exposure
Tire wear is now a live regulatory issue, and it lands awkwardly on this category. Abrasion generates particles that enter air, soil and water, and the variables that matter most are vehicle mass and compound formulation. Heavier electric vehicles and compounds optimised for low rolling resistance interact badly in this respect, because the formulation choices that reduce hysteresis can also reduce abrasion resistance. Stating that plainly is necessary: the trade-off is physical, not reputational.
Two regulatory threads are running. Euro 7 extends vehicle regulation to tire abrasion limits for the first time, with the measurement method being finalised through international working groups, which will force compound and construction changes once limits bind. Separately, 6PPD, an antiozonant used across the industry, and its transformation product are under review by California and Washington state authorities and by federal regulators. Both processes are under way rather than concluded.
Market Opportunities
Truck and Bus Fleet Fuel Economics Open a Measurable Low Rolling Resistance Revenue Pool
Commercial fleets are the one customer group that can prove the saving, which makes truck and bus the highest-quality revenue pool in this market. Fuel is the dominant operating cost for a long-haul operator, and rolling resistance accounts for a substantial share of the energy a loaded vehicle uses at motorway speed. Across a tractor and trailer running several axles, a one-grade improvement produces a number large enough to appear in an annual budget.
Capture favours suppliers who sell a programme rather than a tire. Fleets buy on cost per kilometre, so the offer combines graded casings, retreading to preserve the original casing’s efficiency, pressure monitoring and usage data. Logistics operators reporting transport emissions under customer contracts create additional pull, because a graded fitment supports the calculation. Suppliers with fleet telematics and retread networks hold the advantage here.
Label-Driven Replacement and EV-Specific Fitments Open a Premium Aftermarket Pool
The replacement channel is where the next pool of premium value sits, for a simple timing reason. Tires fitted to meet original equipment specifications eventually wear out, and the owner of an electric vehicle who replaces them with a cheaper unlabelled product loses measurable range. That gives the aftermarket a performance argument it never had with fuel economy, because the driver sees the consequence on the dashboard immediately rather than at the pump weeks later.
Tire retailers, online channels and vehicle manufacturer service networks create the demand, and they are already using fuel efficiency grades as a selling tool. EV-specific replacement lines with higher load indices, reinforced construction and noise-absorbing treatments command a clear premium. Suppliers with broad size coverage in the larger rim diameters common on electric vehicles, and with published grades across the range, are positioned to take this pool.
Segment Analysis
By Vehicle Type: Passenger Car Fitments Lead While EV-Specific Products Scale Fastest
Passenger car fitments led with 54.2% share in 2026, simply because the parc is largest and labelling schemes were written around this category first. Truck and bus followed at 22.6%, a disproportionately valuable share given unit volumes, because commercial casings are larger, costlier and bought on fuel economics. Light truck and light commercial vehicle fitments took 14.4%, a segment where payload and durability requirements have historically limited how far rolling resistance could be reduced.
Electric vehicle-specific fitments hold 8.8% share and grow fastest at a 12.4% CAGR through 2033. These are distinct products, not relabelled passenger tires: higher load indices for battery mass, reinforced shoulders for instant torque and foam liners for cabin noise. The business implication is that the fastest-growing fitment class requires its own moulds and sizes, which raises the entry cost for suppliers without scale.
By Sales Channel: Original Equipment Sets the Grade While Replacement Volume Catches Up
Original equipment accounted for 52.4% of category value in 2026, an unusual position for a tire segment, and it reflects how this product is specified. Vehicle manufacturers chase fleet carbon targets and range figures, so they write rolling resistance coefficients into tire approval alongside grip and noise. A fitment that misses the target is not approved, which guarantees low rolling resistance volume regardless of what consumers would choose unaided.
The replacement channel holds 47.6% and grows faster at a 7.8% CAGR through 2033. Two mechanisms drive the catch-up. Vehicles delivered with graded fitments reach their first renewal and owners increasingly replace like with like, and heavier electric vehicles consume tires faster than the cars they replaced. For suppliers this gradually rebalances the business toward the higher-margin channel, where brand and label grade are visible to the buyer.
By Rolling Resistance Class: Class C Carries the Volume as Class A Expands Quickest
Class C held 38.5% share in 2026, the practical centre of the market, because it delivers a measurable efficiency gain while keeping wet grip and mileage at levels that fitters are comfortable recommending. Class B followed at 31.2%, increasingly the default for new passenger car fitments in regulated markets. Class D and below retained 11.9%, concentrated in budget lines and in markets without a labelling requirement.
Class A holds 18.4% share and grows fastest at an 11.2% CAGR through 2033. Reaching the top grade demands the most advanced polymer and silica systems and usually a construction change, so it carries the largest premium. Demand comes from electric vehicle fitments and from fleets that report transport emissions. The implication is that grade distribution, not total tire volume, is where competitive position is now decided.
By Technology: Silica-Silane Treads Dominate While Functionalised Polymers Gain Ground
Silica-silane tread compounds represented 46.8% of the technology mix in 2026, the foundation of the whole category. Replacing carbon black with precipitated silica coupled by a silane agent breaks the old link between low hysteresis and poor wet grip, which is precisely why this chemistry mattered: it moved two corners of the triangle at once instead of trading one for another. Lightweight construction with reduced-mass bead and belt packages accounted for 19.6%, and sealant, foam and other integrated systems took 9.3%.
Functionalised solution styrene-butadiene polymers hold 24.3% share and grow fastest at a 9.8% CAGR through 2033. End-group functionalisation anchors the polymer chain to the silica surface, cutting energy loss further without sacrificing grip or wear. For manufacturers this deepens dependence on a small group of specialty polymer suppliers.
Geography Analysis
North America Converts Fleet Fuel Economics Into Graded Tire Demand
North America held 22.0% share in 2026 and grows at 6.8% a year to 2033. The United States accounts for most demand, with Canada and Mexico adding assembly and replacement volume. Adoption here has been led by commercial fleets rather than by regulation, because long-haul trucking operates on thin margins where fuel is the largest controllable cost and operators already measure consumption per vehicle.
Consumer-facing policy remains less developed than elsewhere. The US Department of Transportation and the National Highway Traffic Safety Administration have worked on tire fuel efficiency consumer information rulemaking without producing a mandatory retail grading scheme comparable to those operating abroad, so retail buyers rely on manufacturer claims. The barrier is therefore informational rather than technical. The opportunity lies in electric vehicle fitments and in fleet programmes that bundle graded casings with retreading and pressure monitoring.
Europe Built the Grading System That Defines the Product Category
Europe accounted for 27.4% of demand in 2026 and grows at 6.4% through 2033. Germany, France, Italy, Spain and Poland carry most volume, supported by vehicle manufacturers that specify rolling resistance tightly to meet fleet carbon targets. The region matters out of proportion to its size because its grading rules effectively define what a low rolling resistance product is, and manufacturers design to that scale for export markets too.
Three instruments operate together. The tyre labelling regulation grades fuel efficiency, wet grip and noise with a QR code and database entry, UNECE Regulation No. 117 sets limit values, and the General Safety Regulation adds tire pressure monitoring and related vehicle requirements. Euro 7 will extend regulation to abrasion. The barrier is a mature vehicle parc with slow replacement. The opportunity is premium graded product sold on documented compliance.
Which Region Is Leading the Low Rolling Resistance Tire Market?
Asia Pacific is leading the low rolling resistance tire market, with 38.6% share in 2026 and a 7.6% CAGR to 2033, the largest absolute growth anywhere. China dominates both production and consumption, with Japan, Korea, India, Thailand and Indonesia adding substantial capacity. Scale comes from three things at once: the largest vehicle production base, the largest electric vehicle market, and most of the world’s tire manufacturing capacity.
Policy reinforces the position. Japan has operated a labelling scheme through its tire manufacturers association since 2010, and China runs its own labelling programme alongside fuel consumption standards for vehicles that push manufacturers toward efficient fitments. Domestic producers have invested heavily in silica compounding and solution polymer capability. The change to watch is electric vehicle-specific product ranges being developed locally rather than adapted from export designs.
Latin America Adopts Graded Tires Through Commercial Transport First
Latin America represented 6.4% share in 2026 and grows at 7.2% to 2033, ahead of the mature regions. Brazil and Mexico account for most consumption, with Argentina, Colombia and Chile contributing. Mexico’s position in vehicle assembly for export means a meaningful volume of graded original equipment fitment, while Brazilian demand is led by road freight operators who dominate domestic logistics and buy on cost per kilometre.
Barriers are substantial. No region-wide labelling requirement exists, so retail buyers lack comparable information, and import duties and currency volatility make premium products expensive relative to local incomes. Poor road surfaces also shorten tire life, which weakens the case for paying more. The opportunity sits in truck fleets and retreading, where the fuel saving is measurable and the casing is retained, making the economics defensible without any labelling mandate.
Which Region Is Growing Fastest in the Low Rolling Resistance Tire Market?
Middle East & Africa is growing fastest in the low rolling resistance tire market, at an 8.1% CAGR through 2033 from 5.6% share in 2026, the smallest base of the five regions. Saudi Arabia, the United Arab Emirates, Egypt, Morocco, Nigeria and South Africa drive most of the increase. Long-distance road freight across the Gulf and North Africa gives commercial operators a direct fuel incentive, and vehicle assembly in Morocco and South Africa supplies graded original equipment fitments.
Two causes explain the pace. Vehicle parc growth and urbanisation are raising replacement volumes from a low base. Separately, imported vehicles increasingly arrive with graded fitments, which pulls equivalent replacements through local channels. Barriers remain significant: high ambient temperatures and rough surfaces favour durability over efficiency, and a large informal used-tire trade competes on price. The change underway is organised retail tire chains expanding across the larger markets.
Competitive Landscape
The low rolling resistance tire market is highly concentrated. A small group of global manufacturers accounts for the majority of value, because the barriers are unusually high: compounding know-how, access to functionalised polymers and specialty silica, indoor rolling resistance test capability, mould investment across hundreds of sizes, and original equipment approval relationships built over vehicle programme cycles that run for years. Regional producers compete effectively in replacement sizes and lower grades, but the top label classes and electric vehicle fitments remain the preserve of companies that can fund long development programmes.
Competition runs on four things. Compound and polymer capability comes first, since the rolling resistance, wet grip and wear triangle is won or lost in the tread formulation. Original equipment engineering access is second: being inside a vehicle programme early determines whose tire is specified and, through that, which brand the owner replaces with. Label grade portfolio breadth is third, because a supplier needs top grades across common sizes rather than in a flagship line. Manufacturing cost per unit completes the set, as a graded tire still competes against cheaper alternatives in the replacement aisle.
Strategic direction is consistent across the industry. Manufacturers are deepening partnerships with specialty polymer and silica suppliers to secure functionalised materials, expanding electric vehicle-specific ranges with higher load indices and noise treatment, and investing in retreading and fleet services where the fuel argument is provable. Considerable engineering effort is also going into abrasion resistance and into alternatives to established antiozonant chemistry, in anticipation of regulatory change.
Across all of it runs one constraint. Every gain must be delivered without giving up wet grip or mileage, and that limit, more than any commercial strategy, shapes how quickly the category can grow.
Low Rolling Resistance Tire Industry Leaders
- Michelin
- Bridgestone Corporation
- Continental AG
- The Goodyear Tire & Rubber Company
- Sumitomo Rubber Industries, Ltd.
Recent Industry Developments
- November 2012: Tire labelling became mandatory across the European Union, requiring a graded display of fuel efficiency, wet grip and external rolling noise at the point of sale – it created the first common standard by which a low rolling resistance claim could be verified by a buyer.
- May 2021: The revised European Union tyre labelling rules became applicable, adding a QR code and registration of every tire in a public product database – it made grade data machine-readable and much harder to misrepresent in online and cross-border sales.
- October 2023: The California Department of Toxic Substances Control listed motor vehicle tires containing 6PPD as a priority product under its safer consumer products programme – it began a formal alternatives assessment process that remains under way rather than concluded.
- May 2024: The European Union adopted the Euro 7 vehicle regulation, which for the first time brings tire abrasion within the scope of vehicle emissions law alongside exhaust and brake emissions – it will require compound and construction changes once the test method and limits are finalised.
- July 2024: The European Union General Safety Regulation became applicable to all newly registered vehicles, not only new type approvals, carrying tire pressure monitoring and related requirements – it locked in the vehicle-side conditions on which rolling resistance performance depends in service.
Companies Covered in the Report
- Michelin
- Bridgestone Corporation
- The Goodyear Tire & Rubber Company
- Continental AG
- Pirelli & C. S.p.A.
- Sumitomo Rubber Industries, Ltd.
- Hankook Tire & Technology Co., Ltd.
- The Yokohama Rubber Co., Ltd.
- Toyo Tire Corporation
- Nokian Tyres plc
- Kumho Tire Co., Inc.
- Zhongce Rubber Group Co., Ltd.
- Apollo Tyres Ltd.
- MRF Limited
Low Rolling Resistance Tire Market Report Scope
This report covers tires marketed and labelled for low rolling resistance across passenger car, light truck, truck and bus and electric vehicle fitments, in original equipment and replacement channels, including the tread compounds, polymers and lightweight constructions that deliver the effect. Tires without a published fuel efficiency grade or a contracted rolling resistance target are excluded. The base year is 2025, the forecast period 2026 to 2033, in US$ Billion.
Vehicle Type
- Passenger Car
- Light Truck and Light Commercial Vehicle
- Truck and Bus
- Electric Vehicle-Specific Fitments
Sales Channel
- Original Equipment
- Replacement
Rolling Resistance Class
- Class A
- Class B
- Class C
- Class D and Below
Technology
- Silica-Silane Tread Compounds
- Functionalised Solution Styrene-Butadiene Polymers
- Lightweight Construction and Reduced-Mass Bead and Belt Packages
- Sealant, Foam and Other Integrated Systems
Regions
- North America
- Europe
- Asia Pacific
- Latin America
- Middle East & Africa
Key Questions Answered in the Report
How big is the low rolling resistance tire market in 2026?
The global low rolling resistance tire market is valued at US$ 38.6 billion in 2026, covering graded original equipment and replacement fitments worldwide.
What is the forecast size and CAGR of the low rolling resistance tire market by 2033?
The market is projected to reach US$ 62.4 billion by 2033, growing at a 7.1% CAGR and adding an absolute opportunity of US$ 23.8 billion.
Which vehicle type leads the low rolling resistance tire market?
Passenger car fitments lead with 54.2% share in 2026, because the parc is largest and labelling schemes were written around this category first.
Which segment and region are growing fastest in the low rolling resistance tire market?
Electric vehicle-specific fitments grow fastest at a 12.4% CAGR, and Middle East & Africa is the quickest region at an 8.1% CAGR through 2033.
Which region holds the largest low rolling resistance tire market share?
Asia Pacific holds the largest share at 38.6% in 2026, supported by its vehicle production base, electric vehicle demand and concentrated tire manufacturing capacity.
1. Executive Summary
1.1. Global Low Rolling Resistance Tire Market Snapshot
1.2. Future Projections
1.3. Key Report Takeaways
1.4. Regional Snapshot
2. Market Overview
2.1. Market Definition and Report Scope
2.2. Historical Trends 2020–2025
2.3. Market Dynamics
2.3.1. Drivers
2.3.1.1. Labelling Schemes Turn Rolling Resistance Into a Specification Buyers Can Actually Purchase
2.3.1.2. Electric Vehicle Mass, Torque and Range Targets Harden Rolling Resistance Specifications
2.3.2. Restraints
2.3.2.1. Price Premium and Unprovable Savings Slow Retail Uptake of Low Rolling Resistance Tires
2.3.2.2. Tire Abrasion Rules and Compound Chemistry Reviews Create New Regulatory Exposure
2.3.3. Market Opportunities
2.3.3.1. Truck and Bus Fleet Fuel Economics Open a Measurable Low Rolling Resistance Revenue Pool
2.3.3.2. Label-Driven Replacement and EV-Specific Fitments Open a Premium Aftermarket Pool
3. Global Low Rolling Resistance Tire Market Outlook, 2020–2033
3.1. Global Low Rolling Resistance Tire Market Outlook, by Vehicle Type, Value (US$ Billion), 2020–2033
3.1.1. Passenger Car
3.1.2. Light Truck and Light Commercial Vehicle
3.1.3. Truck and Bus
3.1.4. Electric Vehicle-Specific Fitments
3.2. Global Low Rolling Resistance Tire Market Outlook, by Sales Channel, Value (US$ Billion), 2020–2033
3.2.1. Original Equipment
3.2.2. Replacement
3.3. Global Low Rolling Resistance Tire Market Outlook, by Rolling Resistance Class, Value (US$ Billion), 2020–2033
3.3.1. Class A
3.3.2. Class B
3.3.3. Class C
3.3.4. Class D and Below
3.4. Global Low Rolling Resistance Tire Market Outlook, by Technology, Value (US$ Billion), 2020–2033
3.4.1. Silica-Silane Tread Compounds
3.4.2. Functionalised Solution Styrene-Butadiene Polymers
3.4.3. Lightweight Construction and Reduced-Mass Bead and Belt Packages
3.4.4. Sealant, Foam and Other Integrated Systems
3.5. Global Low Rolling Resistance Tire Market Outlook, by Region, Value (US$ Billion), 2020–2033
3.5.1. North America
3.5.2. Europe
3.5.3. Asia Pacific
3.5.4. Latin America
3.5.5. Middle East & Africa
4. North America Low Rolling Resistance Tire Market Outlook, 2020–2033
4.1. North America Low Rolling Resistance Tire Market Outlook, by Vehicle Type, Value (US$ Billion), 2020–2033
4.1.1. Passenger Car
4.1.2. Light Truck and Light Commercial Vehicle
4.1.3. Truck and Bus
4.1.4. Electric Vehicle-Specific Fitments
4.2. North America Low Rolling Resistance Tire Market Outlook, by Sales Channel, Value (US$ Billion), 2020–2033
4.2.1. Original Equipment
4.2.2. Replacement
4.3. North America Low Rolling Resistance Tire Market Outlook, by Rolling Resistance Class, Value (US$ Billion), 2020–2033
4.3.1. Class A
4.3.2. Class B
4.3.3. Class C
4.3.4. Class D and Below
4.4. North America Low Rolling Resistance Tire Market Outlook, by Technology, Value (US$ Billion), 2020–2033
4.4.1. Silica-Silane Tread Compounds
4.4.2. Functionalised Solution Styrene-Butadiene Polymers
4.4.3. Lightweight Construction and Reduced-Mass Bead and Belt Packages
4.4.4. Sealant, Foam and Other Integrated Systems
4.5. North America Low Rolling Resistance Tire Market Outlook, by Country, Value (US$ Billion), 2020–2033
4.5.1. United States Low Rolling Resistance Tire Market Outlook, by Vehicle Type, 2020–2033
4.5.2. United States Low Rolling Resistance Tire Market Outlook, by Sales Channel, 2020–2033
4.5.3. United States Low Rolling Resistance Tire Market Outlook, by Rolling Resistance Class, 2020–2033
4.5.4. United States Low Rolling Resistance Tire Market Outlook, by Technology, 2020–2033
4.5.5. Canada Low Rolling Resistance Tire Market Outlook, by Vehicle Type, 2020–2033
4.5.6. Canada Low Rolling Resistance Tire Market Outlook, by Sales Channel, 2020–2033
4.5.7. Canada Low Rolling Resistance Tire Market Outlook, by Rolling Resistance Class, 2020–2033
4.5.8. Canada Low Rolling Resistance Tire Market Outlook, by Technology, 2020–2033
4.5.9. Mexico Low Rolling Resistance Tire Market Outlook, by Vehicle Type, 2020–2033
4.5.10. Mexico Low Rolling Resistance Tire Market Outlook, by Sales Channel, 2020–2033
4.5.11. Mexico Low Rolling Resistance Tire Market Outlook, by Rolling Resistance Class, 2020–2033
4.5.12. Mexico Low Rolling Resistance Tire Market Outlook, by Technology, 2020–2033
5. Europe Low Rolling Resistance Tire Market Outlook, 2020–2033
5.1. Europe Low Rolling Resistance Tire Market Outlook, by Vehicle Type, Value (US$ Billion), 2020–2033
5.1.1. Passenger Car
5.1.2. Light Truck and Light Commercial Vehicle
5.1.3. Truck and Bus
5.1.4. Electric Vehicle-Specific Fitments
5.2. Europe Low Rolling Resistance Tire Market Outlook, by Sales Channel, Value (US$ Billion), 2020–2033
5.2.1. Original Equipment
5.2.2. Replacement
5.3. Europe Low Rolling Resistance Tire Market Outlook, by Rolling Resistance Class, Value (US$ Billion), 2020–2033
5.3.1. Class A
5.3.2. Class B
5.3.3. Class C
5.3.4. Class D and Below
5.4. Europe Low Rolling Resistance Tire Market Outlook, by Technology, Value (US$ Billion), 2020–2033
5.4.1. Silica-Silane Tread Compounds
5.4.2. Functionalised Solution Styrene-Butadiene Polymers
5.4.3. Lightweight Construction and Reduced-Mass Bead and Belt Packages
5.4.4. Sealant, Foam and Other Integrated Systems
5.5. Europe Low Rolling Resistance Tire Market Outlook, by Country, Value (US$ Billion), 2020–2033
5.5.1. Germany Low Rolling Resistance Tire Market Outlook, by Vehicle Type, 2020–2033
5.5.2. Germany Low Rolling Resistance Tire Market Outlook, by Sales Channel, 2020–2033
5.5.3. Germany Low Rolling Resistance Tire Market Outlook, by Rolling Resistance Class, 2020–2033
5.5.4. Germany Low Rolling Resistance Tire Market Outlook, by Technology, 2020–2033
5.5.5. France Low Rolling Resistance Tire Market Outlook, by Vehicle Type, 2020–2033
5.5.6. France Low Rolling Resistance Tire Market Outlook, by Sales Channel, 2020–2033
5.5.7. France Low Rolling Resistance Tire Market Outlook, by Rolling Resistance Class, 2020–2033
5.5.8. France Low Rolling Resistance Tire Market Outlook, by Technology, 2020–2033
5.5.9. Italy Low Rolling Resistance Tire Market Outlook, by Vehicle Type, 2020–2033
5.5.10. Italy Low Rolling Resistance Tire Market Outlook, by Sales Channel, 2020–2033
5.5.11. Italy Low Rolling Resistance Tire Market Outlook, by Rolling Resistance Class, 2020–2033
5.5.12. Italy Low Rolling Resistance Tire Market Outlook, by Technology, 2020–2033
5.5.13. Spain Low Rolling Resistance Tire Market Outlook, by Vehicle Type, 2020–2033
5.5.14. Spain Low Rolling Resistance Tire Market Outlook, by Sales Channel, 2020–2033
5.5.15. Spain Low Rolling Resistance Tire Market Outlook, by Rolling Resistance Class, 2020–2033
5.5.16. Spain Low Rolling Resistance Tire Market Outlook, by Technology, 2020–2033
5.5.17. Poland Low Rolling Resistance Tire Market Outlook, by Vehicle Type, 2020–2033
5.5.18. Poland Low Rolling Resistance Tire Market Outlook, by Sales Channel, 2020–2033
5.5.19. Poland Low Rolling Resistance Tire Market Outlook, by Rolling Resistance Class, 2020–2033
5.5.20. Poland Low Rolling Resistance Tire Market Outlook, by Technology, 2020–2033
6. Asia Pacific Low Rolling Resistance Tire Market Outlook, 2020–2033
6.1. Asia Pacific Low Rolling Resistance Tire Market Outlook, by Vehicle Type, Value (US$ Billion), 2020–2033
6.1.1. Passenger Car
6.1.2. Light Truck and Light Commercial Vehicle
6.1.3. Truck and Bus
6.1.4. Electric Vehicle-Specific Fitments
6.2. Asia Pacific Low Rolling Resistance Tire Market Outlook, by Sales Channel, Value (US$ Billion), 2020–2033
6.2.1. Original Equipment
6.2.2. Replacement
6.3. Asia Pacific Low Rolling Resistance Tire Market Outlook, by Rolling Resistance Class, Value (US$ Billion), 2020–2033
6.3.1. Class A
6.3.2. Class B
6.3.3. Class C
6.3.4. Class D and Below
6.4. Asia Pacific Low Rolling Resistance Tire Market Outlook, by Technology, Value (US$ Billion), 2020–2033
6.4.1. Silica-Silane Tread Compounds
6.4.2. Functionalised Solution Styrene-Butadiene Polymers
6.4.3. Lightweight Construction and Reduced-Mass Bead and Belt Packages
6.4.4. Sealant, Foam and Other Integrated Systems
6.5. Asia Pacific Low Rolling Resistance Tire Market Outlook, by Country, Value (US$ Billion), 2020–2033
6.5.1. China Low Rolling Resistance Tire Market Outlook, by Vehicle Type, 2020–2033
6.5.2. China Low Rolling Resistance Tire Market Outlook, by Sales Channel, 2020–2033
6.5.3. China Low Rolling Resistance Tire Market Outlook, by Rolling Resistance Class, 2020–2033
6.5.4. China Low Rolling Resistance Tire Market Outlook, by Technology, 2020–2033
6.5.5. Japan Low Rolling Resistance Tire Market Outlook, by Vehicle Type, 2020–2033
6.5.6. Japan Low Rolling Resistance Tire Market Outlook, by Sales Channel, 2020–2033
6.5.7. Japan Low Rolling Resistance Tire Market Outlook, by Rolling Resistance Class, 2020–2033
6.5.8. Japan Low Rolling Resistance Tire Market Outlook, by Technology, 2020–2033
6.5.9. Korea Low Rolling Resistance Tire Market Outlook, by Vehicle Type, 2020–2033
6.5.10. Korea Low Rolling Resistance Tire Market Outlook, by Sales Channel, 2020–2033
6.5.11. Korea Low Rolling Resistance Tire Market Outlook, by Rolling Resistance Class, 2020–2033
6.5.12. Korea Low Rolling Resistance Tire Market Outlook, by Technology, 2020–2033
6.5.13. India Low Rolling Resistance Tire Market Outlook, by Vehicle Type, 2020–2033
6.5.14. India Low Rolling Resistance Tire Market Outlook, by Sales Channel, 2020–2033
6.5.15. India Low Rolling Resistance Tire Market Outlook, by Rolling Resistance Class, 2020–2033
6.5.16. India Low Rolling Resistance Tire Market Outlook, by Technology, 2020–2033
6.5.17. Thailand Low Rolling Resistance Tire Market Outlook, by Vehicle Type, 2020–2033
6.5.18. Thailand Low Rolling Resistance Tire Market Outlook, by Sales Channel, 2020–2033
6.5.19. Thailand Low Rolling Resistance Tire Market Outlook, by Rolling Resistance Class, 2020–2033
6.5.20. Thailand Low Rolling Resistance Tire Market Outlook, by Technology, 2020–2033
6.5.21. Indonesia Low Rolling Resistance Tire Market Outlook, by Vehicle Type, 2020–2033
6.5.22. Indonesia Low Rolling Resistance Tire Market Outlook, by Sales Channel, 2020–2033
6.5.23. Indonesia Low Rolling Resistance Tire Market Outlook, by Rolling Resistance Class, 2020–2033
6.5.24. Indonesia Low Rolling Resistance Tire Market Outlook, by Technology, 2020–2033
7. Latin America Low Rolling Resistance Tire Market Outlook, 2020–2033
7.1. Latin America Low Rolling Resistance Tire Market Outlook, by Vehicle Type, Value (US$ Billion), 2020–2033
7.1.1. Passenger Car
7.1.2. Light Truck and Light Commercial Vehicle
7.1.3. Truck and Bus
7.1.4. Electric Vehicle-Specific Fitments
7.2. Latin America Low Rolling Resistance Tire Market Outlook, by Sales Channel, Value (US$ Billion), 2020–2033
7.2.1. Original Equipment
7.2.2. Replacement
7.3. Latin America Low Rolling Resistance Tire Market Outlook, by Rolling Resistance Class, Value (US$ Billion), 2020–2033
7.3.1. Class A
7.3.2. Class B
7.3.3. Class C
7.3.4. Class D and Below
7.4. Latin America Low Rolling Resistance Tire Market Outlook, by Technology, Value (US$ Billion), 2020–2033
7.4.1. Silica-Silane Tread Compounds
7.4.2. Functionalised Solution Styrene-Butadiene Polymers
7.4.3. Lightweight Construction and Reduced-Mass Bead and Belt Packages
7.4.4. Sealant, Foam and Other Integrated Systems
7.5. Latin America Low Rolling Resistance Tire Market Outlook, by Country, Value (US$ Billion), 2020–2033
7.5.1. Brazil Low Rolling Resistance Tire Market Outlook, by Vehicle Type, 2020–2033
7.5.2. Brazil Low Rolling Resistance Tire Market Outlook, by Sales Channel, 2020–2033
7.5.3. Brazil Low Rolling Resistance Tire Market Outlook, by Rolling Resistance Class, 2020–2033
7.5.4. Brazil Low Rolling Resistance Tire Market Outlook, by Technology, 2020–2033
7.5.5. Mexico Low Rolling Resistance Tire Market Outlook, by Vehicle Type, 2020–2033
7.5.6. Mexico Low Rolling Resistance Tire Market Outlook, by Sales Channel, 2020–2033
7.5.7. Mexico Low Rolling Resistance Tire Market Outlook, by Rolling Resistance Class, 2020–2033
7.5.8. Mexico Low Rolling Resistance Tire Market Outlook, by Technology, 2020–2033
7.5.9. Argentina Low Rolling Resistance Tire Market Outlook, by Vehicle Type, 2020–2033
7.5.10. Argentina Low Rolling Resistance Tire Market Outlook, by Sales Channel, 2020–2033
7.5.11. Argentina Low Rolling Resistance Tire Market Outlook, by Rolling Resistance Class, 2020–2033
7.5.12. Argentina Low Rolling Resistance Tire Market Outlook, by Technology, 2020–2033
7.5.13. Colombia Low Rolling Resistance Tire Market Outlook, by Vehicle Type, 2020–2033
7.5.14. Colombia Low Rolling Resistance Tire Market Outlook, by Sales Channel, 2020–2033
7.5.15. Colombia Low Rolling Resistance Tire Market Outlook, by Rolling Resistance Class, 2020–2033
7.5.16. Colombia Low Rolling Resistance Tire Market Outlook, by Technology, 2020–2033
7.5.17. Chile Low Rolling Resistance Tire Market Outlook, by Vehicle Type, 2020–2033
7.5.18. Chile Low Rolling Resistance Tire Market Outlook, by Sales Channel, 2020–2033
7.5.19. Chile Low Rolling Resistance Tire Market Outlook, by Rolling Resistance Class, 2020–2033
7.5.20. Chile Low Rolling Resistance Tire Market Outlook, by Technology, 2020–2033
8. Middle East & Africa Low Rolling Resistance Tire Market Outlook, 2020–2033
8.1. Middle East & Africa Low Rolling Resistance Tire Market Outlook, by Vehicle Type, Value (US$ Billion), 2020–2033
8.1.1. Passenger Car
8.1.2. Light Truck and Light Commercial Vehicle
8.1.3. Truck and Bus
8.1.4. Electric Vehicle-Specific Fitments
8.2. Middle East & Africa Low Rolling Resistance Tire Market Outlook, by Sales Channel, Value (US$ Billion), 2020–2033
8.2.1. Original Equipment
8.2.2. Replacement
8.3. Middle East & Africa Low Rolling Resistance Tire Market Outlook, by Rolling Resistance Class, Value (US$ Billion), 2020–2033
8.3.1. Class A
8.3.2. Class B
8.3.3. Class C
8.3.4. Class D and Below
8.4. Middle East & Africa Low Rolling Resistance Tire Market Outlook, by Technology, Value (US$ Billion), 2020–2033
8.4.1. Silica-Silane Tread Compounds
8.4.2. Functionalised Solution Styrene-Butadiene Polymers
8.4.3. Lightweight Construction and Reduced-Mass Bead and Belt Packages
8.4.4. Sealant, Foam and Other Integrated Systems
8.5. Middle East & Africa Low Rolling Resistance Tire Market Outlook, by Country, Value (US$ Billion), 2020–2033
8.5.1. Saudi Arabia Low Rolling Resistance Tire Market Outlook, by Vehicle Type, 2020–2033
8.5.2. Saudi Arabia Low Rolling Resistance Tire Market Outlook, by Sales Channel, 2020–2033
8.5.3. Saudi Arabia Low Rolling Resistance Tire Market Outlook, by Rolling Resistance Class, 2020–2033
8.5.4. Saudi Arabia Low Rolling Resistance Tire Market Outlook, by Technology, 2020–2033
8.5.5. United Arab Emirates Low Rolling Resistance Tire Market Outlook, by Vehicle Type, 2020–2033
8.5.6. United Arab Emirates Low Rolling Resistance Tire Market Outlook, by Sales Channel, 2020–2033
8.5.7. United Arab Emirates Low Rolling Resistance Tire Market Outlook, by Rolling Resistance Class, 2020–2033
8.5.8. United Arab Emirates Low Rolling Resistance Tire Market Outlook, by Technology, 2020–2033
8.5.9. Egypt Low Rolling Resistance Tire Market Outlook, by Vehicle Type, 2020–2033
8.5.10. Egypt Low Rolling Resistance Tire Market Outlook, by Sales Channel, 2020–2033
8.5.11. Egypt Low Rolling Resistance Tire Market Outlook, by Rolling Resistance Class, 2020–2033
8.5.12. Egypt Low Rolling Resistance Tire Market Outlook, by Technology, 2020–2033
8.5.13. Morocco Low Rolling Resistance Tire Market Outlook, by Vehicle Type, 2020–2033
8.5.14. Morocco Low Rolling Resistance Tire Market Outlook, by Sales Channel, 2020–2033
8.5.15. Morocco Low Rolling Resistance Tire Market Outlook, by Rolling Resistance Class, 2020–2033
8.5.16. Morocco Low Rolling Resistance Tire Market Outlook, by Technology, 2020–2033
8.5.17. Nigeria Low Rolling Resistance Tire Market Outlook, by Vehicle Type, 2020–2033
8.5.18. Nigeria Low Rolling Resistance Tire Market Outlook, by Sales Channel, 2020–2033
8.5.19. Nigeria Low Rolling Resistance Tire Market Outlook, by Rolling Resistance Class, 2020–2033
8.5.20. Nigeria Low Rolling Resistance Tire Market Outlook, by Technology, 2020–2033
8.5.21. South Africa Low Rolling Resistance Tire Market Outlook, by Vehicle Type, 2020–2033
8.5.22. South Africa Low Rolling Resistance Tire Market Outlook, by Sales Channel, 2020–2033
8.5.23. South Africa Low Rolling Resistance Tire Market Outlook, by Rolling Resistance Class, 2020–2033
8.5.24. South Africa Low Rolling Resistance Tire Market Outlook, by Technology, 2020–2033
9. Competitive Landscape
9.1. Market Concentration and Industry Leaders
9.2. Competitive Differentiation
9.3. Strategic Moves and Market Direction
9.4. Recent Industry Developments
9.5. Company Profiles
9.5.1. Michelin
9.5.2. Bridgestone Corporation
9.5.3. The Goodyear Tire & Rubber Company
9.5.4. Continental AG
9.5.5. Pirelli & C. S.p.A.
9.5.6. Sumitomo Rubber Industries, Ltd.
9.5.7. Hankook Tire & Technology Co., Ltd.
9.5.8. The Yokohama Rubber Co., Ltd.
9.5.9. Toyo Tire Corporation
9.5.10. Nokian Tyres plc
9.5.11. Kumho Tire Co., Inc.
9.5.12. Zhongce Rubber Group Co., Ltd.
9.5.13. Apollo Tyres Ltd.
9.5.14. MRF Limited
10. Appendix
10.1. Research Methodology
10.2. Report Assumptions
10.3. Acronyms and Abbreviations
| Vehicle Type | Passenger Car, Light Truck and Light Commercial Vehicle, Truck and Bus, Electric Vehicle-Specific Fitments |
| Sales Channel | Original Equipment, Replacement |
| Rolling Resistance Class | Class A, Class B, Class C, Class D and Below |
| Technology | Silica-Silane Tread Compounds, Functionalised Solution Styrene-Butadiene Polymers, Lightweight Construction and Reduced-Mass Bead and Belt Packages, Sealant, Foam and Other Integrated Systems |
| Regions | North America, Europe, Asia Pacific, Latin America, Middle East & Africa |
Our Research Methodology
Considering the volatility of business today, traditional approaches to strategizing a game plan can be unfruitful if not detrimental. True ambiguity is no way to determine a forecast. A myriad of predetermined factors must be accounted for such as the degree of risk involved, the magnitude of circumstances, as well as conditions or consequences that are not known or unpredictable. To circumvent binary views that cast uncertainty, the application of market research intelligence to strategically posture, move, and enable actionable outcomes is necessary.
View Methodology
Quality Assured
Rigorous Validation Process

Confidentiality Assured
End-to-end Data Security

Custom Research Services
Tailored To Your Objectives
FAQs
The global low rolling resistance tire market is valued at US$ 38.6 billion in 2026, covering graded original equipment and replacement fitments worldwide.
The market is projected to reach US$ 62.4 billion by 2033, growing at a 7.1% CAGR and adding an absolute opportunity of US$ 23.8 billion.
Passenger car fitments lead with 54.2% share in 2026, because the parc is largest and labelling schemes were written around this category first.
Electric vehicle-specific fitments grow fastest at a 12.4% CAGR, and Middle East & Africa is the quickest region at an 8.1% CAGR through 2033.
Asia Pacific holds the largest share at 38.6% in 2026, supported by its vehicle production base, electric vehicle demand and concentrated tire manufacturing capacity.
Related Reports
Small Parcels Delivery Market Size, Share, Insights, Competitive Landscape, and Forecast 2026 to 2033
Explore the small parcels delivery market, forecast to reach US$957.5 billion by 2033 at 7.3% CAGR, with service, shipment weight and regional insights.
Advanced Aerial Mobility Market Size, Share, Insights, Competitive Landscape, and Forecast 2026 to 2033
The global advanced aerial mobility market is valued at US$18.51 billion in 2026, reaching US$90.75 billion by 2033, growing at a 25.5% CAGR
Active Noise and Vibration Control System Market Size, Share, Insights, Competitive Landscape, and Forecast 2026 to 2033
The global active noise and vibration control system market is valued at US$3.84 billion in 2026, reaching US$6.09 billion by 2033, growing at a 6.8% CAGR
Autonomous Cars, Robotaxis & Sensors Market Size, Share, Insights, Competitive Landscape, and Forecast 2026 to 2033
The autonomous cars, robotaxis and sensors market is projected to grow from US$38.0 Bn in 2026 to US$118.3 Bn by 2033, at a CAGR of 17.6%.
Electric Two Wheeler Market Size, Share, Insights, Competitive Landscape, and Forecast 2026 to 2033
The electric two wheeler market is projected to grow from US$52.0 billion in 2026 to US$98.4 billion by 2033, at a CAGR of 9.5%, led by Asia Pacific demand.
Pass by Noise Testing Market Size, Share, Insights, Competitive Landscape, and Forecast 2026 to 2033
Pass-by noise testing market to grow from US$1.72 Bn in 2026 to US$2.43 Bn by 2033 at 5.0% CAGR. Explore components, test types, propulsion and regions.