



Margarine Market
Margarine Market Size, Share, Insights, Competitive Landscape, and Forecast 2026 to 2033
Report Overview
Margarine Market Size and Trend Analysis
What Is the Growth Outlook for the Margarine Market?
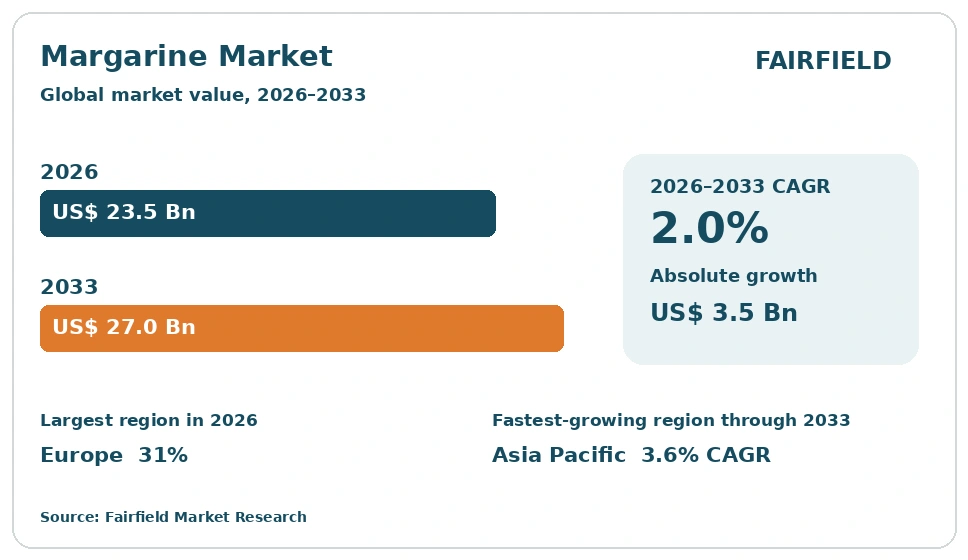
The global margarine market size is expected to be valued at US$ 23.5 billion in 2026 and projected to reach US$ 27.0 billion by 2033, growing at a CAGR of 2.0% between 2026 and 2033.
Growth was slower still in the recent past, at roughly 1.4% a year between 2020 and 2025, from a 2025 base near US$ 23.1 billion. The headline rate hides two businesses moving in opposite directions. Retail spread volumes in North America and Europe have fallen for more than a decade as household purchases returned to butter, and private label has absorbed much of what remains. The bakery and industrial half is stable and contracted, bought on solid fat content curve, plasticity range and melting point rather than on brand. Most of the forecast therefore comes from industrial fats, from spread consumption in Asia Pacific and Middle East & Africa, and from vegetable oil price pass-through rather than from volume gains.
Key Report Takeaways
- By Product Type: Bakery and Industrial Margarine held 34% share in 2026, while Liquid and Pumpable Margarine is projected to expand at a 3.4% CAGR through 2033, driven by automated dosing on continuous bakery and sauce lines.
- By Oil Base: Palm and Palm Kernel Oil held 42% share in 2026, while Rapeseed and Canola Oil is projected to expand at a 3.1% CAGR through 2033, driven by formulators diversifying away from concentrated tropical oil exposure.
- By Fat Content Band: Full-Fat at 80% and above held 45% share in 2026, while Three-Quarter-Fat at 60–62% is projected to expand at a 2.9% CAGR through 2033, driven by lower oil content per pack in price-sensitive retail markets.
- By Application: Bakery and Confectionery held 39% share in 2026, while Foodservice and Restaurant is projected to expand at a 3.3% CAGR through 2033, driven by frying and pastry demand from expanding chain kitchens.
- By Distribution Channel: Industrial Direct Supply and Distributors held 41% share in 2026, while Online Retail is projected to expand at a 5.2% CAGR through 2033, driven by grocery delivery platforms taking a growing share of packaged spread sales.
- By Geography: Europe held 31% share in 2026, while Asia Pacific is projected to expand at a 3.6% CAGR through 2033, driven by industrial bakery growth and widening spread consumption.
Global Margarine Market Trends and Insights
Drivers Impact Analysis
Two forces explain most of the value the category still adds, and neither of them comes from the retail shelf.
| Driver | Impact on CAGR Forecast | Geographic Relevance | Impact Timeline |
| Reformulated fat bases required by industrial trans fat rules | High | Global, earliest in North America and Europe | Long term ≥4 years |
| Spread consumption growth in markets with limited household refrigeration | Medium | Asia Pacific, Middle East & Africa, Latin America | Medium term 2–4 years |
Trans Fat Elimination Rules Rebuilt the Fat Base and Locked In Structuring Fats
The removal of industrially produced trans fatty acids is the defining commercial event in this category, and it still sets what the industry buys. Margarine was historically given its solid structure by partially hydrogenating liquid oils, a process that generated trans fatty acids as a by-product. Once regulators restricted them, every recipe in the industry had to be rebuilt, and the replacement structures are now standard across retail and industrial grades.
The mechanism is physical chemistry. Solid structure now comes from fully hydrogenated hard stocks blended by interesterification, from fractionated stearins, and from naturally semi-solid tropical fats, principally palm and palm kernel oil. These routes need interesterification reactors, fractionation plant and tighter crystallisation control, so the reformulation permanently raised the capital and technical content of manufacture. The World Health Organization target for eliminating industrial trans fat keeps extending the same requirement into new jurisdictions.
Emerging-Market Spread Consumption Adds Volume Where Refrigeration Is Limited
Volume growth now comes almost entirely from markets where packaged spreads are still gaining household penetration. In much of Asia, Africa and Latin America, vegetable fat spreads are a practical table and cooking fat, sold in small tubs, sachets and tins through traditional trade. That demand is expanding with urbanisation and with the spread of packaged bread, while mature markets shrink.
The mechanism is distribution economics rather than preference. Vegetable fat spreads tolerate ambient storage far better than butter, hold their structure at higher temperatures when formulated with palm stearin fractions, and cost less per kilogram because the oil base is cheaper than milk fat. Small pack sizes bring the unit price within reach of daily shopping baskets. Local filling and packing plants in Nigeria, Indonesia, India and Egypt supply this demand from imported bulk refined oils.
Restraints Impact Analysis
Two restraints hold the category close to flat in value and keep margins under constant pressure.
| Restraint | Impact on CAGR Forecast | Geographic Relevance | Impact Timeline |
| Long-term retail volume decline and substitution by butter | High | North America, Europe, Oceania | Short term ≤2 years |
| Palm traceability obligations and vegetable oil price volatility | High | Global, strongest for suppliers into the European Union | Medium term 2–4 years |
Long-Term Retail Decline and Butter Substitution Shrink the Spreads Shelf
The retail half of this category has been losing volume for more than a decade in developed markets, and that decline sets the ceiling on the whole forecast. Household buyers in the United States, the United Kingdom, Germany, France and Australia have moved purchases back toward butter and dairy blends. Grocers have responded by cutting the number of spread lines carried and reallocating chilled space.
The cause is partly relative price and partly positioning. When butter prices fall, substitution accelerates, and the spreads category has limited pricing power to respond because its own input is a traded commodity. Private label compounds the problem, since spreads are technically straightforward to contract-manufacture and retailers can switch suppliers on price alone. Branded manufacturers are left supporting marketing costs on a declining volume base, which erodes the margin available for innovation.
Palm Traceability Obligations and Vegetable Oil Price Swings Raise Input Cost
Input cost is the second structural pressure, and it arrives through two separate channels. Margarine is mostly oil by weight, so any movement in palm, soybean, rapeseed or sunflower prices passes almost directly into cost of goods. Price shocks during the past several years have repeatedly outpaced the ability of manufacturers to reprice retail packs, compressing margin across the industry.
The second channel is compliance. The European Union Deforestation Regulation brings palm oil within due diligence obligations that require geolocation data for the plot of production and a statement that the material is deforestation-free. Roundtable on Sustainable Palm Oil certification, segregated or mass balance supply chains, and mill-level traceability all carry cost that falls on the refiner and is passed to the margarine maker. For a category built on tropical structuring fats, that cost is unavoidable rather than optional.
Market Opportunities
Laminating and Puff Pastry Fats Open a Specification-Led Revenue Pool
The most defensible revenue pool is in laminating, puff pastry, cake and cream margarines sold to industrial bakeries. These are engineered fats, specified by solid fat content at several temperatures, plasticity range, crystal form stability and working temperature window, and they command materially better margins than retail spreads. Industrial bakery output is growing worldwide, and every new croissant, puff pastry or layered biscuit line needs a fat that performs through a sheeting and folding process.
Oils and fats specialists with interesterification and fractionation capacity are best placed to capture it, selling to plant bakeries, frozen dough producers and contract manufacturers. Demand is created by bakery automation, which has narrow tolerances and punishes batch variation. Application bakeries, pilot sheeting lines and technical service teams are the commercial entry point, because a baker will not change fat supplier without a successful trial run on their own equipment.
Structuring Technology for Lower-Saturate Bases Creates a Reformulation Premium
A second pool is opening around fat bases that deliver solid structure with less saturated hard stock. Oleogels built with waxes, monoglycerides, ethylcellulose or protein networks, high-oleic sunflower and rapeseed fractions, and enzymatic interesterification routes all aim at the same target: keeping the plasticity curve while changing the fatty acid composition that must be declared. Customers pay more for a base that meets a compositional specification without losing bakery performance.
Ingredient suppliers, oilseed processors and specialist fat producers can take this, with industrial bakeries and packaged food manufacturers as the buyers. The pull comes from finished-product specifications written around declared composition, and from retailers that set compositional limits in own-label contracts. Pilot-scale crystallisation equipment and shelf-life testing capability are the practical requirements, since a structured fat must hold its form through months of distribution.
Segment Analysis
By Product Type: Bakery and Industrial Grades Lead While Pumpable Fats Gain Ground
Bakery and Industrial Margarine held 34% share in 2026, the leading type, because industrial bakeries buy large, contracted volumes of puff pastry, cake, cream and laminating fats to fixed specifications. Retail Tub Margarine and Fat Spreads follow at 27%, still sizeable but shrinking in mature grocery markets. Shortening and Bakery Fats take 19% where they are sold alongside margarine through the same channels, and Retail Block and Hard Margarine holds 12%, used mainly for home baking. Liquid and Pumpable Margarine is the fastest-growing type at a 3.4% CAGR through 2033, because continuous dosing systems on automated bakery, sauce and coating lines need a fat that can be metered rather than scaled by hand. Growth therefore tracks factory automation more closely than consumer demand.
By Oil Base: Palm Dominates Structure While Rapeseed Advances Fastest
Palm and Palm Kernel Oil supplied 42% of this market in 2026, the leading base, because palm fractions provide solid structure at ambient temperature without partial hydrogenation and are the cheapest route to a stable crystal network. Soybean Oil holds 19%, concentrated in the United States and Brazil, and Sunflower Oil 14%, strongest in Europe and the Black Sea supply region. Other Vegetable and Marine Oils account for 9%. Rapeseed and Canola Oil is the fastest-growing base at a 3.1% CAGR through 2033, as formulators dilute concentrated tropical exposure to reduce due diligence burden and price risk, and because enzymatic interesterification allows rapeseed to carry more of the liquid phase. Oil base selection is now a procurement and compliance decision as much as a technical one.
By Fat Content Band: Full-Fat Grades Lead as Three-Quarter-Fat Spreads Grow Quickest
Full-Fat grades at 80% and above accounted for 45% of the market in 2026, the leading band, because every bakery, laminating and industrial fat sits here and because water cannot be carried through a sheeting process. Half-Fat spreads at 39–41% hold 23% of value, concentrated in mature retail markets where the band has been established for decades. Reduced-Fat spreads below 39% take 11%, limited by emulsion stability and by the difficulty of holding structure at high water content. Three-Quarter-Fat spreads at 60–62% are the fastest-growing band at a 2.9% CAGR through 2033, because they cut oil content per pack in markets where the oil bill governs retail price. The band mix is therefore driven largely by input cost arithmetic.
By Application: Bakery Leads Consumption While Foodservice Expands Most Quickly
Bakery and Confectionery represented 39% of demand in 2026, the leading application, since industrial and craft bakeries consume laminating, cake, cream and all-purpose fats in volumes no other outlet matches. Household Consumption follows at 28%, declining slowly in developed grocery markets while growing in emerging ones. Processed Food Manufacturing holds 19%, covering sauces, fillings, coatings, soups and ready meals that use margarine as a formulated fat phase. Foodservice and Restaurant is the fastest-growing application at a 3.3% CAGR through 2033, as chain kitchens, hotels and central production units expand in Asia and the Gulf and buy bulk pastry and frying fats in drums and bulk tankers. The implication is that demand is migrating steadily from the household kitchen to the commercial one, which favours suppliers with technical service teams and bulk logistics rather than brand marketing budgets.
By Distribution Channel: Industrial Supply Dominates as Online Grocery Takes Share
Industrial Direct Supply and Distributors accounted for 41% of trade in 2026, the leading channel, because bakery and food manufacturing customers contract annually in bulk and require consistent specifications and audited supply. Supermarkets and Hypermarkets hold 33%, the main retail route and the one where private label pressure is most severe. Convenience and Traditional Trade takes 21%, particularly important in Africa, Asia and Latin America where small tubs and sachets sell through independent shops. Online Retail is the fastest-growing channel at a 5.2% CAGR through 2033, from a small base, as grocery delivery platforms take a rising share of packaged food sales and as chilled delivery slots become routine. The implication is that the retail channel is restructuring faster than it is growing, so manufacturers are protecting margin through industrial contracts rather than through grocery listings.
Geography Analysis
North America Runs a Declining Spreads Shelf Beside Large Industrial Fat Demand
North America holds 20% share in 2026 and grows at just 0.6%, the slowest of the five regions. The United States and Canada both show long-running declines in household spread purchases, with butter and dairy blends taking shelf space and private label dominating what remains. The industrial side is stronger, supplying commercial bakeries, frozen dough producers and foodservice kitchens with shortenings and laminating fats. The determination by the US Food and Drug Administration that partially hydrogenated oils are not generally recognised as safe for use in food removed the historic structuring route and left interesterified and fractionated bases in its place. Soybean oil remains the dominant liquid phase. The main change under way is consolidation of industrial fat capacity rather than any recovery in retail volume.
Which Region Is Leading the Margarine Market?
Europe leads the margarine market with 31% share in 2026, because it has the deepest industrial bakery sector and the longest-established spreads category. Germany, the United Kingdom, France, the Netherlands, Poland and Spain account for most of the volume, and the region hosts much of the world’s interesterification and fractionation capacity. Regional growth of 1.3% is weak, since retail decline offsets industrial gains. Two instruments shape the market: the limit on industrially produced trans fat in food for the final consumer, and the European Union Deforestation Regulation, which brings palm oil within due diligence and traceability obligations. The combination makes documented sourcing a condition of supply. The clearest change is reformulation toward rapeseed and sunflower-based systems to reduce exposure to a single tropical oil.
Which Region Is Growing Fastest in the Margarine Market?
Asia Pacific is growing fastest at a 3.6% CAGR through 2033, from 28% share in 2026, driven by industrial bakery expansion and by rising spread consumption. India, China, Indonesia, Malaysia, Pakistan and Vietnam supply most of the growth, and Malaysia and Indonesia also host the palm refining capacity that feeds the global category. Packaged bread, biscuit and pastry manufacture is expanding quickly, and each new line is a contracted fat customer. Vanaspati and similar vegetable fat products remain a large parallel trade across the Indian subcontinent. The constraint is price sensitivity, which limits premium grades. The main structural change is investment in interesterification and fractionation plants close to the refineries, which shortens supply chains and keeps more processing value in the region.
Latin America Pairs Household Spreads With a Substantial Bakery Fat Trade
Latin America accounts for 12% share in 2026 and grows at 2.3%, led by Brazil, Mexico, Argentina and Colombia. The region combines a well-established household spreads habit with a large artisanal and industrial bakery sector that consumes shortenings and puff pastry fats in quantity. Brazil and Argentina supply much of their own soybean and sunflower oil, which gives local manufacturers a cost position that importers cannot match. The barriers are currency volatility on imported palm and specialty fats, inflation that squeezes retail pack pricing, and uneven ambient distribution in rural areas. Front-of-pack labelling rules adopted in several countries have made declared composition a visible formulation parameter. The opportunity sits in bakery fats for the expanding chain and in-store bakery trade.
Middle East & Africa Builds Spread Manufacture on Imported Refined Oils
Middle East & Africa holds 9% share in 2026 and grows at 3.1%, the second-fastest rate from the smallest base. Consumption concentrates in Nigeria, Egypt, South Africa, Saudi Arabia and the United Arab Emirates, where vegetable fat spreads and bakery fats are staples sold in tubs, tins and sachets. Almost all of the raw material is imported refined palm and sunflower oil, with local plants performing blending, crystallisation and filling. The barriers are heavy: foreign exchange availability for oil imports, tariff and port costs, ambient temperatures that demand high-stearin formulations, and thin cold chain infrastructure. The opportunity lies in local bakery fat manufacture, as packaged bread and biscuit production grows faster than household spread consumption across most of the region.
Competitive Landscape
The margarine market is moderately concentrated, and it is really two competitive arenas. In branded retail spreads, Upfield Holdings B.V. holds the largest international portfolio, competing against regional dairy groups and against retailer private label that now accounts for a substantial share of volume in several European grocery markets. In industrial and bakery fats the field is broader and dominated by oils and fats processors: Bunge Global SA, Cargill, Incorporated, Wilmar International Limited, AAK AB, Fuji Oil Holdings Inc. and Musim Mas Holdings Pte. Ltd. all compete on refining scale and formulation capability rather than on brand.
Competition in the industrial arena turns on technical performance and supply security. Buyers specify solid fat content at several temperatures, plasticity range, crystal form stability, melting behaviour and oxidative stability, and they audit the supplier’s ability to hold those values across crops and seasons. Traceability documentation has become a second qualifying condition, with certified and segregated palm supply, mill lists and geolocation data increasingly written into contracts. In retail, competition is far simpler and harder: shelf price, pack format and the relative price of butter.
Strategic activity concentrates on reformulation capability and feedstock position. Processors are adding enzymatic interesterification and fractionation capacity, building application bakeries where customers can run sheeting and baking trials, extending traceability systems back to mill and plantation level, and developing structuring systems that hold plasticity with less hard stock. Several integrated groups combine plantation, refining and specialty fat operations, which gives them a cost and documentation advantage over independent blenders.
Vendor strategy is converging on the industrial customer. Vandemoortele NV, Puratos Group and Ventura Foods, LLC illustrate the pattern, positioning around bakery and foodservice specification work rather than contesting a declining retail shelf.
Margarine Industry Leaders
- Upfield Holdings B.V.
- Bunge Global SA
- Cargill, Incorporated
- Wilmar International Limited
- AAK AB
Recent Industry Developments
- 2004: The Roundtable on Sustainable Palm Oil was established as a multi-stakeholder certification body – it created the market mechanism through which margarine manufacturers now evidence the origin of their structuring fats.
- June 2015: The US Food and Drug Administration issued its final determination that partially hydrogenated oils are not generally recognised as safe for use in human food, with compliance dates running through June 2018 – it ended the historic hydrogenation route to solid structure in the United States.
- May 2018: The World Health Organization launched the REPLACE action package, setting a global target to eliminate industrially produced trans fatty acids from the food supply and promoting a best-practice limit of 2% of total fat – it extended the same reformulation requirement into dozens of additional jurisdictions.
- April 2021: The European Union limit of 2 grams of industrially produced trans fat per 100 grams of fat became applicable to food intended for the final consumer – it set a single compositional ceiling across the region and obliged exporters into it to match.
- June 2023: The European Union Deforestation Regulation entered into force, bringing palm oil and its derivatives within due diligence and geolocation traceability obligations – it turned certified and traceable sourcing from a procurement preference into a market access condition.
Companies Covered in the Report
- Upfield Holdings B.V.
- Bunge Global SA
- Cargill, Incorporated
- Wilmar International Limited
- AAK AB
- Fuji Oil Holdings Inc.
- Vandemoortele NV
- Puratos Group
- Conagra Brands, Inc.
- Ventura Foods, LLC
- Richardson International Limited
- Musim Mas Holdings Pte. Ltd.
- Mewah International Inc.
Margarine Market Report Scope
This study covers water-in-oil emulsified fat spreads and industrial fats made from vegetable and marine oils, including retail tub and block margarine, bakery and industrial margarines, liquid and pumpable grades, and shortening and bakery fats sold alongside them. Butter, ghee and dairy spreads are competing products and are excluded, while blends are classified by their dominant component. The base year is 2025, with a 2026 to 2033 forecast in US$ Billion.
| Product Type | Retail Tub Margarine and Fat Spreads, Retail Block and Hard Margarine, Bakery and Industrial Margarine, Liquid and Pumpable Margarine, Shortening and Bakery Fats |
| Oil Base | Palm and Palm Kernel Oil, Soybean Oil, Rapeseed and Canola Oil, Sunflower Oil, Other Vegetable and Marine Oils |
| Fat Content Band | Full-Fat at 80% and Above, Three-Quarter-Fat at 60–62%, Half-Fat at 39–41%, Reduced-Fat Below 39% |
| Application | Bakery and Confectionery, Household Consumption, Processed Food Manufacturing, Foodservice and Restaurant |
| Distribution Channel | Industrial Direct Supply and Distributors, Supermarkets and Hypermarkets, Convenience and Traditional Trade, Online Retail |
| Regions | North America, Europe, Asia Pacific, Latin America, Middle East & Africa |
1. Executive Summary
1.1 Global Margarine Market Snapshot
1.2 Future Projections, 2026–2033
1.3 Key Industry Highlights
1.4 Regional Snapshot
2. Market Overview
2.1 Market Definition and Report Scope
2.2 Historical Market Trends
2.3 Market Dynamics
2.3.1 Drivers
2.3.1.1 Trans Fat Elimination Rules Rebuilt the Fat Base and Locked In Structuring Fats
2.3.1.2 Emerging-Market Spread Consumption Adds Volume Where Refrigeration Is Limited
2.3.2 Restraints
2.3.2.1 Long-Term Retail Decline and Butter Substitution Shrink the Spreads Shelf
2.3.2.2 Palm Traceability Obligations and Vegetable Oil Price Swings Raise Input Cost
2.3.3 Market Opportunities
2.3.3.1 Laminating and Puff Pastry Fats Open a Specification-Led Revenue Pool
2.3.3.2 Structuring Technology for Lower-Saturate Bases Creates a Reformulation Premium
3. Global Margarine Market Outlook, 2020–2033
3.1 Global Margarine Market Outlook, by Product Type, Value (US$ Billion), 2020–2033
3.1.1 Retail Tub Margarine and Fat Spreads
3.1.2 Retail Block and Hard Margarine
3.1.3 Bakery and Industrial Margarine
3.1.4 Liquid and Pumpable Margarine
3.1.5 Shortening and Bakery Fats
3.2 Global Margarine Market Outlook, by Oil Base, Value (US$ Billion), 2020–2033
3.2.1 Palm and Palm Kernel Oil
3.2.2 Soybean Oil
3.2.3 Rapeseed and Canola Oil
3.2.4 Sunflower Oil
3.2.5 Other Vegetable and Marine Oils
3.3 Global Margarine Market Outlook, by Fat Content Band, Value (US$ Billion), 2020–2033
3.3.1 Full-Fat at 80% and Above
3.3.2 Three-Quarter-Fat at 60–62%
3.3.3 Half-Fat at 39–41%
3.3.4 Reduced-Fat Below 39%
3.4 Global Margarine Market Outlook, by Application, Value (US$ Billion), 2020–2033
3.4.1 Bakery and Confectionery
3.4.2 Household Consumption
3.4.3 Processed Food Manufacturing
3.4.4 Foodservice and Restaurant
3.5 Global Margarine Market Outlook, by Distribution Channel, Value (US$ Billion), 2020–2033
3.5.1 Industrial Direct Supply and Distributors
3.5.2 Supermarkets and Hypermarkets
3.5.3 Convenience and Traditional Trade
3.5.4 Online Retail
3.6 Global Margarine Market Outlook, by Region, Value (US$ Billion), 2020–2033
3.6.1 North America
3.6.2 Europe
3.6.3 Asia Pacific
3.6.4 Latin America
3.6.5 Middle East & Africa
4. North America Margarine Market Outlook, 2020–2033
4.1 North America Margarine Market Outlook, by Product Type, Value (US$ Billion), 2020–2033
4.1.1 Retail Tub Margarine and Fat Spreads
4.1.2 Retail Block and Hard Margarine
4.1.3 Bakery and Industrial Margarine
4.1.4 Liquid and Pumpable Margarine
4.1.5 Shortening and Bakery Fats
4.2 North America Margarine Market Outlook, by Oil Base, Value (US$ Billion), 2020–2033
4.2.1 Palm and Palm Kernel Oil
4.2.2 Soybean Oil
4.2.3 Rapeseed and Canola Oil
4.2.4 Sunflower Oil
4.2.5 Other Vegetable and Marine Oils
4.3 North America Margarine Market Outlook, by Fat Content Band, Value (US$ Billion), 2020–2033
4.3.1 Full-Fat at 80% and Above
4.3.2 Three-Quarter-Fat at 60–62%
4.3.3 Half-Fat at 39–41%
4.3.4 Reduced-Fat Below 39%
4.4 North America Margarine Market Outlook, by Application, Value (US$ Billion), 2020–2033
4.4.1 Bakery and Confectionery
4.4.2 Household Consumption
4.4.3 Processed Food Manufacturing
4.4.4 Foodservice and Restaurant
4.5 North America Margarine Market Outlook, by Distribution Channel, Value (US$ Billion), 2020–2033
4.5.1 Industrial Direct Supply and Distributors
4.5.2 Supermarkets and Hypermarkets
4.5.3 Convenience and Traditional Trade
4.5.4 Online Retail
4.6 North America Margarine Market Outlook, by Country, Value (US$ Billion), 2020–2033
4.6.1 United States Margarine Market Outlook, by Product Type, 2020–2033
4.6.2 United States Margarine Market Outlook, by Oil Base, 2020–2033
4.6.3 United States Margarine Market Outlook, by Fat Content Band, 2020–2033
4.6.4 United States Margarine Market Outlook, by Application, 2020–2033
4.6.5 United States Margarine Market Outlook, by Distribution Channel, 2020–2033
4.6.6 Canada Margarine Market Outlook, by Product Type, 2020–2033
4.6.7 Canada Margarine Market Outlook, by Oil Base, 2020–2033
4.6.8 Canada Margarine Market Outlook, by Fat Content Band, 2020–2033
4.6.9 Canada Margarine Market Outlook, by Application, 2020–2033
4.6.10 Canada Margarine Market Outlook, by Distribution Channel, 2020–2033
5. Europe Margarine Market Outlook, 2020–2033
5.1 Europe Margarine Market Outlook, by Product Type, Value (US$ Billion), 2020–2033
5.1.1 Retail Tub Margarine and Fat Spreads
5.1.2 Retail Block and Hard Margarine
5.1.3 Bakery and Industrial Margarine
5.1.4 Liquid and Pumpable Margarine
5.1.5 Shortening and Bakery Fats
5.2 Europe Margarine Market Outlook, by Oil Base, Value (US$ Billion), 2020–2033
5.2.1 Palm and Palm Kernel Oil
5.2.2 Soybean Oil
5.2.3 Rapeseed and Canola Oil
5.2.4 Sunflower Oil
5.2.5 Other Vegetable and Marine Oils
5.3 Europe Margarine Market Outlook, by Fat Content Band, Value (US$ Billion), 2020–2033
5.3.1 Full-Fat at 80% and Above
5.3.2 Three-Quarter-Fat at 60–62%
5.3.3 Half-Fat at 39–41%
5.3.4 Reduced-Fat Below 39%
5.4 Europe Margarine Market Outlook, by Application, Value (US$ Billion), 2020–2033
5.4.1 Bakery and Confectionery
5.4.2 Household Consumption
5.4.3 Processed Food Manufacturing
5.4.4 Foodservice and Restaurant
5.5 Europe Margarine Market Outlook, by Distribution Channel, Value (US$ Billion), 2020–2033
5.5.1 Industrial Direct Supply and Distributors
5.5.2 Supermarkets and Hypermarkets
5.5.3 Convenience and Traditional Trade
5.5.4 Online Retail
5.6 Europe Margarine Market Outlook, by Country, Value (US$ Billion), 2020–2033
5.6.1 Germany Margarine Market Outlook, by Product Type, 2020–2033
5.6.2 Germany Margarine Market Outlook, by Oil Base, 2020–2033
5.6.3 Germany Margarine Market Outlook, by Fat Content Band, 2020–2033
5.6.4 Germany Margarine Market Outlook, by Application, 2020–2033
5.6.5 Germany Margarine Market Outlook, by Distribution Channel, 2020–2033
5.6.6 United Kingdom Margarine Market Outlook, by Product Type, 2020–2033
5.6.7 United Kingdom Margarine Market Outlook, by Oil Base, 2020–2033
5.6.8 United Kingdom Margarine Market Outlook, by Fat Content Band, 2020–2033
5.6.9 United Kingdom Margarine Market Outlook, by Application, 2020–2033
5.6.10 United Kingdom Margarine Market Outlook, by Distribution Channel, 2020–2033
5.6.11 France Margarine Market Outlook, by Product Type, 2020–2033
5.6.12 France Margarine Market Outlook, by Oil Base, 2020–2033
5.6.13 France Margarine Market Outlook, by Fat Content Band, 2020–2033
5.6.14 France Margarine Market Outlook, by Application, 2020–2033
5.6.15 France Margarine Market Outlook, by Distribution Channel, 2020–2033
5.6.16 Netherlands Margarine Market Outlook, by Product Type, 2020–2033
5.6.17 Netherlands Margarine Market Outlook, by Oil Base, 2020–2033
5.6.18 Netherlands Margarine Market Outlook, by Fat Content Band, 2020–2033
5.6.19 Netherlands Margarine Market Outlook, by Application, 2020–2033
5.6.20 Netherlands Margarine Market Outlook, by Distribution Channel, 2020–2033
5.6.21 Poland Margarine Market Outlook, by Product Type, 2020–2033
5.6.22 Poland Margarine Market Outlook, by Oil Base, 2020–2033
5.6.23 Poland Margarine Market Outlook, by Fat Content Band, 2020–2033
5.6.24 Poland Margarine Market Outlook, by Application, 2020–2033
5.6.25 Poland Margarine Market Outlook, by Distribution Channel, 2020–2033
5.6.26 Spain Margarine Market Outlook, by Product Type, 2020–2033
5.6.27 Spain Margarine Market Outlook, by Oil Base, 2020–2033
5.6.28 Spain Margarine Market Outlook, by Fat Content Band, 2020–2033
5.6.29 Spain Margarine Market Outlook, by Application, 2020–2033
5.6.30 Spain Margarine Market Outlook, by Distribution Channel, 2020–2033
6. Asia Pacific Margarine Market Outlook, 2020–2033
6.1 Asia Pacific Margarine Market Outlook, by Product Type, Value (US$ Billion), 2020–2033
6.1.1 Retail Tub Margarine and Fat Spreads
6.1.2 Retail Block and Hard Margarine
6.1.3 Bakery and Industrial Margarine
6.1.4 Liquid and Pumpable Margarine
6.1.5 Shortening and Bakery Fats
6.2 Asia Pacific Margarine Market Outlook, by Oil Base, Value (US$ Billion), 2020–2033
6.2.1 Palm and Palm Kernel Oil
6.2.2 Soybean Oil
6.2.3 Rapeseed and Canola Oil
6.2.4 Sunflower Oil
6.2.5 Other Vegetable and Marine Oils
6.3 Asia Pacific Margarine Market Outlook, by Fat Content Band, Value (US$ Billion), 2020–2033
6.3.1 Full-Fat at 80% and Above
6.3.2 Three-Quarter-Fat at 60–62%
6.3.3 Half-Fat at 39–41%
6.3.4 Reduced-Fat Below 39%
6.4 Asia Pacific Margarine Market Outlook, by Application, Value (US$ Billion), 2020–2033
6.4.1 Bakery and Confectionery
6.4.2 Household Consumption
6.4.3 Processed Food Manufacturing
6.4.4 Foodservice and Restaurant
6.5 Asia Pacific Margarine Market Outlook, by Distribution Channel, Value (US$ Billion), 2020–2033
6.5.1 Industrial Direct Supply and Distributors
6.5.2 Supermarkets and Hypermarkets
6.5.3 Convenience and Traditional Trade
6.5.4 Online Retail
6.6 Asia Pacific Margarine Market Outlook, by Country, Value (US$ Billion), 2020–2033
6.6.1 India Margarine Market Outlook, by Product Type, 2020–2033
6.6.2 India Margarine Market Outlook, by Oil Base, 2020–2033
6.6.3 India Margarine Market Outlook, by Fat Content Band, 2020–2033
6.6.4 India Margarine Market Outlook, by Application, 2020–2033
6.6.5 India Margarine Market Outlook, by Distribution Channel, 2020–2033
6.6.6 China Margarine Market Outlook, by Product Type, 2020–2033
6.6.7 China Margarine Market Outlook, by Oil Base, 2020–2033
6.6.8 China Margarine Market Outlook, by Fat Content Band, 2020–2033
6.6.9 China Margarine Market Outlook, by Application, 2020–2033
6.6.10 China Margarine Market Outlook, by Distribution Channel, 2020–2033
6.6.11 Indonesia Margarine Market Outlook, by Product Type, 2020–2033
6.6.12 Indonesia Margarine Market Outlook, by Oil Base, 2020–2033
6.6.13 Indonesia Margarine Market Outlook, by Fat Content Band, 2020–2033
6.6.14 Indonesia Margarine Market Outlook, by Application, 2020–2033
6.6.15 Indonesia Margarine Market Outlook, by Distribution Channel, 2020–2033
6.6.16 Malaysia Margarine Market Outlook, by Product Type, 2020–2033
6.6.17 Malaysia Margarine Market Outlook, by Oil Base, 2020–2033
6.6.18 Malaysia Margarine Market Outlook, by Fat Content Band, 2020–2033
6.6.19 Malaysia Margarine Market Outlook, by Application, 2020–2033
6.6.20 Malaysia Margarine Market Outlook, by Distribution Channel, 2020–2033
6.6.21 Pakistan Margarine Market Outlook, by Product Type, 2020–2033
6.6.22 Pakistan Margarine Market Outlook, by Oil Base, 2020–2033
6.6.23 Pakistan Margarine Market Outlook, by Fat Content Band, 2020–2033
6.6.24 Pakistan Margarine Market Outlook, by Application, 2020–2033
6.6.25 Pakistan Margarine Market Outlook, by Distribution Channel, 2020–2033
6.6.26 Vietnam Margarine Market Outlook, by Product Type, 2020–2033
6.6.27 Vietnam Margarine Market Outlook, by Oil Base, 2020–2033
6.6.28 Vietnam Margarine Market Outlook, by Fat Content Band, 2020–2033
6.6.29 Vietnam Margarine Market Outlook, by Application, 2020–2033
6.6.30 Vietnam Margarine Market Outlook, by Distribution Channel, 2020–2033
7. Latin America Margarine Market Outlook, 2020–2033
7.1 Latin America Margarine Market Outlook, by Product Type, Value (US$ Billion), 2020–2033
7.1.1 Retail Tub Margarine and Fat Spreads
7.1.2 Retail Block and Hard Margarine
7.1.3 Bakery and Industrial Margarine
7.1.4 Liquid and Pumpable Margarine
7.1.5 Shortening and Bakery Fats
7.2 Latin America Margarine Market Outlook, by Oil Base, Value (US$ Billion), 2020–2033
7.2.1 Palm and Palm Kernel Oil
7.2.2 Soybean Oil
7.2.3 Rapeseed and Canola Oil
7.2.4 Sunflower Oil
7.2.5 Other Vegetable and Marine Oils
7.3 Latin America Margarine Market Outlook, by Fat Content Band, Value (US$ Billion), 2020–2033
7.3.1 Full-Fat at 80% and Above
7.3.2 Three-Quarter-Fat at 60–62%
7.3.3 Half-Fat at 39–41%
7.3.4 Reduced-Fat Below 39%
7.4 Latin America Margarine Market Outlook, by Application, Value (US$ Billion), 2020–2033
7.4.1 Bakery and Confectionery
7.4.2 Household Consumption
7.4.3 Processed Food Manufacturing
7.4.4 Foodservice and Restaurant
7.5 Latin America Margarine Market Outlook, by Distribution Channel, Value (US$ Billion), 2020–2033
7.5.1 Industrial Direct Supply and Distributors
7.5.2 Supermarkets and Hypermarkets
7.5.3 Convenience and Traditional Trade
7.5.4 Online Retail
7.6 Latin America Margarine Market Outlook, by Country, Value (US$ Billion), 2020–2033
7.6.1 Brazil Margarine Market Outlook, by Product Type, 2020–2033
7.6.2 Brazil Margarine Market Outlook, by Oil Base, 2020–2033
7.6.3 Brazil Margarine Market Outlook, by Fat Content Band, 2020–2033
7.6.4 Brazil Margarine Market Outlook, by Application, 2020–2033
7.6.5 Brazil Margarine Market Outlook, by Distribution Channel, 2020–2033
7.6.6 Mexico Margarine Market Outlook, by Product Type, 2020–2033
7.6.7 Mexico Margarine Market Outlook, by Oil Base, 2020–2033
7.6.8 Mexico Margarine Market Outlook, by Fat Content Band, 2020–2033
7.6.9 Mexico Margarine Market Outlook, by Application, 2020–2033
7.6.10 Mexico Margarine Market Outlook, by Distribution Channel, 2020–2033
7.6.11 Argentina Margarine Market Outlook, by Product Type, 2020–2033
7.6.12 Argentina Margarine Market Outlook, by Oil Base, 2020–2033
7.6.13 Argentina Margarine Market Outlook, by Fat Content Band, 2020–2033
7.6.14 Argentina Margarine Market Outlook, by Application, 2020–2033
7.6.15 Argentina Margarine Market Outlook, by Distribution Channel, 2020–2033
7.6.16 Colombia Margarine Market Outlook, by Product Type, 2020–2033
7.6.17 Colombia Margarine Market Outlook, by Oil Base, 2020–2033
7.6.18 Colombia Margarine Market Outlook, by Fat Content Band, 2020–2033
7.6.19 Colombia Margarine Market Outlook, by Application, 2020–2033
7.6.20 Colombia Margarine Market Outlook, by Distribution Channel, 2020–2033
8. Middle East & Africa Margarine Market Outlook, 2020–2033
8.1 Middle East & Africa Margarine Market Outlook, by Product Type, Value (US$ Billion), 2020–2033
8.1.1 Retail Tub Margarine and Fat Spreads
8.1.2 Retail Block and Hard Margarine
8.1.3 Bakery and Industrial Margarine
8.1.4 Liquid and Pumpable Margarine
8.1.5 Shortening and Bakery Fats
8.2 Middle East & Africa Margarine Market Outlook, by Oil Base, Value (US$ Billion), 2020–2033
8.2.1 Palm and Palm Kernel Oil
8.2.2 Soybean Oil
8.2.3 Rapeseed and Canola Oil
8.2.4 Sunflower Oil
8.2.5 Other Vegetable and Marine Oils
8.3 Middle East & Africa Margarine Market Outlook, by Fat Content Band, Value (US$ Billion), 2020–2033
8.3.1 Full-Fat at 80% and Above
8.3.2 Three-Quarter-Fat at 60–62%
8.3.3 Half-Fat at 39–41%
8.3.4 Reduced-Fat Below 39%
8.4 Middle East & Africa Margarine Market Outlook, by Application, Value (US$ Billion), 2020–2033
8.4.1 Bakery and Confectionery
8.4.2 Household Consumption
8.4.3 Processed Food Manufacturing
8.4.4 Foodservice and Restaurant
8.5 Middle East & Africa Margarine Market Outlook, by Distribution Channel, Value (US$ Billion), 2020–2033
8.5.1 Industrial Direct Supply and Distributors
8.5.2 Supermarkets and Hypermarkets
8.5.3 Convenience and Traditional Trade
8.5.4 Online Retail
8.6 Middle East & Africa Margarine Market Outlook, by Country, Value (US$ Billion), 2020–2033
8.6.1 Nigeria Margarine Market Outlook, by Product Type, 2020–2033
8.6.2 Nigeria Margarine Market Outlook, by Oil Base, 2020–2033
8.6.3 Nigeria Margarine Market Outlook, by Fat Content Band, 2020–2033
8.6.4 Nigeria Margarine Market Outlook, by Application, 2020–2033
8.6.5 Nigeria Margarine Market Outlook, by Distribution Channel, 2020–2033
8.6.6 Egypt Margarine Market Outlook, by Product Type, 2020–2033
8.6.7 Egypt Margarine Market Outlook, by Oil Base, 2020–2033
8.6.8 Egypt Margarine Market Outlook, by Fat Content Band, 2020–2033
8.6.9 Egypt Margarine Market Outlook, by Application, 2020–2033
8.6.10 Egypt Margarine Market Outlook, by Distribution Channel, 2020–2033
8.6.11 South Africa Margarine Market Outlook, by Product Type, 2020–2033
8.6.12 South Africa Margarine Market Outlook, by Oil Base, 2020–2033
8.6.13 South Africa Margarine Market Outlook, by Fat Content Band, 2020–2033
8.6.14 South Africa Margarine Market Outlook, by Application, 2020–2033
8.6.15 South Africa Margarine Market Outlook, by Distribution Channel, 2020–2033
8.6.16 Saudi Arabia Margarine Market Outlook, by Product Type, 2020–2033
8.6.17 Saudi Arabia Margarine Market Outlook, by Oil Base, 2020–2033
8.6.18 Saudi Arabia Margarine Market Outlook, by Fat Content Band, 2020–2033
8.6.19 Saudi Arabia Margarine Market Outlook, by Application, 2020–2033
8.6.20 Saudi Arabia Margarine Market Outlook, by Distribution Channel, 2020–2033
8.6.21 United Arab Emirates Margarine Market Outlook, by Product Type, 2020–2033
8.6.22 United Arab Emirates Margarine Market Outlook, by Oil Base, 2020–2033
8.6.23 United Arab Emirates Margarine Market Outlook, by Fat Content Band, 2020–2033
8.6.24 United Arab Emirates Margarine Market Outlook, by Application, 2020–2033
8.6.25 United Arab Emirates Margarine Market Outlook, by Distribution Channel, 2020–2033
9. Competitive Landscape
9.1 Industry Leaders
9.2 Recent Industry Developments
9.3 Company Profiles
9.3.1 Upfield Holdings B.V.
9.3.2 Bunge Global SA
9.3.3 Cargill, Incorporated
9.3.4 Wilmar International Limited
9.3.5 AAK AB
9.3.6 Fuji Oil Holdings Inc.
9.3.7 Vandemoortele NV
9.3.8 Puratos Group
9.3.9 Conagra Brands, Inc.
9.3.10 Ventura Foods, LLC
9.3.11 Richardson International Limited
9.3.12 Musim Mas Holdings Pte. Ltd.
9.3.13 Mewah International Inc.
10. Appendix
10.1 Research Methodology
10.2 Report Assumptions
10.3 Acronyms and Abbreviations
| Product Type | Retail Tub Margarine and Fat Spreads, Retail Block and Hard Margarine, Bakery and Industrial Margarine, Liquid and Pumpable Margarine, Shortening and Bakery Fats |
| Oil Base | Palm and Palm Kernel Oil, Soybean Oil, Rapeseed and Canola Oil, Sunflower Oil, Other Vegetable and Marine Oils |
| Fat Content Band | Full-Fat at 80% and Above, Three-Quarter-Fat at 60–62%, Half-Fat at 39–41%, Reduced-Fat Below 39% |
| Application | Bakery and Confectionery, Household Consumption, Processed Food Manufacturing, Foodservice and Restaurant |
| Distribution Channel | Industrial Direct Supply and Distributors, Supermarkets and Hypermarkets, Convenience and Traditional Trade, Online Retail |
| Regions | North America, Europe, Asia Pacific, Latin America, Middle East & Africa |
Our Research Methodology
Considering the volatility of business today, traditional approaches to strategizing a game plan can be unfruitful if not detrimental. True ambiguity is no way to determine a forecast. A myriad of predetermined factors must be accounted for such as the degree of risk involved, the magnitude of circumstances, as well as conditions or consequences that are not known or unpredictable. To circumvent binary views that cast uncertainty, the application of market research intelligence to strategically posture, move, and enable actionable outcomes is necessary.
View Methodology
Quality Assured
Rigorous Validation Process

Confidentiality Assured
End-to-end Data Security

Custom Research Services
Tailored To Your Objectives
FAQs
The market is valued at US$ 23.5 billion in 2026, covering retail spreads, bakery and industrial margarines, liquid grades and associated shortenings.
The market is projected to reach US$ 27.0 billion by 2033, a 2.0% CAGR and an absolute dollar opportunity of US$ 3.5 billion.
Bakery and Confectionery leads with 39% share in 2026, because industrial and craft bakeries consume laminating, cake and cream fats in large contracted volumes.
Asia Pacific grows fastest at a 3.6% CAGR through 2033, driven by industrial bakery expansion and widening packaged spread consumption.
Concentration is medium: branded retail is led by a few groups, while industrial fats are supplied by large oils and fats processors.
Related Reports
Low Fat Cheese Market Size, Share, Insights, Competitive Landscape, and Forecast 2026 to 2033
The global low fat cheese market is valued at US$6.8 billion in 2026, reaching US$9.2 billion by 2033, growing at a 4.4% CAGR
Instant Beverage Premix Market Size, Share, Insights, Competitive Landscape, and Forecast 2026 to 2033
The global instant beverage premix market is valued at US$24.0 billion in 2026, reaching US$36.5 billion by 2033, growing at a 6.2% CAGR
Infant Nutrition Market Size, Share, Insights, Competitive Landscape, and Forecast 2026 to 2033
The global infant nutrition market is valued at US$103.18 billion in 2026, reaching US$153.09 billion by 2033, growing at a 5.8% CAGR
Yeast Protein Market Size, Share, Insights, Competitive Landscape, and Forecast 2026 to 2033
The global yeast protein market is valued at US$0.9 billion in 2026, reaching US$2.0 billion by 2033, growing at a 12.1% CAGR
Starch Derivatives Market Size, Share, Insights, Competitive Landscape, and Forecast 2026 to 2033
The global starch derivatives market is valued at US$62.5 billion in 2026, reaching US$88.0 billion by 2033, growing at a 5.0% CAGR
Quick Service Restaurants Market Size, Share, Insights, Competitive Landscape, and Forecast 2026 to 2033
The global quick service restaurants market is valued at US$1,090.0 billion in 2026, reaching US$1,556.0 billion by 2033, growing at a 5.2% CAGR