



Medical Marijuana Market
Medical Marijuana Market Size, Share, Insights, Competitive Landscape, and Forecast 2026 to 2033
Report Overview
Medical Marijuana Market Size and Trend Analysis
How Fast Will the Medical Marijuana Market Grow?
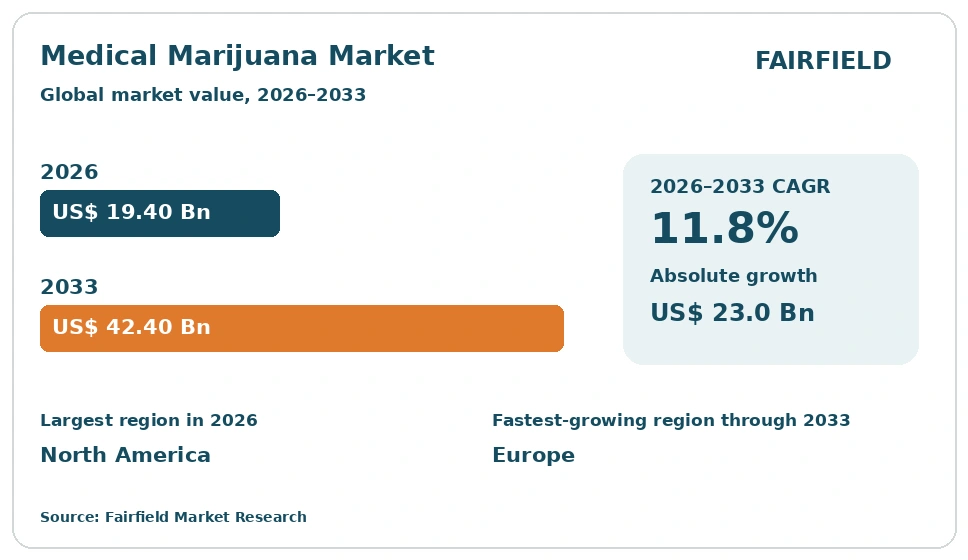
The global Medical Marijuana market size is expected to be valued at US$ 19.4 billion in 2026 and projected to reach US$ 42.4 billion by 2033, growing at a CAGR of 11.8% between 2026 and 2033. Growth reflects the steady widening of medical authorisation frameworks across national and sub-national regimes, which converts previously unserved demand into regulated, measurable commercial volume. Licensed producers are also shifting output toward standardised, pharmacy-ready formats, which supports higher realised prices and broader acceptance among prescribers and institutional buyers. The absolute dollar opportunity over the forecast period stands at US$ 23.0 billion, with regulatory design rather than clinical demand alone remaining the principal determinant of how quickly each national market converts.
Key Report Takeaways
- By Product Form: Dried flower led with 41.6% share in 2026, while oils and extracts are projected to expand at a 13.6% CAGR through 2033, driven by pharmacy dispensing rules that favour measured, standardised liquid formats.
- By Cannabinoid Profile: THC-dominant products led with 46.3% share in 2026, while balanced THC-to-CBD formulations are set to grow at a 13.9% CAGR through 2033, supported by prescriber preference for predictable, ratio-defined compositions.
- By Distribution Channel: Licensed dispensaries held 52.4% share in 2026, while pharmacies are projected to advance at a 14.2% CAGR through 2033, reflecting regimes that route authorised supply through existing pharmaceutical wholesale and dispensing infrastructure.
- By End User: Adult patients aged 18 to 64 accounted for 58.7% share in 2026, while patients aged 65 and above are expected to record a 13.7% CAGR through 2033, as ageing populations enter authorised care pathways.
- By Region: North America led with 48.2% share in 2026, while Europe is projected to post a 15.9% CAGR through 2033, as national reimbursement debates and pharmacy-based supply models move from pilot status toward routine operation.
Market Trends and Insights
Market Growth Drivers
Expanding Medical Authorisation Frameworks Widen the Addressable Patient Base
Each jurisdiction that establishes a medical authorisation framework converts informal demand into regulated, invoiced volume. That conversion is the single largest source of new revenue in this market. Where a regime defines eligible authorised use categories, sets prescriber criteria and licenses supply, patient registration rises in a measurable way. Suppliers can then plan production against documented demand rather than speculative forecasts, which lowers working capital risk.
The underlying trend is administrative rather than promotional. Regulators in several regions have moved from narrow pilot schemes toward standing programmes with defined product specifications, record-keeping duties and audit requirements. Agencies such as Health Canada and the European Medicines Agency operate within mandates that shape how authorised products are classified and supervised. Licensed producers respond by investing in quality systems, traceability and documentation capability rather than in consumer marketing.
Pharmacy Channel Integration Brings Scale and Standardisation
Routing authorised supply through pharmacies lifts demand by removing a practical barrier for patients and prescribers. Pharmacy networks already carry the cold-chain, record-keeping and dispensing controls that regulators expect, so onboarding cost per outlet is low. Each pharmacy added extends reach into communities where no dispensary exists, which broadens the geographic base of the market. Channel economics improve too, because wholesale distribution consolidates many small orders into predictable bulk movements.
Behind this sits a production shift toward pharmaceutical-grade manufacturing practice. Licensed producers are building facilities designed around batch consistency, stability testing and documented cannabinoid content, since pharmacy systems will not stock material that cannot be specified on a label. Standardised oils, capsules and measured-dose formats suit that requirement better than variable herbal material. The result is a migration of value from bulk supply toward formulated products with verifiable specifications.
Restraints Impact Analysis of Market
Divergent Legal Regimes Limit Cross-Border Scale
Legal status varies sharply between jurisdictions, and that variation caps how large any single operator can become. A product authorised in one country may have no lawful route to market in a neighbouring one. Suppliers must build separate licensing, labelling and quality dossiers for each territory they serve, which multiplies fixed cost without multiplying volume. Growth becomes a sequence of small national projects rather than one scalable programme.
The constraint is structural, not temporary. International control conventions, national criminal law and medicines law interact differently in each territory, so even similar regimes diverge on permitted forms, cannabinoid thresholds and import rules. Import and export permits are issued case by case, limiting the pooling of production across borders. Operators respond by holding capacity in several locations or partnering with local licence holders, which dilutes the margin advantage of scale.
Limited Reimbursement Keeps Costs With the Patient
In most regimes authorised cannabis products sit outside routine public or private reimbursement, so patients pay directly. That places a hard ceiling on volume, because demand becomes sensitive to household income rather than to clinical authorisation alone. Patients who qualify may still discontinue when monthly outlay competes with other spending. Operators see high registration numbers paired with weak repeat purchase rates, which lowers revenue per authorised patient.
Reimbursement decisions rest on evidence standards that this category is still building. Payers require controlled trial data, health economic modelling and a defined comparator before listing a product, and most authorised cannabis supply has not been developed along that path. Products that completed formal regulatory review sit in a different category from those supplied under national access schemes. Until the evidence base broadens, coverage stays selective, and pricing pressure falls on producers rather than public budgets.
Market Opportunities
Pharmaceutical-Grade Standardisation Opens Institutional Demand
Standardised, specification-controlled products create a revenue stream that herbal supply cannot reach. Hospitals, specialist clinics and research institutions buy only against documented composition, stability and batch traceability. Suppliers meeting those requirements gain tender-based purchasing, which carries larger orders and longer contract terms than retail dispensing. Margins also differ, since institutional buyers pay for assurance and continuity rather than the lowest unit price.
Capability is the gating factor. Building this business requires analytical laboratories, validated manufacturing processes, documented supply chains and staff trained in regulated production. A small number of operators have pursued formal medicines approval through bodies such as the U.S. Food and Drug Administration and the European Medicines Agency, and that route sets the reference standard others are measured against. Investment is moving toward formulation science, delivery formats and quality infrastructure rather than raw growing capacity.
Export-Oriented Licensed Production Hubs Reshape Supply Economics
Jurisdictions that permit licensed cultivation for export create a second business model alongside domestic supply. Producers in lower-cost climates serve importing markets at delivered costs that indoor facilities in high-wage countries struggle to match. For importing markets, this widens available supply and eases the capital burden of building domestic capacity. For exporting economies, it turns a regulated agricultural activity into a tradable output with foreign exchange value.
Realising the opportunity depends on meeting importing-market standards, not on cost alone. Export-oriented producers must hold certifications recognised by destination regulators, maintain testing regimes aligned to foreign pharmacopoeial requirements, and secure permits for each shipment. Those able to clear the bar become contract suppliers to brand owners and pharmacy wholesalers in regulated markets. The pattern mirrors earlier shifts in generic medicines manufacturing, where production concentrated where cost advantage met auditable quality systems.
Category-wise Insights
Which Product Form Accounts for the Largest Share?
Dried flower holds the largest position, at 41.6% of the Medical Marijuana market in 2026. Its lead rests on regimes that authorised herbal material first and on lower processing cost per gram, which keeps prices accessible where reimbursement is absent. Oils and extracts, at 32.8% in 2026, are the growth leader, expanding at a 13.6% CAGR between 2026 and 2033. That gap reflects a channel shift rather than a change in preference. Pharmacy and institutional buyers require declared cannabinoid content, batch stability data and tamper-evident packaging, which liquid and encapsulated formats satisfy more easily than variable plant material. Capsules and tablets, at 11.5% in 2026, follow the same logic. The implication is a transfer of value toward manufacturers holding formulation and quality-assurance capability, away from operators competing on cultivation cost.
THC-Dominant Supply Leads While Balanced Ratios Gain Ground
THC-dominant products account for 46.3% of 2026 revenue, the largest share of any cannabinoid profile. That position follows from programme design: most early regimes authorised high-THC material for a narrow set of approved use categories, and supply chains were built around it. Balanced THC-to-CBD formulations, at 17.4% in 2026, are the fastest-growing profile, at a 13.9% CAGR to 2033. Prescribers in formal programmes favour defined ratios because they can be specified, documented and repeated across refills, which matters where pharmacists dispense to a written authorisation. CBD-dominant products hold 30.1% in 2026, supported by regimes that permit them under lighter controls. Minor cannabinoid formulations remain small at 6.2% but attract development spending. The signal is that composition is becoming a specification rather than a varietal description, favouring producers with analytical depth.
Dispensaries Hold Volume While Pharmacies Set the Growth Pace
Licensed dispensaries control 52.4% of 2026 sales, the largest channel share, because the biggest national and sub-national programmes were built around dedicated retail outlets rather than existing pharmacy networks. Pharmacies, with 24.6% in 2026, are growing fastest, at a 14.2% CAGR through 2033. The difference is regulatory architecture. Regimes classifying authorised cannabis as a prescription medicine route it through pharmaceutical wholesalers and community pharmacies, which already hold controlled-substance storage, dispensing records and professional oversight. That lowers incremental cost per outlet and extends coverage into rural areas. Licensed online and mail-order platforms hold 14.8% in 2026, serving patients where physical access is limited. Hospital and specialty clinic purchasing accounts for 8.2%. Channel mix matters because pharmacy supply demands different packaging, documentation and wholesale terms than dispensary retail, reshaping who holds the customer relationship.
Adult Patients Anchor Volume as Older Cohorts Expand Fastest
Adults aged 18 to 64 generate 58.7% of 2026 revenue, the largest end-user group, reflecting population size and the authorised use categories most commonly written into programme rules. Patients aged 65 and above, at 27.4% in 2026, are the fastest-growing cohort, at a 13.7% CAGR to 2033. Demographic ageing explains part of it, programme design the rest: several regimes have widened eligibility in ways that bring older patients into formal pathways, and this group leans on pharmacy channels and non-inhaled formats. Pediatric and adolescent use remains tightly restricted under specialist authorisation and accounts for 8.3% in 2026. Research and clinical institutions hold 5.6%, small in revenue but important as a source of evidence. The shift toward older patients favours oral and topical formats, clear labelling and pharmacy-compatible packaging.
Geography Analysis
Which Region Is Leading the Medical Marijuana Market?
North America leads the Medical Marijuana market with 48.2% share in 2026, growing at a 9.2% CAGR to 2033. The United States contributes most of that volume through state-level medical programmes, while Canada operates a federal framework administered by Health Canada. Scale comes from early programme establishment, a large licensed cultivation base and dense dispensary networks in populous states. Growth runs slower than elsewhere because the largest programmes are mature, and adult-use channels in several states absorb demand that would otherwise sit in medical supply. Price compression from oversupply has also weighed on revenue per gram. Investment is shifting toward processing capacity, branded formulated products and retail efficiency rather than new cultivation.
Which Region Is Growing Fastest in the Medical Marijuana Market?
Europe is the fastest-growing region, advancing at a 15.9% CAGR between 2026 and 2033 from 26.5% share in 2026. Germany is the largest national market, supported by a pharmacy-based supply model and an established pharmaceutical wholesale system. Further volume comes from the United Kingdom, Poland, Italy, Portugal and the Czech Republic, where national access frameworks sit within medicines law. Three factors drive the pace. Pharmacy dispensing scales faster than purpose-built retail, because the infrastructure already exists. National health systems have begun examining coverage questions, which changes affordability. And European good manufacturing practice standards push suppliers toward documented quality, widening the pool of products that regulators will accept.
Regulated Access Programmes Define Asia Pacific Demand
Asia Pacific holds 11.3% share in 2026 and is expanding at a 14.2% CAGR to 2033. Australia accounts for the largest portion, operating a prescriber-access pathway supervised by its national medicines authority alongside a licensed domestic cultivation base. New Zealand and Thailand also host formal access frameworks, while several of the region’s largest economies maintain prohibition and sit outside the addressable market. Growth is driven by programme formalisation rather than by population size: as access schemes convert into standing frameworks, prescriber numbers and authorised product listings rise. Regulatory caution keeps the base small, so a high percentage growth rate rests on a limited starting point.
Export-Oriented Production Shapes Latin American Participation
Latin America holds 8.4% share in 2026, growing at a 12.8% CAGR to 2033. Colombia, Uruguay, Mexico, Argentina and Brazil are the main contributors, though their roles differ. Colombia and Uruguay built licensing systems with export in mind, using favourable growing conditions and lower production cost to supply regulated importers elsewhere. Brazil’s demand has developed largely through recognised patient access routes and regulated import authorisations, which supports a sizeable patient base served by imported finished products. Argentina and Mexico operate frameworks permitting defined authorised access. Domestic consumption stays limited by income levels and the absence of reimbursement, so regional revenue leans toward production and export value rather than local retail.
Export Certification Anchors Middle East & Africa
Middle East & Africa accounts for 5.6% share in 2026, expanding at a 12.0% CAGR to 2033, the smallest regional base. Israel provides most of the value, combining a long-running national access programme with research institutions and a licensed production sector serving domestic patients and export partners. In Africa, Lesotho, Zimbabwe, South Africa and Morocco have established licensing routes aimed mainly at cultivation and extract production for export, using climate advantage and lower operating costs. Much of the Gulf maintains strict prohibition, which removes a wealthy consumer base from the addressable market. Growth rests on export certification rather than domestic dispensing, so capital is going into greenhouse capacity, analytical laboratories and compliance systems that importing regulators recognise.
Competitive Landscape
The Medical Marijuana market is moderately fragmented. A small group of multi-jurisdiction producers holds meaningful share across several regulated markets, while national operators dominate single territories where licensing rules favour domestic supply. Consolidation has been uneven. Rounds of merger activity have produced larger balance sheets without producing a globally dominant supplier, because licences do not travel across borders. Vendor positioning now splits between vertically integrated retail operators and export-focused producers selling into other companies’ brands.
Competition turns on compliance capability more than on product novelty. Vendors differentiate through good manufacturing practice certification, analytical testing depth, batch consistency, pharmacy-compliant packaging, and the documentation needed to clear import review. Cost per gram still matters in commoditised herbal supply, but carries less weight in formulated products. New entrants arrive from two directions: pharmaceutical formulators bringing delivery technology, and low-cost agricultural producers in export-licensed jurisdictions. Both pressure incumbents that rely on domestic cultivation economics alone.
Strategic activity clusters around a few themes. Producers acquire or partner with licence holders in target countries, often the only practical way into a market whose permits are nationally issued. Capacity investment has moved from cultivation toward extraction, formulation and quality laboratories. Several operators have pursued formal medicines review pathways, which creates a defensible position that cultivation scale cannot replicate.
The direction is toward specialisation. Companies are choosing between operating regulated retail at scale, supplying standardised product to pharmacy and institutional buyers, or producing certified bulk material for export. Those strategies demand different assets, and firms attempting all three face capital strain. Regulatory capability, rather than brand strength, increasingly determines which operators sustain multi-market positions.
Industry Leaders
- Tilray Brands, Inc.
- Canopy Growth Corporation
- Aurora Cannabis Inc.
- Jazz Pharmaceuticals plc
- Curaleaf Holdings, Inc.
- Bedrocan International B.V.
Companies Covered in the Report
- Tilray Brands, Inc.
- Canopy Growth Corporation
- Aurora Cannabis Inc.
- Jazz Pharmaceuticals plc
- Curaleaf Holdings, Inc.
- Trulieve Cannabis Corp.
- Green Thumb Industries Inc.
- Cresco Labs Inc.
- Verano Holdings Corp.
- Cronos Group Inc.
- Organigram Holdings Inc.
- Bedrocan International B.V.
- Little Green Pharma Ltd
- Clever Leaves Holdings Inc.
- Khiron Life Sciences Corp.
Medical Marijuana Market Report Scope
The Medical Marijuana market is segmented by product form, cannabinoid profile, distribution channel, end user and region.
| By Product Form | Dried Flower, Oils and Extracts, Capsules and Tablets, Topicals, Others |
| By Cannabinoid Profile | THC-Dominant, CBD-Dominant, Balanced THC-to-CBD, Minor Cannabinoid Formulations |
| By Distribution Channel | Licensed Dispensaries, Pharmacies, Licensed Online and Mail-Order Platforms, Hospitals and Specialty Clinics |
| By End User | Adult Patients (18 to 64 Years), Geriatric Patients (65 Years and Above), Pediatric and Adolescent Patients, Research and Clinical Institutions |
| By Region | North America, Europe, Asia Pacific, Latin America, Middle East & Africa |
1. Executive Summary
1.1 Medical Marijuana Market Snapshot
1.2 Future Projections
1.3 Key Industry Highlights
1.4 Geographical Snapshot
2. Market Overview
2.1 Market Definition and Segmentation
2.2 Market Dynamics
2.2.1 Drivers
2.2.2 Restraints
2.2.3 Market Opportunities
3. Global Medical Marijuana Market Outlook, 2026–2033
3.1 Global Medical Marijuana Market Outlook, by Product Form, Value (US$ Billion), 2026–2033
3.1.1 Dried Flower
3.1.2 Oils and Extracts
3.1.3 Capsules and Tablets
3.1.4 Topicals
3.1.5 Others
3.2 Global Medical Marijuana Market Outlook, by Cannabinoid Profile, Value (US$ Billion), 2026–2033
3.2.1 THC-Dominant
3.2.2 CBD-Dominant
3.2.3 Balanced THC-to-CBD
3.2.4 Minor Cannabinoid Formulations
3.3 Global Medical Marijuana Market Outlook, by Distribution Channel, Value (US$ Billion), 2026–2033
3.3.1 Licensed Dispensaries
3.3.2 Pharmacies
3.3.3 Licensed Online and Mail-Order Platforms
3.3.4 Hospitals and Specialty Clinics
3.4 Global Medical Marijuana Market Outlook, by End User, Value (US$ Billion), 2026–2033
3.4.1 Adult Patients (18 to 64 Years)
3.4.2 Geriatric Patients (65 Years and Above)
3.4.3 Pediatric and Adolescent Patients
3.4.4 Research and Clinical Institutions
3.5 Global Medical Marijuana Market Outlook, by Region, Value (US$ Billion), 2026–2033
3.5.1 North America
3.5.2 Europe
3.5.3 Asia Pacific
3.5.4 Latin America
3.5.5 Middle East & Africa
4. North America Medical Marijuana Market Outlook, 2026–2033
4.1 North America Medical Marijuana Market Outlook, by Product Form, Value (US$ Billion), 2026–2033
4.1.1 Dried Flower
4.1.2 Oils and Extracts
4.1.3 Capsules and Tablets
4.1.4 Topicals
4.1.5 Others
4.2 North America Medical Marijuana Market Outlook, by Cannabinoid Profile, Value (US$ Billion), 2026–2033
4.2.1 THC-Dominant
4.2.2 CBD-Dominant
4.2.3 Balanced THC-to-CBD
4.2.4 Minor Cannabinoid Formulations
4.3 North America Medical Marijuana Market Outlook, by Distribution Channel, Value (US$ Billion), 2026–2033
4.3.1 Licensed Dispensaries
4.3.2 Pharmacies
4.3.3 Licensed Online and Mail-Order Platforms
4.3.4 Hospitals and Specialty Clinics
4.4 North America Medical Marijuana Market Outlook, by End User, Value (US$ Billion), 2026–2033
4.4.1 Adult Patients (18 to 64 Years)
4.4.2 Geriatric Patients (65 Years and Above)
4.4.3 Pediatric and Adolescent Patients
4.4.4 Research and Clinical Institutions
4.5 North America Medical Marijuana Market Outlook, by Country, Value (US$ Billion), 2026–2033
4.5.1 United States Medical Marijuana Market Outlook, by Product Form, 2026–2033
4.5.2 United States Medical Marijuana Market Outlook, by Cannabinoid Profile, 2026–2033
4.5.3 United States Medical Marijuana Market Outlook, by Distribution Channel, 2026–2033
4.5.4 United States Medical Marijuana Market Outlook, by End User, 2026–2033
4.5.5 Canada Medical Marijuana Market Outlook, by Product Form, 2026–2033
4.5.6 Canada Medical Marijuana Market Outlook, by Cannabinoid Profile, 2026–2033
4.5.7 Canada Medical Marijuana Market Outlook, by Distribution Channel, 2026–2033
4.5.8 Canada Medical Marijuana Market Outlook, by End User, 2026–2033
5. Europe Medical Marijuana Market Outlook, 2026–2033
5.1 Europe Medical Marijuana Market Outlook, by Product Form, Value (US$ Billion), 2026–2033
5.1.1 Dried Flower
5.1.2 Oils and Extracts
5.1.3 Capsules and Tablets
5.1.4 Topicals
5.1.5 Others
5.2 Europe Medical Marijuana Market Outlook, by Cannabinoid Profile, Value (US$ Billion), 2026–2033
5.2.1 THC-Dominant
5.2.2 CBD-Dominant
5.2.3 Balanced THC-to-CBD
5.2.4 Minor Cannabinoid Formulations
5.3 Europe Medical Marijuana Market Outlook, by Distribution Channel, Value (US$ Billion), 2026–2033
5.3.1 Licensed Dispensaries
5.3.2 Pharmacies
5.3.3 Licensed Online and Mail-Order Platforms
5.3.4 Hospitals and Specialty Clinics
5.4 Europe Medical Marijuana Market Outlook, by End User, Value (US$ Billion), 2026–2033
5.4.1 Adult Patients (18 to 64 Years)
5.4.2 Geriatric Patients (65 Years and Above)
5.4.3 Pediatric and Adolescent Patients
5.4.4 Research and Clinical Institutions
5.5 Europe Medical Marijuana Market Outlook, by Country, Value (US$ Billion), 2026–2033
5.5.1 Germany Medical Marijuana Market Outlook, by Product Form, 2026–2033
5.5.2 Germany Medical Marijuana Market Outlook, by Cannabinoid Profile, 2026–2033
5.5.3 Germany Medical Marijuana Market Outlook, by Distribution Channel, 2026–2033
5.5.4 Germany Medical Marijuana Market Outlook, by End User, 2026–2033
5.5.5 United Kingdom Medical Marijuana Market Outlook, by Product Form, 2026–2033
5.5.6 United Kingdom Medical Marijuana Market Outlook, by Cannabinoid Profile, 2026–2033
5.5.7 United Kingdom Medical Marijuana Market Outlook, by Distribution Channel, 2026–2033
5.5.8 United Kingdom Medical Marijuana Market Outlook, by End User, 2026–2033
5.5.9 Poland Medical Marijuana Market Outlook, by Product Form, 2026–2033
5.5.10 Poland Medical Marijuana Market Outlook, by Cannabinoid Profile, 2026–2033
5.5.11 Poland Medical Marijuana Market Outlook, by Distribution Channel, 2026–2033
5.5.12 Poland Medical Marijuana Market Outlook, by End User, 2026–2033
5.5.13 Italy Medical Marijuana Market Outlook, by Product Form, 2026–2033
5.5.14 Italy Medical Marijuana Market Outlook, by Cannabinoid Profile, 2026–2033
5.5.15 Italy Medical Marijuana Market Outlook, by Distribution Channel, 2026–2033
5.5.16 Italy Medical Marijuana Market Outlook, by End User, 2026–2033
5.5.17 Portugal Medical Marijuana Market Outlook, by Product Form, 2026–2033
5.5.18 Portugal Medical Marijuana Market Outlook, by Cannabinoid Profile, 2026–2033
5.5.19 Portugal Medical Marijuana Market Outlook, by Distribution Channel, 2026–2033
5.5.20 Portugal Medical Marijuana Market Outlook, by End User, 2026–2033
5.5.21 Czech Republic Medical Marijuana Market Outlook, by Product Form, 2026–2033
5.5.22 Czech Republic Medical Marijuana Market Outlook, by Cannabinoid Profile, 2026–2033
5.5.23 Czech Republic Medical Marijuana Market Outlook, by Distribution Channel, 2026–2033
5.5.24 Czech Republic Medical Marijuana Market Outlook, by End User, 2026–2033
6. Asia Pacific Medical Marijuana Market Outlook, 2026–2033
6.1 Asia Pacific Medical Marijuana Market Outlook, by Product Form, Value (US$ Billion), 2026–2033
6.1.1 Dried Flower
6.1.2 Oils and Extracts
6.1.3 Capsules and Tablets
6.1.4 Topicals
6.1.5 Others
6.2 Asia Pacific Medical Marijuana Market Outlook, by Cannabinoid Profile, Value (US$ Billion), 2026–2033
6.2.1 THC-Dominant
6.2.2 CBD-Dominant
6.2.3 Balanced THC-to-CBD
6.2.4 Minor Cannabinoid Formulations
6.3 Asia Pacific Medical Marijuana Market Outlook, by Distribution Channel, Value (US$ Billion), 2026–2033
6.3.1 Licensed Dispensaries
6.3.2 Pharmacies
6.3.3 Licensed Online and Mail-Order Platforms
6.3.4 Hospitals and Specialty Clinics
6.4 Asia Pacific Medical Marijuana Market Outlook, by End User, Value (US$ Billion), 2026–2033
6.4.1 Adult Patients (18 to 64 Years)
6.4.2 Geriatric Patients (65 Years and Above)
6.4.3 Pediatric and Adolescent Patients
6.4.4 Research and Clinical Institutions
6.5 Asia Pacific Medical Marijuana Market Outlook, by Country, Value (US$ Billion), 2026–2033
6.5.1 Australia Medical Marijuana Market Outlook, by Product Form, 2026–2033
6.5.2 Australia Medical Marijuana Market Outlook, by Cannabinoid Profile, 2026–2033
6.5.3 Australia Medical Marijuana Market Outlook, by Distribution Channel, 2026–2033
6.5.4 Australia Medical Marijuana Market Outlook, by End User, 2026–2033
6.5.5 New Zealand Medical Marijuana Market Outlook, by Product Form, 2026–2033
6.5.6 New Zealand Medical Marijuana Market Outlook, by Cannabinoid Profile, 2026–2033
6.5.7 New Zealand Medical Marijuana Market Outlook, by Distribution Channel, 2026–2033
6.5.8 New Zealand Medical Marijuana Market Outlook, by End User, 2026–2033
6.5.9 Thailand Medical Marijuana Market Outlook, by Product Form, 2026–2033
6.5.10 Thailand Medical Marijuana Market Outlook, by Cannabinoid Profile, 2026–2033
6.5.11 Thailand Medical Marijuana Market Outlook, by Distribution Channel, 2026–2033
6.5.12 Thailand Medical Marijuana Market Outlook, by End User, 2026–2033
7. Latin America Medical Marijuana Market Outlook, 2026–2033
7.1 Latin America Medical Marijuana Market Outlook, by Product Form, Value (US$ Billion), 2026–2033
7.1.1 Dried Flower
7.1.2 Oils and Extracts
7.1.3 Capsules and Tablets
7.1.4 Topicals
7.1.5 Others
7.2 Latin America Medical Marijuana Market Outlook, by Cannabinoid Profile, Value (US$ Billion), 2026–2033
7.2.1 THC-Dominant
7.2.2 CBD-Dominant
7.2.3 Balanced THC-to-CBD
7.2.4 Minor Cannabinoid Formulations
7.3 Latin America Medical Marijuana Market Outlook, by Distribution Channel, Value (US$ Billion), 2026–2033
7.3.1 Licensed Dispensaries
7.3.2 Pharmacies
7.3.3 Licensed Online and Mail-Order Platforms
7.3.4 Hospitals and Specialty Clinics
7.4 Latin America Medical Marijuana Market Outlook, by End User, Value (US$ Billion), 2026–2033
7.4.1 Adult Patients (18 to 64 Years)
7.4.2 Geriatric Patients (65 Years and Above)
7.4.3 Pediatric and Adolescent Patients
7.4.4 Research and Clinical Institutions
7.5 Latin America Medical Marijuana Market Outlook, by Country, Value (US$ Billion), 2026–2033
7.5.1 Colombia Medical Marijuana Market Outlook, by Product Form, 2026–2033
7.5.2 Colombia Medical Marijuana Market Outlook, by Cannabinoid Profile, 2026–2033
7.5.3 Colombia Medical Marijuana Market Outlook, by Distribution Channel, 2026–2033
7.5.4 Colombia Medical Marijuana Market Outlook, by End User, 2026–2033
7.5.5 Uruguay Medical Marijuana Market Outlook, by Product Form, 2026–2033
7.5.6 Uruguay Medical Marijuana Market Outlook, by Cannabinoid Profile, 2026–2033
7.5.7 Uruguay Medical Marijuana Market Outlook, by Distribution Channel, 2026–2033
7.5.8 Uruguay Medical Marijuana Market Outlook, by End User, 2026–2033
7.5.9 Mexico Medical Marijuana Market Outlook, by Product Form, 2026–2033
7.5.10 Mexico Medical Marijuana Market Outlook, by Cannabinoid Profile, 2026–2033
7.5.11 Mexico Medical Marijuana Market Outlook, by Distribution Channel, 2026–2033
7.5.12 Mexico Medical Marijuana Market Outlook, by End User, 2026–2033
7.5.13 Argentina Medical Marijuana Market Outlook, by Product Form, 2026–2033
7.5.14 Argentina Medical Marijuana Market Outlook, by Cannabinoid Profile, 2026–2033
7.5.15 Argentina Medical Marijuana Market Outlook, by Distribution Channel, 2026–2033
7.5.16 Argentina Medical Marijuana Market Outlook, by End User, 2026–2033
7.5.17 Brazil Medical Marijuana Market Outlook, by Product Form, 2026–2033
7.5.18 Brazil Medical Marijuana Market Outlook, by Cannabinoid Profile, 2026–2033
7.5.19 Brazil Medical Marijuana Market Outlook, by Distribution Channel, 2026–2033
7.5.20 Brazil Medical Marijuana Market Outlook, by End User, 2026–2033
8. Middle East & Africa Medical Marijuana Market Outlook, 2026–2033
8.1 Middle East & Africa Medical Marijuana Market Outlook, by Product Form, Value (US$ Billion), 2026–2033
8.1.1 Dried Flower
8.1.2 Oils and Extracts
8.1.3 Capsules and Tablets
8.1.4 Topicals
8.1.5 Others
8.2 Middle East & Africa Medical Marijuana Market Outlook, by Cannabinoid Profile, Value (US$ Billion), 2026–2033
8.2.1 THC-Dominant
8.2.2 CBD-Dominant
8.2.3 Balanced THC-to-CBD
8.2.4 Minor Cannabinoid Formulations
8.3 Middle East & Africa Medical Marijuana Market Outlook, by Distribution Channel, Value (US$ Billion), 2026–2033
8.3.1 Licensed Dispensaries
8.3.2 Pharmacies
8.3.3 Licensed Online and Mail-Order Platforms
8.3.4 Hospitals and Specialty Clinics
8.4 Middle East & Africa Medical Marijuana Market Outlook, by End User, Value (US$ Billion), 2026–2033
8.4.1 Adult Patients (18 to 64 Years)
8.4.2 Geriatric Patients (65 Years and Above)
8.4.3 Pediatric and Adolescent Patients
8.4.4 Research and Clinical Institutions
8.5 Middle East & Africa Medical Marijuana Market Outlook, by Country, Value (US$ Billion), 2026–2033
8.5.1 Israel Medical Marijuana Market Outlook, by Product Form, 2026–2033
8.5.2 Israel Medical Marijuana Market Outlook, by Cannabinoid Profile, 2026–2033
8.5.3 Israel Medical Marijuana Market Outlook, by Distribution Channel, 2026–2033
8.5.4 Israel Medical Marijuana Market Outlook, by End User, 2026–2033
8.5.5 South Africa Medical Marijuana Market Outlook, by Product Form, 2026–2033
8.5.6 South Africa Medical Marijuana Market Outlook, by Cannabinoid Profile, 2026–2033
8.5.7 South Africa Medical Marijuana Market Outlook, by Distribution Channel, 2026–2033
8.5.8 South Africa Medical Marijuana Market Outlook, by End User, 2026–2033
8.5.9 Morocco Medical Marijuana Market Outlook, by Product Form, 2026–2033
8.5.10 Morocco Medical Marijuana Market Outlook, by Cannabinoid Profile, 2026–2033
8.5.11 Morocco Medical Marijuana Market Outlook, by Distribution Channel, 2026–2033
8.5.12 Morocco Medical Marijuana Market Outlook, by End User, 2026–2033
9. Competitive Landscape
9.1 Industry Leaders
9.2 Company Profiles
9.2.1 Tilray Brands, Inc.
9.2.2 Canopy Growth Corporation
9.2.3 Aurora Cannabis Inc.
9.2.4 Jazz Pharmaceuticals plc
9.2.5 Curaleaf Holdings, Inc.
9.2.6 Trulieve Cannabis Corp.
9.2.7 Green Thumb Industries Inc.
9.2.8 Cresco Labs Inc.
9.2.9 Verano Holdings Corp.
9.2.10 Cronos Group Inc.
9.2.11 Organigram Holdings Inc.
9.2.12 Bedrocan International B.V.
9.2.13 Little Green Pharma Ltd
9.2.14 Clever Leaves Holdings Inc.
9.2.15 Khiron Life Sciences Corp.
10. Appendix
10.1 Research Methodology
10.2 Report Assumptions
10.3 Acronyms and Abbreviations
| By Product Form | Dried Flower, Oils and Extracts, Capsules and Tablets, Topicals, Others |
| By Cannabinoid Profile | THC-Dominant, CBD-Dominant, Balanced THC-to-CBD, Minor Cannabinoid Formulations |
| By Distribution Channel | Licensed Dispensaries, Pharmacies, Licensed Online and Mail-Order Platforms, Hospitals and Specialty Clinics |
| By End User | Adult Patients (18 to 64 Years), Geriatric Patients (65 Years and Above), Pediatric and Adolescent Patients, Research and Clinical Institutions |
| By Region | North America, Europe, Asia Pacific, Latin America, Middle East & Africa |
Our Research Methodology
Considering the volatility of business today, traditional approaches to strategizing a game plan can be unfruitful if not detrimental. True ambiguity is no way to determine a forecast. A myriad of predetermined factors must be accounted for such as the degree of risk involved, the magnitude of circumstances, as well as conditions or consequences that are not known or unpredictable. To circumvent binary views that cast uncertainty, the application of market research intelligence to strategically posture, move, and enable actionable outcomes is necessary.
View Methodology
Quality Assured
Rigorous Validation Process

Confidentiality Assured
End-to-end Data Security

Custom Research Services
Tailored To Your Objectives
FAQs
The global Medical Marijuana market is valued at US$ 19.4 billion in 2026, supported by widening medical authorisation frameworks and expanding licensed supply capacity.
The market is projected to reach US$ 42.4 billion by 2033, growing at an 11.8% CAGR and adding US$ 23.0 billion in absolute opportunity.
Dried flower leads with 41.6% share in 2026, while oils and extracts grow fastest at a 13.6% CAGR through 2033 across licensed channels.
North America holds 48.2% share in 2026, while Europe is the fastest-growing region at a 15.9% CAGR between 2026 and 2033.
Key participants include Tilray Brands, Inc., Canopy Growth Corporation, Aurora Cannabis Inc., Jazz Pharmaceuticals plc, Curaleaf Holdings, Inc. and Bedrocan International B.V.
Related Reports
Aesthetic Medicine Market Size, Share, Insights, Competitive Landscape, and Forecast 2026 to 2033
Explore the aesthetic medicine market outlook for 2026–2033, covering products, patient groups, end users, regional trends, and leading companies.
Kidney Dialysis Centres Market Size, Share, Insights, Competitive Landscape, and Forecast 2026 to 2033
Explore the kidney dialysis centres market outlook for 2026–2033, covering dialysis types, service settings, centre types, regions, and key companies.
Cervical Cancer Treatment Market Size, Share, Insights, Competitive Landscape, and Forecast 2026 to 2033
Explore the cervical cancer treatment market outlook for 2026–2033, covering therapies, cancer types, end users, regional trends, and key companies.
Gout Therapeutic Market Size, Share, Insights, Competitive Landscape, and Forecast 2026 to 2033
The global gout therapeutic market is valued at US$2.9 billion in 2026, reaching US$4.7 billion by 2033, growing at a 7.1% CAGR
Small Molecule API Market Size, Share, Insights, Competitive Landscape, and Forecast 2026 to 2033
Explore the small molecule API market outlook for 2026–2033, including synthesis, manufacturing, therapeutic applications, regions, and competitors.
Pantoprazole Sodium Market Size, Share, Insights, Competitive Landscape, and Forecast 2026 to 2033
The global pantoprazole sodium market is valued at US$2.36 billion in 2026, reaching US$3.57 billion by 2033, growing at a 6.1% CAGR