



Small Molecule API Market
Small Molecule API Market Size, Share, Insights, Competitive Landscape, and Forecast 2026 to 2033
Report Overview
Small Molecule API Market Size and Trend Analysis
What Is Driving Small Molecule API Market Growth?
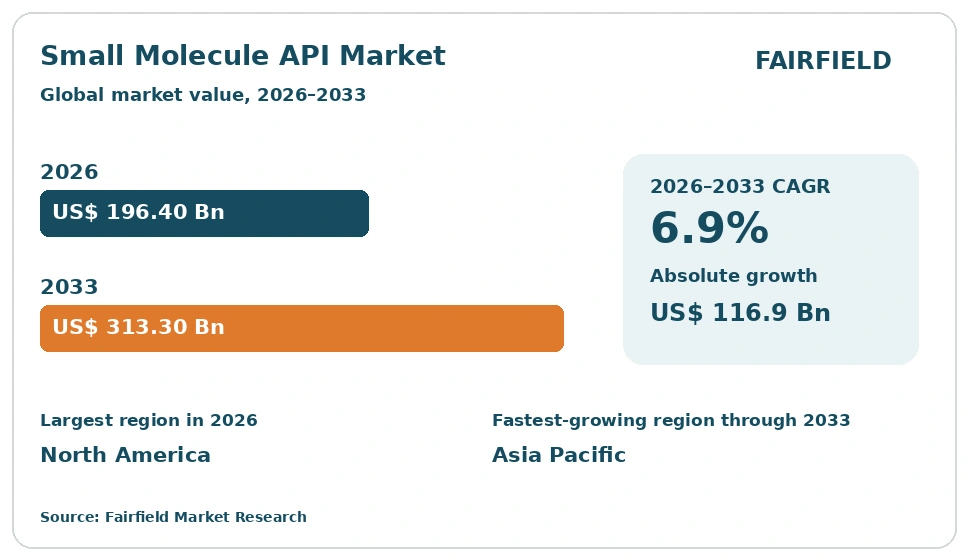
The global Small Molecule API market size is expected to be valued at US$ 196.4 billion in 2026 and projected to reach US$ 313.3 billion by 2033, growing at a CAGR of 6.9% between 2026 and 2033. Growth rests on steady prescription volumes, patent expiries that widen generic supply, and rising outsourcing to specialist contract manufacturers. Treatment of chronic cardiac, cancer and metabolic conditions keeps synthetic ingredient demand firm across branded and generic pipelines. Buyers now pay more for audited, traceable supply after repeated shortages, which supports realised prices for compliant producers. Demand for highly potent ingredients and deeper regulated-market capacity in Asia reinforce that direction, creating an absolute dollar opportunity of US$ 116.9 billion across the forecast period.
Key Report Takeaways
- By Synthesis Type: Chemically synthesised ingredients led with 68.5% share in 2026, while highly potent small molecule ingredients are projected to expand at a 9.4% CAGR through 2033, driven by targeted cancer dosing that needs contained, low-volume production lines.
- By Manufacturer Type: Captive in-house production held 58.4% share in 2026, while contract manufacturing is set to grow at an 8.3% CAGR through 2033, driven by sponsors converting fixed plant costs into variable outsourced supply agreements.
- By Drug Type: Generic ingredients accounted for 63.7% share in 2026, while innovator ingredients are forecast to rise at a 7.6% CAGR through 2033, driven by specialty launches that carry far higher value per kilogram supplied.
- By Therapeutic Application: Cardiovascular ingredients led with 21.8% share in 2026, while oncology ingredients should advance at a 9.1% CAGR through 2033, driven by wider prescribing of targeted therapies in ageing patient populations.
- By Region: Across North America, Europe, Asia Pacific, Latin America and Middle East & Africa, North America led with 33.6% share in 2026, while Asia Pacific is projected to grow at an 8.6% CAGR through 2033, driven by new multipurpose plants serving regulated export markets.
Market Trends and Insights
Market Growth Drivers
Patent Expiries Keep Generic Ingredient Volumes Climbing
Patent expiries on major small molecule brands push large prescription volumes into generic supply, and that shift lifts ingredient demand sharply. Each expiry turns one captive supply line into open tendering among several ingredient producers, so total sourced volume rises even when the finished drug price falls. Formulators qualify two or three ingredient sources before launch, which spreads orders across a wider supplier base.
The pattern is clearest in cardiac, central nervous system and metabolic treatments, where long-established molecules still carry heavy prescription loads. Producers prepare years ahead, filing drug master files and qualifying commercial batches so they can ship from the first day of generic entry. Agencies such as the US Food and Drug Administration and the European Medicines Agency assess those filings, and approved status becomes the entry ticket for tender participation.
Chronic Disease Treatment Sustains Steady Prescription Demand
Long-term treatment of heart disease, diabetes, mental illness and cancer gives this market an unusually stable volume base. Patients stay on these medicines for years, so ingredient orders repeat on predictable cycles rather than moving with short product fashions. That stability lets producers plan campaigns, hold buffer stock and invest in capacity with reasonable confidence about future offtake, which keeps utilisation rates and plant economics healthy.
Ageing populations in high-income countries and widening insurance coverage in middle-income ones both add patients to those treatment pools. Public health bodies, including the World Health Organization, list many small molecule medicines as essential, which anchors government procurement and national tender volumes. Hospital formularies and retail pharmacy chains then convert those national commitments into firm annual ingredient contracts with qualified and regularly audited suppliers.
Restraints Impact Analysis of Market
Price Erosion in Generic Ingredients Squeezes Producer Margins
Sustained price erosion in mature generic ingredients limits revenue growth even when shipped volumes keep rising. Buyers run reverse auctions and multi-year tenders that reward the lowest compliant bid, so suppliers surrender margin to hold share. Thin returns leave less cash for plant upgrades, environmental controls and quality systems, which slows reinvestment in exactly the assets that regulators expect producers to maintain.
The pressure is heaviest in high-volume categories where many qualified sources compete for the same molecules. Large buying groups and public procurement agencies consolidate demand, which strengthens their negotiating position against fragmented supply. Some producers respond by exiting low-margin molecules altogether, and those exits have contributed to shortages of older medicines. Others shift mix towards complex or potent ingredients where fewer competitors can meet the technical and containment requirements.
Compliance and Inspection Burdens Raise the Cost of Supply
Good manufacturing practice obligations add fixed cost and time to every ingredient a producer sells, which restrains smaller entrants. Sites must maintain documentation, validation, stability programmes and trained quality staff before a single commercial kilogram ships. Any adverse inspection outcome can suspend supply from a site, so customers hold qualified backups, and the duplicated qualification work raises cost across the whole chain.
Oversight has tightened as regulated markets lean on imported ingredients. The US Food and Drug Administration, the European Medicines Agency and the Central Drugs Standard Control Organisation all operate inspection programmes covering overseas manufacturing sites. Environmental permitting, solvent handling rules and effluent limits add a second compliance layer in major producing regions. Together these requirements lengthen the path from an initial capacity decision to approved commercial supply, and they raise the cost of holding qualified backup sites.
Market Opportunities
Highly Potent Ingredients Open Higher-Value Production Work
Highly potent ingredients give producers a route out of commodity pricing and into contracts with much better unit economics. Volumes per molecule are small, yet value per kilogram is high because containment, handling controls and specialised operator training restrict the supplier pool. Customers developing targeted cancer and hormone therapies accept firmer prices in exchange for secure, qualified supply from a short list of capable sites.
Demand follows the direction of innovator pipelines, where targeted small molecules and payloads for antibody-drug conjugates carry growing weight. Building this capability needs dedicated suites, containment engineering and occupational monitoring, so investment decisions are deliberate and capacity stays tight. Producers that already run contained facilities can extend into adjacent potency bands, and contract manufacturers increasingly present proven containment capability as a core commercial differentiator in sponsor negotiations.
Supply Chain Reshoring Creates Room for New Regional Capacity
Government interest in medicine security opens space for ingredient capacity in regions that had largely stopped producing. Buyers and health systems now treat concentrated sourcing as a risk, and several are willing to pay a premium or sign longer contracts for locally made supply. That willingness improves the business case for sites in North America and Europe that could not compete on cost alone.
Policy support has taken the form of industrial strategies and funding programmes aimed at essential medicines and their starting materials. Producers responding to this pull tend to favour flexible multipurpose plants and continuous-capable equipment that can switch molecules without long changeovers. Latin American and Middle Eastern governments pursue similar goals through local-content rules in public tenders, which gives regional formulators a reason to back nearby ingredient partners.
Category-wise Insights
Chemically Synthesised Ingredients Hold Scale While Potent Classes Set the Pace
Chemically synthesised ingredients led the market with 68.5% share in 2026, reflecting their dominance of everyday prescription medicines. Mature assets and well-understood regulatory pathways keep this class the default for cardiac, metabolic and anti-infective treatments. Semi-synthetic ingredients held 19.2% share, concentrated in antibiotic and steroid families that start from fermentation-derived inputs.
Highly potent ingredients are the growth leader, projected to expand at a 9.4% CAGR between 2026 and 2033. That pace comes from innovator pipelines weighted to targeted oncology and hormone therapies, which need contained facilities. Such capacity stays limited because containment investment is costly. For the market, volume growth remains with conventional synthesis while value growth shifts to potent classes, pushing producers to add containment rather than more commodity tonnage.
Contract Manufacturing Gains Ground as Captive Plants Stay Dominant
Captive in-house production held 58.4% share in 2026, because large pharmaceutical companies still make many of their own commercial ingredients. Owning the site protects know-how for patented molecules, secures flagship brand supply and keeps regulatory accountability inside one organisation. Captive assets also carry decades of validation history that firms rarely abandon while the molecules behind them stay profitable.
Contract manufacturing is the faster mover, forecast to grow at an 8.3% CAGR through 2033. Sponsors want variable cost structures, access to specialised technology and faster scale-up without building sites of their own. Contract manufacturers respond by broadening from single steps to integrated supply covering starting materials through finished ingredient. The result is a slow transfer of production from captive plants to external partners, which raises the weight of supplier selection and multi-source planning.
Which Drug Type Leads Small Molecule API Demand?
Generic ingredients lead the market, holding 63.7% share in 2026 on the strength of prescription volume. Most dispensed small molecule medicines in major health systems are off-patent, and payers reinforce that position through substitution rules and tender-based buying. High volumes at low prices make this the largest revenue pool despite persistent price pressure.
Innovator ingredients grow faster, at a 7.6% CAGR through 2033, because new approvals skew towards complex, higher-value molecules. These ingredients are made in smaller quantities under tight specifications, often with containment requirements, and they command prices many times those of mature generics. The two paths differ in character: generics compete on cost, reliability and inspection record, while innovator supply competes on technical capability and development speed. Producers increasingly hold positions in both.
Cardiovascular Ingredients Lead Volumes While Oncology Grows Fastest
Cardiovascular ingredients led therapeutic applications with 21.8% share in 2026, carried by the sheer scale of treatment for high blood pressure, cholesterol and heart failure. These medicines are prescribed for life and bought in bulk by public health systems. Oncology followed at 17.4% share, with central nervous system ingredients at 14.1% and anti-infectives at 13.6%.
Oncology is the growth leader, projected to rise at a 9.1% CAGR through 2033. Earlier diagnosis, wider access to targeted therapies and a steady flow of small molecule approvals in cancer care all support that trajectory. Diabetes and metabolic ingredients held 12.9% share as obesity-related prescribing widened. The implication is a mix shift: volume still sits with cardiac and anti-infective products, while new profit pools form around cancer ingredients needing contained manufacturing.
Geography Analysis
Which Region Is Leading the Small Molecule API Market?
North America leads the market with 33.6% share in 2026, supported by the value of ingredients consumed rather than tonnage produced. The United States accounts for most of that total through high medicine prices, deep innovator pipelines and captive production of patented ingredients. Canada adds smaller specialty and generic supply. Regional value concentrates in high-worth molecules for cancer, immunology and metabolic care, where price per kilogram sits far above commodity levels. Policy attention to medicine security has encouraged investment in domestic capacity and in flexible plants able to switch between molecules. The US Food and Drug Administration maintains inspection and filing requirements that decide which suppliers can serve the market, giving compliant domestic sites an advantage in hospital and essential medicine contracts.
European Producers Compete on Compliance and Specialty Ingredients
Europe held 25.4% share in 2026, built on long-standing fine chemical expertise and strict quality expectations. Switzerland, Germany, Italy, Ireland and Spain host dense clusters of ingredient and contract manufacturing sites serving both regional and export demand. Italian and Spanish producers supply broad generic ingredient portfolios, while Swiss and Irish sites concentrate on complex and potent molecules tied to innovator pipelines. The European Medicines Agency and national inspectorates enforce standards that customers treat as a quality signal worldwide. Energy costs and environmental permitting weigh on commodity competitiveness, pushing producers towards specialty work where technical difficulty limits rivalry. Policy interest in reducing import dependence supports keeping essential medicine production inside the bloc.
Which Region Is Growing Fastest in the Small Molecule API Market?
Asia Pacific grows fastest, at an 8.6% CAGR between 2026 and 2033, from 31.2% share in 2026. India and China anchor that expansion as the main suppliers of merchant ingredients to regulated markets, with Japan and South Korea contributing high-specification capacity. Indian producers keep adding export-approved plants and moving up from commodity molecules into complex and potent classes. Chinese sites supply much of the starting material the global chain depends on, and government programmes in both countries back domestic production of those inputs. Rising healthcare spending and expanding local formulation industries add a second demand engine alongside exports, while the Central Drugs Standard Control Organisation tightens oversight.
Latin America Builds Local Supply Around Public Health Programmes
Latin America held 5.6% share in 2026 and is set to grow at a 6.8% CAGR through 2033. Brazil, Mexico and Argentina account for most regional activity, where large public health systems buy generic medicines in volume. Governments use local-content preferences in tenders to encourage domestic formulation, which in turn creates demand for regional ingredient partners and joint ventures. Most high-value ingredients are still imported, so local production concentrates on established molecules for cardiac, anti-infective and pain treatment. Regulatory strengthening by national health agencies has raised manufacturing expectations and supplier credibility. Currency movements and import dependence keep investment selective rather than broad.
Middle East & Africa Expands Local Formulation and Ingredient Links
Middle East & Africa held 4.2% share in 2026, with growth of 6.4% CAGR through 2033 from a small base. Saudi Arabia, the United Arab Emirates, Egypt, South Africa and Morocco lead regional activity. Gulf states fund local pharmaceutical production as part of economic diversification, while North African producers build on established formulation industries serving domestic and export demand. Most ingredients are imported, so regional growth shows first as stronger purchasing by local formulators rather than new synthesis capacity. Public health programmes covering infectious disease and chronic care drive much of the volume. Continental regulatory harmonisation aims to simplify approvals across African markets, which would make local ingredient investment more attractive.
Competitive Landscape
The market is fragmented, with hundreds of qualified producers supplying ingredients across different molecules, regions and quality tiers. No single company commands a decisive share, because customers deliberately maintain multiple approved sources for each ingredient they buy. Concentration does appear within individual molecules, where only a handful of sites hold the relevant approvals. Indian and Chinese producers dominate merchant supply by volume, while European and North American sites hold stronger positions in complex, potent and innovator-linked ingredients. Consolidation continues as larger groups acquire specialist sites to widen technical range and geographic coverage.
Competition turns on regulatory record, cost position, technical capability and supply reliability rather than on branded differentiation. An unblemished inspection history and a strong filing portfolio function as commercial assets, since customers cannot use an ingredient the agencies will not accept. Producers also compete on containment capability for potent molecules, control of starting materials, environmental performance and delivery dependability. Contract manufacturers that can take a molecule from development through commercial supply hold an advantage with sponsors who want fewer interfaces to manage.
Strategic activity centres on capacity expansion, backward integration into intermediates and starting materials, and selective acquisition of contained or specialised sites. Backward integration matters because it reduces exposure to single-source inputs that customers now scrutinise closely. Site additions in regions aligned with customer supply-security goals serve the same purpose from a different angle.
Vendor strategy is moving in a consistent direction: away from undifferentiated commodity volume and towards ingredients where technical difficulty, compliance strength or supply security justify firmer pricing.
Industry Leaders
- Teva Pharmaceutical Industries Ltd.
- Dr. Reddy’s Laboratories Ltd.
- Aurobindo Pharma Limited
- Divi’s Laboratories Limited
- Sun Pharmaceutical Industries Ltd.
- Lonza Group AG
- Viatris Inc.
- WuXi AppTec Co., Ltd.
Companies Covered in the Report
- Teva Pharmaceutical Industries Ltd.
- Dr. Reddy’s Laboratories Ltd.
- Aurobindo Pharma Limited
- Divi’s Laboratories Limited
- Sun Pharmaceutical Industries Ltd.
- Lonza Group AG
- Viatris Inc.
- WuXi AppTec Co., Ltd.
- Siegfried Holding AG
- Cambrex Corporation
- Piramal Pharma Limited
- Hikma Pharmaceuticals PLC
- Laurus Labs Limited
- Olon S.p.A.
- Granules India Limited
Small Molecule API Market Report Scope
The market is segmented by synthesis type, manufacturer type, drug type, therapeutic application and region.
| By Synthesis Type | Chemically Synthesised, Semi-Synthetic, Highly Potent |
| By Manufacturer Type | Captive (In-House), Contract Manufacturing |
| By Drug Type | Generic, Innovator |
| By Therapeutic Application | Cardiovascular, Oncology, Central Nervous System, Anti-Infectives, Diabetes and Metabolic, Pain and Musculoskeletal, Others |
| By Region | North America, Europe, Asia Pacific, Latin America, Middle East & Africa |
1. Executive Summary
1.1 Small Molecule API Market Snapshot
1.2 Future Projections
1.3 Key Industry Highlights
1.4 Geographical Snapshot
2. Market Overview
2.1 Market Definition and Segmentation
2.2 Market Dynamics
2.2.1 Drivers
2.2.1.1 Patent Expiries Keep Generic Ingredient Volumes Climbing
2.2.1.2 Chronic Disease Treatment Sustains Steady Prescription Demand
2.2.2 Restraints
2.2.2.1 Price Erosion in Generic Ingredients Squeezes Producer Margins
2.2.2.2 Compliance and Inspection Burdens Raise the Cost of Supply
2.2.3 Market Opportunities
2.2.3.1 Highly Potent Ingredients Open Higher-Value Production Work
2.2.3.2 Supply Chain Reshoring Creates Room for New Regional Capacity
3. Global Small Molecule API Market Outlook, 2026–2033
3.1 Global Small Molecule API Market Outlook, by Synthesis Type, Value (US$ Billion), 2026–2033
3.1.1 Chemically Synthesised
3.1.2 Semi-Synthetic
3.1.3 Highly Potent
3.2 Global Small Molecule API Market Outlook, by Manufacturer Type, Value (US$ Billion), 2026–2033
3.2.1 Captive (In-House)
3.2.2 Contract Manufacturing
3.3 Global Small Molecule API Market Outlook, by Drug Type, Value (US$ Billion), 2026–2033
3.3.1 Generic
3.3.2 Innovator
3.4 Global Small Molecule API Market Outlook, by Therapeutic Application, Value (US$ Billion), 2026–2033
3.4.1 Cardiovascular
3.4.2 Oncology
3.4.3 Central Nervous System
3.4.4 Anti-Infectives
3.4.5 Diabetes and Metabolic
3.4.6 Pain and Musculoskeletal
3.4.7 Others
3.5 Global Small Molecule API Market Outlook, by Region, Value (US$ Billion), 2026–2033
3.5.1 North America
3.5.2 Europe
3.5.3 Asia Pacific
3.5.4 Latin America
3.5.5 Middle East & Africa
4. North America Small Molecule API Market Outlook, 2026–2033
4.1 North America Small Molecule API Market Outlook, by Synthesis Type, Value (US$ Billion), 2026–2033
4.1.1 Chemically Synthesised
4.1.2 Semi-Synthetic
4.1.3 Highly Potent
4.2 North America Small Molecule API Market Outlook, by Manufacturer Type, Value (US$ Billion), 2026–2033
4.2.1 Captive (In-House)
4.2.2 Contract Manufacturing
4.3 North America Small Molecule API Market Outlook, by Drug Type, Value (US$ Billion), 2026–2033
4.3.1 Generic
4.3.2 Innovator
4.4 North America Small Molecule API Market Outlook, by Therapeutic Application, Value (US$ Billion), 2026–2033
4.4.1 Cardiovascular
4.4.2 Oncology
4.4.3 Central Nervous System
4.4.4 Anti-Infectives
4.4.5 Diabetes and Metabolic
4.4.6 Pain and Musculoskeletal
4.4.7 Others
4.5 North America Small Molecule API Market Outlook, by Country, Value (US$ Billion), 2026–2033
4.5.1 United States Small Molecule API Market Outlook, by Synthesis Type, 2026–2033
4.5.2 United States Small Molecule API Market Outlook, by Manufacturer Type, 2026–2033
4.5.3 United States Small Molecule API Market Outlook, by Drug Type, 2026–2033
4.5.4 United States Small Molecule API Market Outlook, by Therapeutic Application, 2026–2033
4.5.5 Canada Small Molecule API Market Outlook, by Synthesis Type, 2026–2033
4.5.6 Canada Small Molecule API Market Outlook, by Manufacturer Type, 2026–2033
4.5.7 Canada Small Molecule API Market Outlook, by Drug Type, 2026–2033
4.5.8 Canada Small Molecule API Market Outlook, by Therapeutic Application, 2026–2033
5. Europe Small Molecule API Market Outlook, 2026–2033
5.1 Europe Small Molecule API Market Outlook, by Synthesis Type, Value (US$ Billion), 2026–2033
5.1.1 Chemically Synthesised
5.1.2 Semi-Synthetic
5.1.3 Highly Potent
5.2 Europe Small Molecule API Market Outlook, by Manufacturer Type, Value (US$ Billion), 2026–2033
5.2.1 Captive (In-House)
5.2.2 Contract Manufacturing
5.3 Europe Small Molecule API Market Outlook, by Drug Type, Value (US$ Billion), 2026–2033
5.3.1 Generic
5.3.2 Innovator
5.4 Europe Small Molecule API Market Outlook, by Therapeutic Application, Value (US$ Billion), 2026–2033
5.4.1 Cardiovascular
5.4.2 Oncology
5.4.3 Central Nervous System
5.4.4 Anti-Infectives
5.4.5 Diabetes and Metabolic
5.4.6 Pain and Musculoskeletal
5.4.7 Others
5.5 Europe Small Molecule API Market Outlook, by Country, Value (US$ Billion), 2026–2033
5.5.1 Switzerland Small Molecule API Market Outlook, by Synthesis Type, 2026–2033
5.5.2 Switzerland Small Molecule API Market Outlook, by Manufacturer Type, 2026–2033
5.5.3 Switzerland Small Molecule API Market Outlook, by Drug Type, 2026–2033
5.5.4 Switzerland Small Molecule API Market Outlook, by Therapeutic Application, 2026–2033
5.5.5 Germany Small Molecule API Market Outlook, by Synthesis Type, 2026–2033
5.5.6 Germany Small Molecule API Market Outlook, by Manufacturer Type, 2026–2033
5.5.7 Germany Small Molecule API Market Outlook, by Drug Type, 2026–2033
5.5.8 Germany Small Molecule API Market Outlook, by Therapeutic Application, 2026–2033
5.5.9 Italy Small Molecule API Market Outlook, by Synthesis Type, 2026–2033
5.5.10 Italy Small Molecule API Market Outlook, by Manufacturer Type, 2026–2033
5.5.11 Italy Small Molecule API Market Outlook, by Drug Type, 2026–2033
5.5.12 Italy Small Molecule API Market Outlook, by Therapeutic Application, 2026–2033
5.5.13 Ireland Small Molecule API Market Outlook, by Synthesis Type, 2026–2033
5.5.14 Ireland Small Molecule API Market Outlook, by Manufacturer Type, 2026–2033
5.5.15 Ireland Small Molecule API Market Outlook, by Drug Type, 2026–2033
5.5.16 Ireland Small Molecule API Market Outlook, by Therapeutic Application, 2026–2033
5.5.17 Spain Small Molecule API Market Outlook, by Synthesis Type, 2026–2033
5.5.18 Spain Small Molecule API Market Outlook, by Manufacturer Type, 2026–2033
5.5.19 Spain Small Molecule API Market Outlook, by Drug Type, 2026–2033
5.5.20 Spain Small Molecule API Market Outlook, by Therapeutic Application, 2026–2033
6. Asia Pacific Small Molecule API Market Outlook, 2026–2033
6.1 Asia Pacific Small Molecule API Market Outlook, by Synthesis Type, Value (US$ Billion), 2026–2033
6.1.1 Chemically Synthesised
6.1.2 Semi-Synthetic
6.1.3 Highly Potent
6.2 Asia Pacific Small Molecule API Market Outlook, by Manufacturer Type, Value (US$ Billion), 2026–2033
6.2.1 Captive (In-House)
6.2.2 Contract Manufacturing
6.3 Asia Pacific Small Molecule API Market Outlook, by Drug Type, Value (US$ Billion), 2026–2033
6.3.1 Generic
6.3.2 Innovator
6.4 Asia Pacific Small Molecule API Market Outlook, by Therapeutic Application, Value (US$ Billion), 2026–2033
6.4.1 Cardiovascular
6.4.2 Oncology
6.4.3 Central Nervous System
6.4.4 Anti-Infectives
6.4.5 Diabetes and Metabolic
6.4.6 Pain and Musculoskeletal
6.4.7 Others
6.5 Asia Pacific Small Molecule API Market Outlook, by Country, Value (US$ Billion), 2026–2033
6.5.1 India Small Molecule API Market Outlook, by Synthesis Type, 2026–2033
6.5.2 India Small Molecule API Market Outlook, by Manufacturer Type, 2026–2033
6.5.3 India Small Molecule API Market Outlook, by Drug Type, 2026–2033
6.5.4 India Small Molecule API Market Outlook, by Therapeutic Application, 2026–2033
6.5.5 China Small Molecule API Market Outlook, by Synthesis Type, 2026–2033
6.5.6 China Small Molecule API Market Outlook, by Manufacturer Type, 2026–2033
6.5.7 China Small Molecule API Market Outlook, by Drug Type, 2026–2033
6.5.8 China Small Molecule API Market Outlook, by Therapeutic Application, 2026–2033
6.5.9 Japan Small Molecule API Market Outlook, by Synthesis Type, 2026–2033
6.5.10 Japan Small Molecule API Market Outlook, by Manufacturer Type, 2026–2033
6.5.11 Japan Small Molecule API Market Outlook, by Drug Type, 2026–2033
6.5.12 Japan Small Molecule API Market Outlook, by Therapeutic Application, 2026–2033
6.5.13 South Korea Small Molecule API Market Outlook, by Synthesis Type, 2026–2033
6.5.14 South Korea Small Molecule API Market Outlook, by Manufacturer Type, 2026–2033
6.5.15 South Korea Small Molecule API Market Outlook, by Drug Type, 2026–2033
6.5.16 South Korea Small Molecule API Market Outlook, by Therapeutic Application, 2026–2033
7. Latin America Small Molecule API Market Outlook, 2026–2033
7.1 Latin America Small Molecule API Market Outlook, by Synthesis Type, Value (US$ Billion), 2026–2033
7.1.1 Chemically Synthesised
7.1.2 Semi-Synthetic
7.1.3 Highly Potent
7.2 Latin America Small Molecule API Market Outlook, by Manufacturer Type, Value (US$ Billion), 2026–2033
7.2.1 Captive (In-House)
7.2.2 Contract Manufacturing
7.3 Latin America Small Molecule API Market Outlook, by Drug Type, Value (US$ Billion), 2026–2033
7.3.1 Generic
7.3.2 Innovator
7.4 Latin America Small Molecule API Market Outlook, by Therapeutic Application, Value (US$ Billion), 2026–2033
7.4.1 Cardiovascular
7.4.2 Oncology
7.4.3 Central Nervous System
7.4.4 Anti-Infectives
7.4.5 Diabetes and Metabolic
7.4.6 Pain and Musculoskeletal
7.4.7 Others
7.5 Latin America Small Molecule API Market Outlook, by Country, Value (US$ Billion), 2026–2033
7.5.1 Brazil Small Molecule API Market Outlook, by Synthesis Type, 2026–2033
7.5.2 Brazil Small Molecule API Market Outlook, by Manufacturer Type, 2026–2033
7.5.3 Brazil Small Molecule API Market Outlook, by Drug Type, 2026–2033
7.5.4 Brazil Small Molecule API Market Outlook, by Therapeutic Application, 2026–2033
7.5.5 Mexico Small Molecule API Market Outlook, by Synthesis Type, 2026–2033
7.5.6 Mexico Small Molecule API Market Outlook, by Manufacturer Type, 2026–2033
7.5.7 Mexico Small Molecule API Market Outlook, by Drug Type, 2026–2033
7.5.8 Mexico Small Molecule API Market Outlook, by Therapeutic Application, 2026–2033
7.5.9 Argentina Small Molecule API Market Outlook, by Synthesis Type, 2026–2033
7.5.10 Argentina Small Molecule API Market Outlook, by Manufacturer Type, 2026–2033
7.5.11 Argentina Small Molecule API Market Outlook, by Drug Type, 2026–2033
7.5.12 Argentina Small Molecule API Market Outlook, by Therapeutic Application, 2026–2033
8. Middle East & Africa Small Molecule API Market Outlook, 2026–2033
8.1 Middle East & Africa Small Molecule API Market Outlook, by Synthesis Type, Value (US$ Billion), 2026–2033
8.1.1 Chemically Synthesised
8.1.2 Semi-Synthetic
8.1.3 Highly Potent
8.2 Middle East & Africa Small Molecule API Market Outlook, by Manufacturer Type, Value (US$ Billion), 2026–2033
8.2.1 Captive (In-House)
8.2.2 Contract Manufacturing
8.3 Middle East & Africa Small Molecule API Market Outlook, by Drug Type, Value (US$ Billion), 2026–2033
8.3.1 Generic
8.3.2 Innovator
8.4 Middle East & Africa Small Molecule API Market Outlook, by Therapeutic Application, Value (US$ Billion), 2026–2033
8.4.1 Cardiovascular
8.4.2 Oncology
8.4.3 Central Nervous System
8.4.4 Anti-Infectives
8.4.5 Diabetes and Metabolic
8.4.6 Pain and Musculoskeletal
8.4.7 Others
8.5 Middle East & Africa Small Molecule API Market Outlook, by Country and Subregion, Value (US$ Billion), 2026–2033
8.5.1 Saudi Arabia Small Molecule API Market Outlook, by Synthesis Type, 2026–2033
8.5.2 Saudi Arabia Small Molecule API Market Outlook, by Manufacturer Type, 2026–2033
8.5.3 Saudi Arabia Small Molecule API Market Outlook, by Drug Type, 2026–2033
8.5.4 Saudi Arabia Small Molecule API Market Outlook, by Therapeutic Application, 2026–2033
8.5.5 United Arab Emirates Small Molecule API Market Outlook, by Synthesis Type, 2026–2033
8.5.6 United Arab Emirates Small Molecule API Market Outlook, by Manufacturer Type, 2026–2033
8.5.7 United Arab Emirates Small Molecule API Market Outlook, by Drug Type, 2026–2033
8.5.8 United Arab Emirates Small Molecule API Market Outlook, by Therapeutic Application, 2026–2033
8.5.9 Egypt Small Molecule API Market Outlook, by Synthesis Type, 2026–2033
8.5.10 Egypt Small Molecule API Market Outlook, by Manufacturer Type, 2026–2033
8.5.11 Egypt Small Molecule API Market Outlook, by Drug Type, 2026–2033
8.5.12 Egypt Small Molecule API Market Outlook, by Therapeutic Application, 2026–2033
8.5.13 South Africa Small Molecule API Market Outlook, by Synthesis Type, 2026–2033
8.5.14 South Africa Small Molecule API Market Outlook, by Manufacturer Type, 2026–2033
8.5.15 South Africa Small Molecule API Market Outlook, by Drug Type, 2026–2033
8.5.16 South Africa Small Molecule API Market Outlook, by Therapeutic Application, 2026–2033
8.5.17 Morocco Small Molecule API Market Outlook, by Synthesis Type, 2026–2033
8.5.18 Morocco Small Molecule API Market Outlook, by Manufacturer Type, 2026–2033
8.5.19 Morocco Small Molecule API Market Outlook, by Drug Type, 2026–2033
8.5.20 Morocco Small Molecule API Market Outlook, by Therapeutic Application, 2026–2033
8.5.21 Gulf states Small Molecule API Market Outlook, by Synthesis Type, 2026–2033
8.5.22 Gulf states Small Molecule API Market Outlook, by Manufacturer Type, 2026–2033
8.5.23 Gulf states Small Molecule API Market Outlook, by Drug Type, 2026–2033
8.5.24 Gulf states Small Molecule API Market Outlook, by Therapeutic Application, 2026–2033
9. Competitive Landscape
9.1 Industry Leaders
9.2 Company Profiles
9.2.1 Teva Pharmaceutical Industries Ltd.
9.2.2 Dr. Reddy's Laboratories Ltd.
9.2.3 Aurobindo Pharma Limited
9.2.4 Divi's Laboratories Limited
9.2.5 Sun Pharmaceutical Industries Ltd.
9.2.6 Lonza Group AG
9.2.7 Viatris Inc.
9.2.8 WuXi AppTec Co., Ltd.
9.2.9 Siegfried Holding AG
9.2.10 Cambrex Corporation
9.2.11 Piramal Pharma Limited
9.2.12 Hikma Pharmaceuticals PLC
9.2.13 Laurus Labs Limited
9.2.14 Olon S.p.A.
9.2.15 Granules India Limited
10. Appendix
10.1 Research Methodology
10.2 Report Assumptions
10.3 Acronyms and Abbreviations
| By Synthesis Type | Chemically Synthesised, Semi-Synthetic, Highly Potent |
| By Manufacturer Type | Captive (In-House), Contract Manufacturing |
| By Drug Type | Generic, Innovator |
| By Therapeutic Application | Cardiovascular, Oncology, Central Nervous System, Anti-Infectives, Diabetes and Metabolic, Pain and Musculoskeletal, Others |
| By Region | North America, Europe, Asia Pacific, Latin America, Middle East & Africa |
Our Research Methodology
Considering the volatility of business today, traditional approaches to strategizing a game plan can be unfruitful if not detrimental. True ambiguity is no way to determine a forecast. A myriad of predetermined factors must be accounted for such as the degree of risk involved, the magnitude of circumstances, as well as conditions or consequences that are not known or unpredictable. To circumvent binary views that cast uncertainty, the application of market research intelligence to strategically posture, move, and enable actionable outcomes is necessary.
View Methodology
Quality Assured
Rigorous Validation Process

Confidentiality Assured
End-to-end Data Security

Custom Research Services
Tailored To Your Objectives
FAQs
The market is valued at US$ 196.4 billion in 2026, supported by steady generic prescription volumes and rising outsourced ingredient supply worldwide.
The market is projected to grow at a 6.9% CAGR between 2026 and 2033, reaching US$ 313.3 billion by the final forecast year.
Chemically synthesised ingredients lead with 68.5% share in 2026, since most prescribed small molecule medicines rely on conventional synthetic production routes.
North America holds 33.6% share in 2026, helped by high medicine prices, innovator pipelines and captive production of patented small molecule ingredients.
The market is fragmented, with many qualified producers competing on regulatory record, cost, containment capability and supply reliability rather than product branding.
Related Reports
Kidney Dialysis Centres Market Size, Share, Insights, Competitive Landscape, and Forecast 2026 to 2033
Explore the kidney dialysis centres market outlook for 2026–2033, covering dialysis types, service settings, centre types, regions, and key companies.
Cervical Cancer Treatment Market Size, Share, Insights, Competitive Landscape, and Forecast 2026 to 2033
Explore the cervical cancer treatment market outlook for 2026–2033, covering therapies, cancer types, end users, regional trends, and key companies.
Gout Therapeutic Market Size, Share, Insights, Competitive Landscape, and Forecast 2026 to 2033
The global gout therapeutic market is valued at US$2.9 billion in 2026, reaching US$4.7 billion by 2033, growing at a 7.1% CAGR
Medical Marijuana Market Size, Share, Insights, Competitive Landscape, and Forecast 2026 to 2033
Explore the medical marijuana market outlook for 2026–2033, including product forms, distribution channels, regional trends, and competitive insights.
Pantoprazole Sodium Market Size, Share, Insights, Competitive Landscape, and Forecast 2026 to 2033
The global pantoprazole sodium market is valued at US$2.36 billion in 2026, reaching US$3.57 billion by 2033, growing at a 6.1% CAGR
Immunotherapy Market Size, Share, Insights, Competitive Landscape, and Forecast 2026 to 2033
The global immunotherapy market is valued at US$274.5 billion in 2026, reaching US$521.4 billion by 2033, growing at a 9.6% CAGR