



Gout Therapeutic Market
Gout Therapeutic Market Size, Share, Insights, Competitive Landscape, and Forecast 2026 to 2033
Gout Therapeutic Market Size and Trend Analysis
How Fast Will the Gout Therapeutic Market Grow?
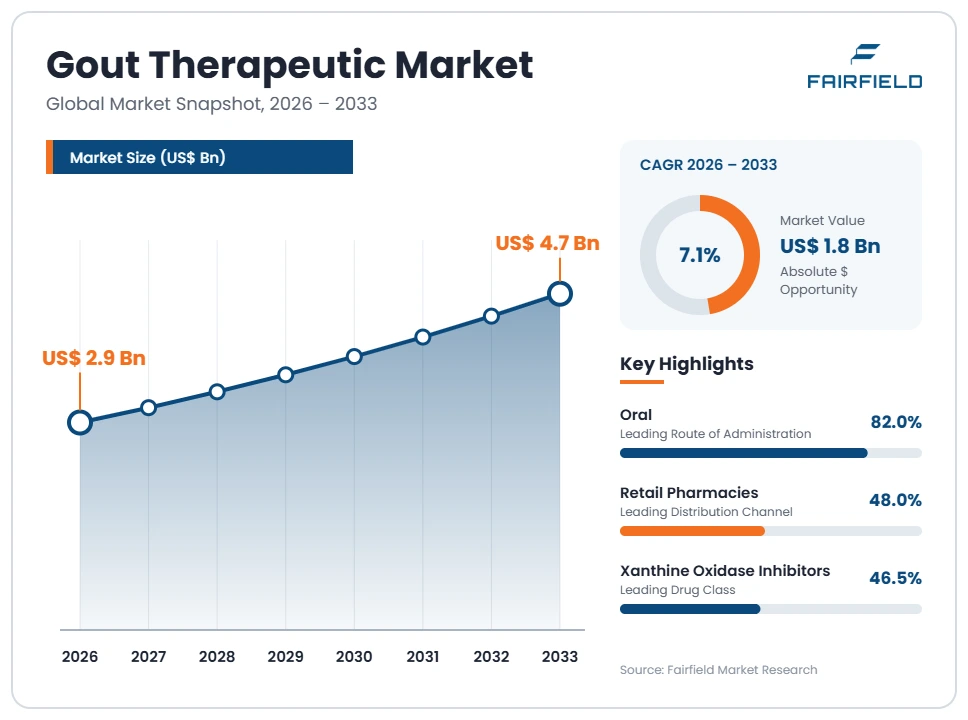
The global gout therapeutic market size is expected to be valued at US$ 2.9 billion in 2026 and projected to reach US$ 4.7 billion by 2033, growing at a CAGR of 7.1% between 2026 and 2033. Growth traces to wider diagnosis of hyperuricaemia, ageing populations and broader insurance coverage of long-term urate-lowering prescriptions. The historical period recorded a slower 4.8% CAGR between 2020 and 2025, as generic entry compressed oral pricing. Volume expansion, rather than price, now carries reported revenue. An absolute dollar opportunity of US$ 1.8 billion sits between 2026 and 2033, concentrated in specialty biologics, refractory-disease supply and emerging-market branded generics.
Key Report Takeaways
- By Drug Class: Xanthine oxidase inhibitors led with 46.5% share in 2026, while recombinant uricase agents are projected to expand at a 10.2% CAGR through 2033, driven by rising referral volumes into specialist prescribing pathways for refractory disease.
- By Route of Administration: Oral formulations led with 82.0% share in 2026, while subcutaneous products are projected to expand at a 9.6% CAGR through 2033, driven by payer interest in moving administration away from hospital infusion suites.
- By Distribution Channel: Retail pharmacies led with 48.0% share in 2026, while online pharmacies are projected to expand at an 11.4% CAGR through 2033, driven by refill automation and mail-order contracting across chronic maintenance prescriptions.
- By Treatment Setting: Rheumatology and specialty clinics led with 34.0% share in 2026, while homecare settings are projected to expand at a 9.1% CAGR through 2033, driven by reimbursement codes that support self-administration and remote monitoring programmes.
- By Region: North America led with 42.0% share in 2026, while Asia Pacific is projected to expand at a 9.3% CAGR through 2033, driven by urbanising diets, widening public insurance schemes and growing domestic generic manufacturing capacity.
Global Gout Therapeutic Market Trends and Insights
Market Growth Drivers
Rising Diagnosed Patient Pools Expand Prescription Volumes
Wider detection of elevated serum urate is the largest volume driver in this market. Primary care systems across high-income countries now screen metabolic risk more routinely, and each confirmed diagnosis converts into a long-duration maintenance prescription rather than a one-off purchase. That shifts revenue from episodic acute supply toward recurring chronic supply, which commercial teams can forecast with greater confidence.
The underlying trend is demographic and dietary. Populations are ageing across North America, Europe and East Asia, while urbanising diets raise the prevalence of metabolic conditions that commonly accompany hyperuricaemia. Health systems have added urate testing to routine chronic-disease panels and funded rheumatology referral pathways. Electronic health records also surface previously unrecorded cases during unrelated consultations. Manufacturers have built field teams and patient-support programmes around these pathways, lifting the share of identified patients who start therapy.
Generic Supply Scale Widens Affordable Access in Emerging Markets
Large-scale generic manufacturing has pushed first-line oral gout products into price bands that public health systems in middle-income countries can fund. Lower unit cost turns a previously specialist prescription into a routine primary-care product, and national tender volumes now account for a meaningful slice of global units. Revenue per pack is small, but volume growth more than offsets that dilution across Asia Pacific, Latin America and Africa.
Behind this sits sustained investment in oral solid-dose capacity across India, China and Eastern Europe, much of it cleared for export by stringent regulators. Manufacturers have added formulation lines, secured active ingredient supply and qualified multiple sites to withstand tender competition. Governments have simultaneously widened essential-medicine lists and reimbursement schedules. The combined effect is a broader treated population served through high-volume, low-margin contracts rather than branded promotion.
Market Restraints
Generic Erosion Compresses Revenue per Treated Patient
Loss of exclusivity across established oral classes caps value growth even as treated volumes rise. Once several generics enter a national market, procurement moves to price-led tendering and branded revenue falls sharply within a few quarters. The result is a market where patient numbers and prescription counts climb steadily while reported value grows far more slowly, particularly across mature North American and European channels.
Pharmacy benefit managers, national procurement agencies and hospital group purchasing organisations have all strengthened formulary tools that favour the lowest-cost equivalent. Automatic substitution rules, reference pricing and multi-source tendering now apply to most first-line gout products. Originators respond by narrowing promotional spend, divesting mature assets or shifting resources toward specialty portfolios. For generic suppliers, thin margins concentrate business among manufacturers holding the lowest cost base and the best compliance records.
Low Long-Term Persistence Limits Realised Prescription Value
Chronic urate-lowering therapy is dispensed over years, yet a substantial share of initiated patients stop collecting refills well before that horizon. Every lapsed course removes recurring revenue that commercial models had already booked, so realised value per diagnosed patient falls short of the theoretical maximum. For a market whose economics depend on persistence rather than price, this gap is the most material constraint on value capture.
The pattern reflects how the condition is managed commercially. Symptoms are intermittent, follow-up appointments are infrequent in primary care, and monitoring is not always scheduled, so patients drift off supply between episodes. Manufacturers and payers have responded with refill reminders, persistence analytics in pharmacy systems and bundled monitoring services. These initiatives remain uneven across markets, and in low-reimbursement settings out-of-pocket cost is still the practical reason prescriptions go unfilled.
Market Opportunities
Refractory and Tophaceous Disease Opens Specialty Revenue
The small share of patients managed under specialist pathways carries disproportionate revenue potential. Biologic and enzyme-based products supplied for this group are priced in specialty bands, so a modest patient count produces value comparable to far larger generic volumes. For manufacturers facing price erosion in first-line supply, this segment is the clearest route back to margin growth within the therapy area.
Commercial access is being built through rheumatology referral networks, specialty pharmacy contracts and infusion service providers. Companies are investing in cold-chain distribution, patient-support hubs and reimbursement navigation teams that handle prior authorisation. Regulatory authorities including the U.S. Food and Drug Administration and the European Medicines Agency maintain defined approval routes for biologic products in this setting. Manufacturing capability in recombinant proteins therefore becomes a genuine competitive asset rather than a formulation detail.
Digital Channels and Managed Care Programmes Create New Routes to Patients
Online and mail-order pharmacy channels convert chronic gout prescriptions into subscription-like supply relationships. Because maintenance therapy is refilled on a predictable cycle, digital fulfilment captures repeat demand at a lower cost to serve than the retail counter. Suppliers that secure these contracts gain visibility of refill behaviour, which supports more accurate demand planning and reduces the working capital tied up in channel inventory.
Health systems and insurers have accelerated the shift by reimbursing remote consultations and contracting directly with digital pharmacy operators. Integrated platforms now bundle dispensing, laboratory test scheduling and persistence messaging into a single managed-care offering. Manufacturers are partnering with these operators to place products on preferred lists and to share supply data. In emerging markets, e-commerce pharmacy growth is also extending branded generic reach well beyond major metropolitan areas.
Segment Analysis
- Which Drug Class Holds the Largest Share of Gout Therapeutic Sales?
Xanthine oxidase inhibitors hold the largest share, at 46.5% of global gout therapeutic revenue in 2026. The position rests on their status as the established first-line urate-lowering category authorised across most major markets, with very broad generic availability and essential-medicine listing. Anti-inflammatory agents used in acute flare management follow at 27.0%, with uricosurics at 14.5%. Growth leadership sits elsewhere. Recombinant uricase agents are forecast to expand at a 10.2% CAGR to 2033, with interleukin-1 targeted biologics close behind. That divergence matters commercially. Volume and prescription share remain anchored in low-priced oral classes, while incremental value increasingly comes from specialty products supplied through controlled distribution. Portfolio strategy is therefore splitting into two operating models, one built on manufacturing scale and the other on specialty access.
- Oral Formulations Anchor Volume While Subcutaneous Supply Scales Faster
Oral formulations dominate with 82.0% share in 2026, reflecting the chronic, self-managed nature of urate-lowering supply and the low cost of solid-dose manufacturing at scale. Intravenous products hold 9.5%, tied to infusion-based treatment of refractory disease, while subcutaneous presentations account for 6.0%. Subcutaneous supply is the growth leader at a 9.6% CAGR through 2033. The shift follows payer and provider economics, because moving administration out of hospital infusion suites removes facility fees and frees chair capacity. Device investment reinforces the trend, with manufacturers adding prefilled syringes and autoinjector platforms that suit homecare delivery. For the wider market, route mix now drives channel strategy, since oral products flow through retail and online pharmacy while injectables depend on specialty distribution and cold chain.
- Retail Pharmacies Carry Maintenance Scripts as Online Channels Accelerate
Retail pharmacies lead distribution with 48.0% share in 2026, because the bulk of gout prescriptions are repeat oral maintenance supply collected locally. Hospital pharmacies hold 26.5%, concentrated in acute presentations and infusion-based specialty products, while specialty pharmacies account for 14.5% of value on a much smaller unit base. Online pharmacies are the fastest-growing channel at an 11.4% CAGR through 2033. Predictable refill cycles suit automated mail-order fulfilment, and insurers increasingly contract digital operators directly to lower dispensing costs. Regulatory clarification of e-prescribing rules has removed a long-standing barrier. The commercial consequence is a gradual separation of channels by product economics. High-volume generics migrate toward low-cost digital and retail fulfilment, while biologics consolidate into specialty networks managing cold chain, prior authorisation and onboarding.
- Specialty Clinics Lead Treatment Settings as Homecare Gains Ground
Rheumatology and specialty clinics lead treatment settings with 34.0% share in 2026, since persistent and complex cases are managed through specialist referral where long-term monitoring and specialty product access are concentrated. Hospitals follow at 31.5%, covering acute admissions and infusion services, while homecare settings hold 24.0% and ambulatory infusion centres 10.5%. Homecare is the fastest-growing setting at a 9.1% CAGR through 2033. Reimbursement codes supporting self-administration, combined with remote monitoring tools and nurse-support services funded by manufacturers, have made home supply commercially viable. Health systems also favour the shift as a way to reduce facility utilisation. For suppliers, packaging, device design and patient-support infrastructure now influence setting mix as much as the product itself, and distribution agreements increasingly extend to home delivery partners.
Geography Analysis
- Which Region Is Leading the Gout Therapeutic Market?
North America leads the gout therapeutic market with 42.0% share in 2026, supported by the United States and Canada. The position reflects high diagnosis rates, mature rheumatology referral networks and insurance structures that fund long-term maintenance supply. Specialty biologics concentrate here because payers reimburse infusion and specialty pharmacy services that other regions fund less consistently. The U.S. Food and Drug Administration maintains established approval routes for small molecules and biologic products in this therapy area. Price erosion on first-line oral classes is sharper than elsewhere, as pharmacy benefit managers apply aggressive substitution and tendering rules. Value growth therefore depends on specialty supply and digital pharmacy contracting rather than first-line volumes, already near saturation across insured populations.
- Europe Combines Broad Reimbursement With Strict Price Control
Europe holds 26.5% share in 2026, with Germany, France, Italy, Spain and the United Kingdom contributing most regional value. Universal coverage keeps diagnosed patients on reimbursed supply, giving stable prescription volumes and low payment risk. The European Medicines Agency provides a centralised authorisation route that lets manufacturers launch across member states efficiently. Against that, national reference pricing, health technology assessment and multi-source tendering compress achievable prices, especially in Southern and Central Europe. Manufacturing capacity in Eastern Europe supplies much of the generic volume consumed locally. Growth therefore comes from improved primary-care detection and from specialty products entering reimbursement in larger Western markets, rather than from price.
- Which Region Is Growing Fastest in the Gout Therapeutic Market?
Asia Pacific is growing fastest, at a 9.3% CAGR between 2026 and 2033, from 22.0% share in 2026. China, Japan, India, South Korea and Australia drive the expansion. Urbanisation and dietary change have enlarged the population presenting with metabolic conditions, while public insurance schemes in China and India have widened coverage of chronic oral therapies. Domestic manufacturing is a second engine, as large generic producers supply local demand and export markets from the same plants. National regulators have streamlined review timelines, shortening the gap to local availability. Japan and South Korea contribute higher-value supply through established specialist networks. Growth is therefore volume-led in South Asia and value-led in North Asia.
- Latin America Builds Volume Through Public Procurement
Latin America accounts for 5.5% share in 2026, led by Brazil, Mexico, Argentina and Colombia. Growth comes from public health systems buying low-cost oral generics through centralised tenders, bringing large populations into treatment at modest revenue per pack. Brazil runs the region’s largest procurement programme and hosts meaningful local formulation capacity. Expanding private insurance in Mexico and Chile adds a smaller, higher-value branded segment. Currency volatility and import dependence for active ingredients constrain pricing and supply continuity. Regulatory harmonisation has shortened registration timelines, encouraging multinational suppliers to file regionally. Specialty biologics remain limited to urban centres with infusion infrastructure and reimbursement pathways.
- Middle East & Africa Expands From a Small Installed Base
Middle East & Africa holds 4.0% share in 2026, the smallest regional position, with Saudi Arabia, the United Arab Emirates, Turkey, Israel and South Africa supplying most measured value. Gulf states fund treatment through national health insurance and well-equipped hospital systems, supporting access to branded and specialty products. Elsewhere, limited diagnosis infrastructure and out-of-pocket payment keep treated populations small relative to underlying prevalence. Local fill-finish and packaging investment in Saudi Arabia, the United Arab Emirates and Egypt is reducing import dependence for high-volume oral products. South Africa operates the most developed generic procurement system in sub-Saharan Africa. Growth rests on broader primary-care diagnostic capacity and insurance expansion.
Competitive Landscape
The gout therapeutic market is moderately fragmented, and its structure differs sharply by drug class. First-line oral supply is highly competitive, with many generic manufacturers contesting tenders on price and reliability, so no supplier holds a commanding global position. Specialty biologics for refractory disease are far more concentrated, with a small number of companies holding the manufacturing and regulatory capability required. Consolidation therefore occurs inside the generic tier, where scale economics reward larger portfolios, while the specialty tier changes hands through portfolio acquisition rather than gradual share shifts.
Competition in the generic tier rests on cost base, site qualification across stringent regulatory regimes, active ingredient security and supply continuity. Buyers value uninterrupted delivery and compliance history as much as unit price, because tender penalties for failed supply are significant. In the specialty tier, companies compete on recombinant protein manufacturing capability, cold-chain distribution, device and presentation design, and the strength of reimbursement support services. New entrants are most visible among biosimilar developers and Asian manufacturers moving from oral solid dose into sterile injectables.
Strategic activity follows the same split. Larger originators have been reallocating capital from mature oral assets toward specialty and biologic portfolios, protecting margin as price erosion deepens. Generic manufacturers invest in capacity, vertical integration into active ingredients and registration breadth, since those capabilities determine tender success. Partnerships with specialty pharmacy and digital dispensing operators are becoming a standard route to channel access.
Competitive direction is set by three themes: manufacturing scale in the commodity tier, specialty access infrastructure in the biologic tier, and channel control as dispensing shifts toward digital and home settings.
Industry Leaders
- Takeda Pharmaceutical Company Limited
- Amgen Inc.
- Teva Pharmaceutical Industries Ltd.
- Viatris Inc.
- Sun Pharmaceutical Industries Ltd.
- Novartis AG
Companies Covered in the Report
- Takeda Pharmaceutical Company Limited
- Amgen Inc.
- Teva Pharmaceutical Industries Ltd.
- Viatris Inc.
- Sun Pharmaceutical Industries Ltd.
- Novartis AG
- Sandoz Group AG
- Dr. Reddy’s Laboratories Ltd.
- Hikma Pharmaceuticals PLC
- Zydus Lifesciences Limited
- Lupin Limited
- Cipla Limited
- Aurobindo Pharma Limited
- Amneal Pharmaceuticals, Inc.
- Fresenius Kabi AG
- Mitsubishi Tanabe Pharma Corporation
Gout Therapeutic Market Report Scope
| Metric | Value |
| Study Period | 2020–2033 |
| Market Size 2026 | US$ 2.9 Billion |
| Market Size 2033 | US$ 4.7 Billion |
| CAGR 2026–2033 | 7.1% |
| Absolute Dollar Opportunity | US$ 1.8 Billion |
| Largest Market | North America (42.0% share in 2026) |
| Fastest-Growing Market | Asia Pacific (9.3% CAGR 2026–2033) |
| Market Concentration | Moderately Fragmented |
| Major Players | Takeda Pharmaceutical Company Limited, Amgen Inc., Teva Pharmaceutical Industries Ltd., Viatris Inc., Sun Pharmaceutical Industries Ltd. |
Gout Therapeutic Market Segmentation
- Executive Summary
- Gout Therapeutic Market Snapshot
- Future Projections
- Key Market Trends
- Regional Snapshot
- Market Overview
- Market Definition and Report Scope
- Historical Market Trends
- Market Dynamics
- Drivers
- Rising Diagnosed Patient Pools Expand Prescription Volumes
- Generic Supply Scale Widens Affordable Access in Emerging Markets
- Restraints
- Generic Erosion Compresses Revenue per Treated Patient
- Low Long-Term Persistence Limits Realised Prescription Value
- Market Opportunities
- Refractory and Tophaceous Disease Opens Specialty Revenue
- Digital Channels and Managed Care Programmes Create New Routes to Patients
- Drivers
- Global Gout Therapeutic Market Outlook, 2026–2033
- Global Gout Therapeutic Market Outlook, by Drug Class, Value (US$ Billion), 2026–2033
- Xanthine Oxidase Inhibitors
- Anti-inflammatory Agents
- Uricosurics
- Recombinant Uricase Agents
- Interleukin-1 Targeted Biologics
- Global Gout Therapeutic Market Outlook, by Route of Administration, Value (US$ Billion), 2026–2033
- Oral
- Intravenous
- Subcutaneous
- Other Routes
- Global Gout Therapeutic Market Outlook, by Distribution Channel, Value (US$ Billion), 2026–2033
- Retail Pharmacies
- Hospital Pharmacies
- Specialty Pharmacies
- Online Pharmacies
- Global Gout Therapeutic Market Outlook, by Treatment Setting, Value (US$ Billion), 2026–2033
- Rheumatology and Specialty Clinics
- Hospitals
- Homecare Settings
- Ambulatory Infusion Centres
- Global Gout Therapeutic Market Outlook, by Region, Value (US$ Billion), 2026–2033
- North America
- Europe
- Asia Pacific
- Latin America
- Middle East & Africa
- Global Gout Therapeutic Market Outlook, by Drug Class, Value (US$ Billion), 2026–2033
- North America Gout Therapeutic Market Outlook, 2026–2033
- North America Gout Therapeutic Market Outlook, by Drug Class, Value (US$ Billion), 2026–2033
- Xanthine Oxidase Inhibitors
- Anti-inflammatory Agents
- Uricosurics
- Recombinant Uricase Agents
- Interleukin-1 Targeted Biologics
- North America Gout Therapeutic Market Outlook, by Route of Administration, Value (US$ Billion), 2026–2033
- Oral
- Intravenous
- Subcutaneous
- Other Routes
- North America Gout Therapeutic Market Outlook, by Distribution Channel, Value (US$ Billion), 2026–2033
- Retail Pharmacies
- Hospital Pharmacies
- Specialty Pharmacies
- Online Pharmacies
- North America Gout Therapeutic Market Outlook, by Treatment Setting, Value (US$ Billion), 2026–2033
- Rheumatology and Specialty Clinics
- Hospitals
- Homecare Settings
- Ambulatory Infusion Centres
- North America Gout Therapeutic Market Outlook, by Country, Value (US$ Billion), 2026–2033
- United States Gout Therapeutic Market Outlook, by Drug Class, 2026–2033
- United States Gout Therapeutic Market Outlook, by Route of Administration, 2026–2033
- United States Gout Therapeutic Market Outlook, by Distribution Channel, 2026–2033
- United States Gout Therapeutic Market Outlook, by Treatment Setting, 2026–2033
- Canada Gout Therapeutic Market Outlook, by Drug Class, 2026–2033
- Canada Gout Therapeutic Market Outlook, by Route of Administration, 2026–2033
- Canada Gout Therapeutic Market Outlook, by Distribution Channel, 2026–2033
- Canada Gout Therapeutic Market Outlook, by Treatment Setting, 2026–2033
- North America Gout Therapeutic Market Outlook, by Drug Class, Value (US$ Billion), 2026–2033
- Europe Gout Therapeutic Market Outlook, 2026–2033
- Europe Gout Therapeutic Market Outlook, by Drug Class, Value (US$ Billion), 2026–2033
- Xanthine Oxidase Inhibitors
- Anti-inflammatory Agents
- Uricosurics
- Recombinant Uricase Agents
- Interleukin-1 Targeted Biologics
- Europe Gout Therapeutic Market Outlook, by Route of Administration, Value (US$ Billion), 2026–2033
- Oral
- Intravenous
- Subcutaneous
- Other Routes
- Europe Gout Therapeutic Market Outlook, by Distribution Channel, Value (US$ Billion), 2026–2033
- Retail Pharmacies
- Hospital Pharmacies
- Specialty Pharmacies
- Online Pharmacies
- Europe Gout Therapeutic Market Outlook, by Treatment Setting, Value (US$ Billion), 2026–2033
- Rheumatology and Specialty Clinics
- Hospitals
- Homecare Settings
- Ambulatory Infusion Centres
- Europe Gout Therapeutic Market Outlook, by Country, Value (US$ Billion), 2026–2033
- Germany Gout Therapeutic Market Outlook, by Drug Class, 2026–2033
- Germany Gout Therapeutic Market Outlook, by Route of Administration, 2026–2033
- Germany Gout Therapeutic Market Outlook, by Distribution Channel, 2026–2033
- Germany Gout Therapeutic Market Outlook, by Treatment Setting, 2026–2033
- France Gout Therapeutic Market Outlook, by Drug Class, 2026–2033
- France Gout Therapeutic Market Outlook, by Route of Administration, 2026–2033
- France Gout Therapeutic Market Outlook, by Distribution Channel, 2026–2033
- France Gout Therapeutic Market Outlook, by Treatment Setting, 2026–2033
- Italy Gout Therapeutic Market Outlook, by Drug Class, 2026–2033
- Italy Gout Therapeutic Market Outlook, by Route of Administration, 2026–2033
- Italy Gout Therapeutic Market Outlook, by Distribution Channel, 2026–2033
- Italy Gout Therapeutic Market Outlook, by Treatment Setting, 2026–2033
- Spain Gout Therapeutic Market Outlook, by Drug Class, 2026–2033
- Spain Gout Therapeutic Market Outlook, by Route of Administration, 2026–2033
- Spain Gout Therapeutic Market Outlook, by Distribution Channel, 2026–2033
- Spain Gout Therapeutic Market Outlook, by Treatment Setting, 2026–2033
- United Kingdom Gout Therapeutic Market Outlook, by Drug Class, 2026–2033
- United Kingdom Gout Therapeutic Market Outlook, by Route of Administration, 2026–2033
- United Kingdom Gout Therapeutic Market Outlook, by Distribution Channel, 2026–2033
- United Kingdom Gout Therapeutic Market Outlook, by Treatment Setting, 2026–2033
- Europe Gout Therapeutic Market Outlook, by Drug Class, Value (US$ Billion), 2026–2033
- Asia Pacific Gout Therapeutic Market Outlook, 2026–2033
- Asia Pacific Gout Therapeutic Market Outlook, by Drug Class, Value (US$ Billion), 2026–2033
- Xanthine Oxidase Inhibitors
- Anti-inflammatory Agents
- Uricosurics
- Recombinant Uricase Agents
- Interleukin-1 Targeted Biologics
- Asia Pacific Gout Therapeutic Market Outlook, by Route of Administration, Value (US$ Billion), 2026–2033
- Oral
- Intravenous
- Subcutaneous
- Other Routes
- Asia Pacific Gout Therapeutic Market Outlook, by Distribution Channel, Value (US$ Billion), 2026–2033
- Retail Pharmacies
- Hospital Pharmacies
- Specialty Pharmacies
- Online Pharmacies
- Asia Pacific Gout Therapeutic Market Outlook, by Treatment Setting, Value (US$ Billion), 2026–2033
- Rheumatology and Specialty Clinics
- Hospitals
- Homecare Settings
- Ambulatory Infusion Centres
- Asia Pacific Gout Therapeutic Market Outlook, by Country, Value (US$ Billion), 2026–2033
- China Gout Therapeutic Market Outlook, by Drug Class, 2026–2033
- China Gout Therapeutic Market Outlook, by Route of Administration, 2026–2033
- China Gout Therapeutic Market Outlook, by Distribution Channel, 2026–2033
- China Gout Therapeutic Market Outlook, by Treatment Setting, 2026–2033
- Japan Gout Therapeutic Market Outlook, by Drug Class, 2026–2033
- Japan Gout Therapeutic Market Outlook, by Route of Administration, 2026–2033
- Japan Gout Therapeutic Market Outlook, by Distribution Channel, 2026–2033
- Japan Gout Therapeutic Market Outlook, by Treatment Setting, 2026–2033
- India Gout Therapeutic Market Outlook, by Drug Class, 2026–2033
- India Gout Therapeutic Market Outlook, by Route of Administration, 2026–2033
- India Gout Therapeutic Market Outlook, by Distribution Channel, 2026–2033
- India Gout Therapeutic Market Outlook, by Treatment Setting, 2026–2033
- South Korea Gout Therapeutic Market Outlook, by Drug Class, 2026–2033
- South Korea Gout Therapeutic Market Outlook, by Route of Administration, 2026–2033
- South Korea Gout Therapeutic Market Outlook, by Distribution Channel, 2026–2033
- South Korea Gout Therapeutic Market Outlook, by Treatment Setting, 2026–2033
- Australia Gout Therapeutic Market Outlook, by Drug Class, 2026–2033
- Australia Gout Therapeutic Market Outlook, by Route of Administration, 2026–2033
- Australia Gout Therapeutic Market Outlook, by Distribution Channel, 2026–2033
- Australia Gout Therapeutic Market Outlook, by Treatment Setting, 2026–2033
- Asia Pacific Gout Therapeutic Market Outlook, by Drug Class, Value (US$ Billion), 2026–2033
- Latin America Gout Therapeutic Market Outlook, 2026–2033
- Latin America Gout Therapeutic Market Outlook, by Drug Class, Value (US$ Billion), 2026–2033
- Xanthine Oxidase Inhibitors
- Anti-inflammatory Agents
- Uricosurics
- Recombinant Uricase Agents
- Interleukin-1 Targeted Biologics
- Latin America Gout Therapeutic Market Outlook, by Route of Administration, Value (US$ Billion), 2026–2033
- Oral
- Intravenous
- Subcutaneous
- Other Routes
- Latin America Gout Therapeutic Market Outlook, by Distribution Channel, Value (US$ Billion), 2026–2033
- Retail Pharmacies
- Hospital Pharmacies
- Specialty Pharmacies
- Online Pharmacies
- Latin America Gout Therapeutic Market Outlook, by Treatment Setting, Value (US$ Billion), 2026–2033
- Rheumatology and Specialty Clinics
- Hospitals
- Homecare Settings
- Ambulatory Infusion Centres
- Latin America Gout Therapeutic Market Outlook, by Country, Value (US$ Billion), 2026–2033
- Brazil Gout Therapeutic Market Outlook, by Drug Class, 2026–2033
- Brazil Gout Therapeutic Market Outlook, by Route of Administration, 2026–2033
- Brazil Gout Therapeutic Market Outlook, by Distribution Channel, 2026–2033
- Brazil Gout Therapeutic Market Outlook, by Treatment Setting, 2026–2033
- Mexico Gout Therapeutic Market Outlook, by Drug Class, 2026–2033
- Mexico Gout Therapeutic Market Outlook, by Route of Administration, 2026–2033
- Mexico Gout Therapeutic Market Outlook, by Distribution Channel, 2026–2033
- Mexico Gout Therapeutic Market Outlook, by Treatment Setting, 2026–2033
- Argentina Gout Therapeutic Market Outlook, by Drug Class, 2026–2033
- Argentina Gout Therapeutic Market Outlook, by Route of Administration, 2026–2033
- Argentina Gout Therapeutic Market Outlook, by Distribution Channel, 2026–2033
- Argentina Gout Therapeutic Market Outlook, by Treatment Setting, 2026–2033
- Colombia Gout Therapeutic Market Outlook, by Drug Class, 2026–2033
- Colombia Gout Therapeutic Market Outlook, by Route of Administration, 2026–2033
- Colombia Gout Therapeutic Market Outlook, by Distribution Channel, 2026–2033
- Colombia Gout Therapeutic Market Outlook, by Treatment Setting, 2026–2033
- Chile Gout Therapeutic Market Outlook, by Drug Class, 2026–2033
- Chile Gout Therapeutic Market Outlook, by Route of Administration, 2026–2033
- Chile Gout Therapeutic Market Outlook, by Distribution Channel, 2026–2033
- Chile Gout Therapeutic Market Outlook, by Treatment Setting, 2026–2033
- Latin America Gout Therapeutic Market Outlook, by Drug Class, Value (US$ Billion), 2026–2033
- Middle East & Africa Gout Therapeutic Market Outlook, 2026–2033
- Middle East & Africa Gout Therapeutic Market Outlook, by Drug Class, Value (US$ Billion), 2026–2033
- Xanthine Oxidase Inhibitors
- Anti-inflammatory Agents
- Uricosurics
- Recombinant Uricase Agents
- Interleukin-1 Targeted Biologics
- Middle East & Africa Gout Therapeutic Market Outlook, by Route of Administration, Value (US$ Billion), 2026–2033
- Oral
- Intravenous
- Subcutaneous
- Other Routes
- Middle East & Africa Gout Therapeutic Market Outlook, by Distribution Channel, Value (US$ Billion), 2026–2033
- Retail Pharmacies
- Hospital Pharmacies
- Specialty Pharmacies
- Online Pharmacies
- Middle East & Africa Gout Therapeutic Market Outlook, by Treatment Setting, Value (US$ Billion), 2026–2033
- Rheumatology and Specialty Clinics
- Hospitals
- Homecare Settings
- Ambulatory Infusion Centres
- Middle East & Africa Gout Therapeutic Market Outlook, by Country and Subregion, Value (US$ Billion), 2026–2033
- Saudi Arabia Gout Therapeutic Market Outlook, by Drug Class, 2026–2033
- Saudi Arabia Gout Therapeutic Market Outlook, by Route of Administration, 2026–2033
- Saudi Arabia Gout Therapeutic Market Outlook, by Distribution Channel, 2026–2033
- Saudi Arabia Gout Therapeutic Market Outlook, by Treatment Setting, 2026–2033
- United Arab Emirates Gout Therapeutic Market Outlook, by Drug Class, 2026–2033
- United Arab Emirates Gout Therapeutic Market Outlook, by Route of Administration, 2026–2033
- United Arab Emirates Gout Therapeutic Market Outlook, by Distribution Channel, 2026–2033
- United Arab Emirates Gout Therapeutic Market Outlook, by Treatment Setting, 2026–2033
- Turkey Gout Therapeutic Market Outlook, by Drug Class, 2026–2033
- Turkey Gout Therapeutic Market Outlook, by Route of Administration, 2026–2033
- Turkey Gout Therapeutic Market Outlook, by Distribution Channel, 2026–2033
- Turkey Gout Therapeutic Market Outlook, by Treatment Setting, 2026–2033
- Israel Gout Therapeutic Market Outlook, by Drug Class, 2026–2033
- Israel Gout Therapeutic Market Outlook, by Route of Administration, 2026–2033
- Israel Gout Therapeutic Market Outlook, by Distribution Channel, 2026–2033
- Israel Gout Therapeutic Market Outlook, by Treatment Setting, 2026–2033
- South Africa Gout Therapeutic Market Outlook, by Drug Class, 2026–2033
- South Africa Gout Therapeutic Market Outlook, by Route of Administration, 2026–2033
- South Africa Gout Therapeutic Market Outlook, by Distribution Channel, 2026–2033
- South Africa Gout Therapeutic Market Outlook, by Treatment Setting, 2026–2033
- Gulf states Gout Therapeutic Market Outlook, by Drug Class, 2026–2033
- Gulf states Gout Therapeutic Market Outlook, by Route of Administration, 2026–2033
- Gulf states Gout Therapeutic Market Outlook, by Distribution Channel, 2026–2033
- Gulf states Gout Therapeutic Market Outlook, by Treatment Setting, 2026–2033
- Egypt Gout Therapeutic Market Outlook, by Drug Class, 2026–2033
- Egypt Gout Therapeutic Market Outlook, by Route of Administration, 2026–2033
- Egypt Gout Therapeutic Market Outlook, by Distribution Channel, 2026–2033
- Egypt Gout Therapeutic Market Outlook, by Treatment Setting, 2026–2033
- Middle East & Africa Gout Therapeutic Market Outlook, by Drug Class, Value (US$ Billion), 2026–2033
- Competitive Landscape
- Industry Leaders
- Company Profiles
- Takeda Pharmaceutical Company Limited
- Amgen Inc.
- Teva Pharmaceutical Industries Ltd.
- Viatris Inc.
- Sun Pharmaceutical Industries Ltd.
- Novartis AG
- Sandoz Group AG
- Dr. Reddy's Laboratories Ltd.
- Hikma Pharmaceuticals PLC
- Zydus Lifesciences Limited
- Lupin Limited
- Cipla Limited
- Aurobindo Pharma Limited
- Amneal Pharmaceuticals, Inc.
- Fresenius Kabi AG
- Mitsubishi Tanabe Pharma Corporation
- Appendix
- Research Methodology
- Report Assumptions
- Acronyms and Abbreviations
Drug Class
- Xanthine Oxidase Inhibitors
- Anti-inflammatory Agents
- Uricosurics
- Recombinant Uricase Agents
- Interleukin-1 Targeted Biologics
Route of Administration
- Oral
- Intravenous
- Subcutaneous
- Other Routes
Distribution Channel
- Retail Pharmacies
- Hospital Pharmacies
- Specialty Pharmacies
- Online Pharmacies
Treatment Setting
- Rheumatology and Specialty Clinics
- Hospitals
- Homecare Settings
- Ambulatory Infusion Centres
Region
- North America
- Europe
- Asia Pacific
- Latin America
- Middle East & Africa
Our Research Methodology
Considering the volatility of business today, traditional approaches to strategizing a game plan can be unfruitful if not detrimental. True ambiguity is no way to determine a forecast. A myriad of predetermined factors must be accounted for such as the degree of risk involved, the magnitude of circumstances, as well as conditions or consequences that are not known or unpredictable. To circumvent binary views that cast uncertainty, the application of market research intelligence to strategically posture, move, and enable actionable outcomes is necessary.
View Methodology
Quality Assured
Rigorous Validation Process

Confidentiality Assured
End-to-end Data Security

Custom Research Services
Tailored To Your Objectives
FAQs
The gout therapeutic market is valued at US$ 2.9 billion in 2026, supported by wider diagnosis and sustained demand for chronic urate-lowering supply.
The market is forecast to grow at a 7.1% CAGR between 2026 and 2033, reaching US$ 4.7 billion and adding US$ 1.8 billion.
Xanthine oxidase inhibitors lead with 46.5% share in 2026, while recombinant uricase agents grow fastest at a 10.2% CAGR through 2033.
North America holds 42.0% share in 2026, while Asia Pacific grows fastest at a 9.3% CAGR between 2026 and 2033.
The market is moderately fragmented, with many generic suppliers in oral classes and fewer companies supplying specialty biologics for refractory disease.
Related Reports
Kidney Dialysis Centres Market Size, Share, Insights, Competitive Landscape, and Forecast 2026 to 2033
Explore the kidney dialysis centres market outlook for 2026–2033, covering dialysis types, service settings, centre types, regions, and key companies.
Cervical Cancer Treatment Market Size, Share, Insights, Competitive Landscape, and Forecast 2026 to 2033
Explore the cervical cancer treatment market outlook for 2026–2033, covering therapies, cancer types, end users, regional trends, and key companies.
Small Molecule API Market Size, Share, Insights, Competitive Landscape, and Forecast 2026 to 2033
Explore the small molecule API market outlook for 2026–2033, including synthesis, manufacturing, therapeutic applications, regions, and competitors.
Medical Marijuana Market Size, Share, Insights, Competitive Landscape, and Forecast 2026 to 2033
Explore the medical marijuana market outlook for 2026–2033, including product forms, distribution channels, regional trends, and competitive insights.
Pantoprazole Sodium Market Size, Share, Insights, Competitive Landscape, and Forecast 2026 to 2033
The global pantoprazole sodium market is valued at US$2.36 billion in 2026, reaching US$3.57 billion by 2033, growing at a 6.1% CAGR
Immunotherapy Market Size, Share, Insights, Competitive Landscape, and Forecast 2026 to 2033
The global immunotherapy market is valued at US$274.5 billion in 2026, reaching US$521.4 billion by 2033, growing at a 9.6% CAGR