



Particulate Matter Monitoring Market
Particulate Matter Monitoring Market Size, Share, Insights, Competitive Landscape, and Forecast 2026 to 2033
Particulate Matter Monitoring Market Size and Trend Analysis
How Fast Is the Particulate Matter Monitoring Market Growing?
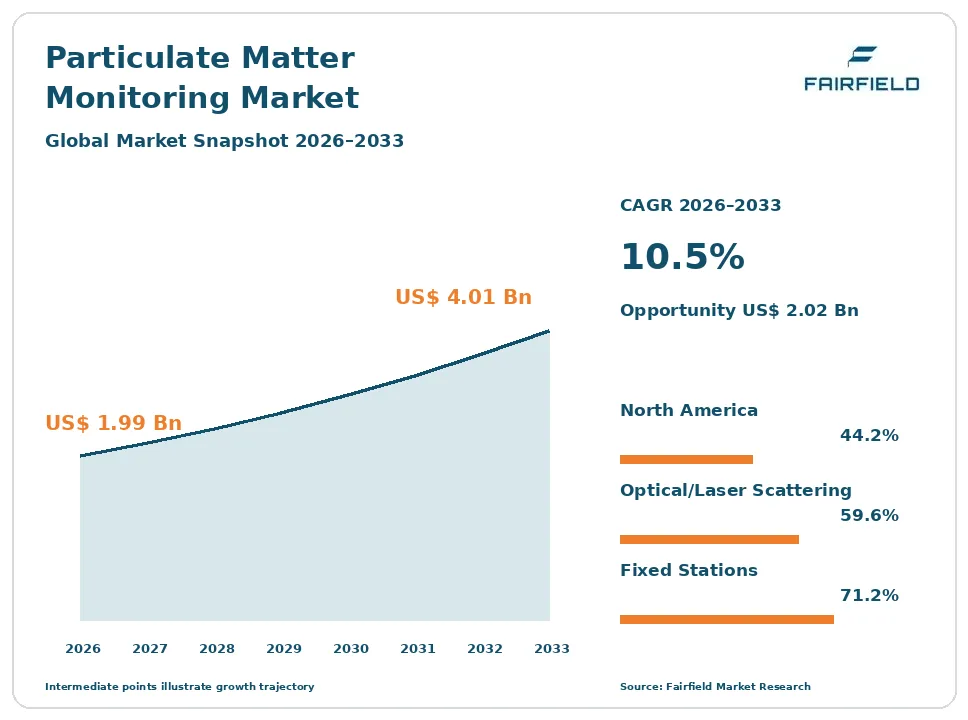
The global particulate matter monitoring market size is expected to be valued at US$ 1.99 billion in 2026 and projected to reach US$ 4.01 billion by 2033, growing at a CAGR of 10.5% between 2026 and 2033.
Between 2020 and 2025, the market grew at a CAGR of about 8.8%, as wildfire smoke and pandemic concerns raised interest in air quality. Three factors now drive growth: stricter ambient air quality standards for PM2.5 in the United States and European Union, severe air pollution in India and other emerging economies, and rising demand for indoor air monitoring in offices, schools, and homes. The market is shifting from a small number of expensive reference stations toward dense networks that combine regulatory beta attenuation monitors with optical particle counters and low-cost sensors linked to cloud platforms. Real-time data, mobile apps, and AI forecasting help cities and companies respond quickly to pollution episodes.
Key Report Takeaways
- By Technology: Optical & Laser Scattering held 59.6% share in 2026, while Tapered Element Oscillating Microbalance is projected to expand at an 11.3% CAGR through 2033, driven by demand for continuous, reference-grade measurements.
- By Deployment: Fixed Monitoring Stations held 71.2% share in 2026, while Portable & Wearable Monitors are projected to expand at a 12.3% CAGR through 2033, driven by worker exposure and personal monitoring needs.
- By End User: Government & Regulatory Agencies held 31.8% share in 2026, while Commercial & Residential Buildings are projected to expand at a 12.8% CAGR through 2033, driven by healthy building standards and smart HVAC systems.
- By Region: North America held 44.2% share in 2026, while India is projected to expand at a 14.2% CAGR through 2033, driven by the National Clean Air Programme and expanding monitoring networks.
Global Particulate Matter Monitoring Market Trends and Insights
Drivers Impact Analysis
| Driver | Impact on CAGR Forecast | Geographic Relevance | Impact Timeline |
| Stricter air quality regulations | High | North America, Europe, Asia Pacific | Long term (≥4 years) |
| Rising health awareness and indoor air demand | High | Global | Medium term (2-4 years) |
Two drivers carry the strongest influence on particulate matter monitoring demand during the forecast period.
Stricter Regulations Are Driving the Particulate Matter Monitoring Market
Stricter air quality regulations are the strongest driver of the particulate matter monitoring market. Governments are tightening limits on fine particles that harm health.
The mechanism is new legal standards that require more and better monitoring. The United States Environmental Protection Agency lowered the annual PM2.5 standard from 12 to 9 micrograms per cubic meter in 2024, requiring states to expand monitoring near pollution sources and in disadvantaged communities. The European Union adopted a revised Ambient Air Quality Directive in 2024 that cuts the annual PM2.5 limit from 25 to 10 micrograms per cubic meter from 2030. India’s National Clean Air Programme targets large reductions in more than 130 cities. China continues strict monitoring under its air pollution action plans. Industrial plants must monitor stack emissions for permits. These rules drive steady investment in reference and supporting monitors.
Health Awareness Is Expanding the Particulate Matter Monitoring Market
Rising health awareness and indoor air demand are expanding the particulate matter monitoring market. People now understand that fine particles affect lungs, hearts, and brains.
The cause is strong scientific evidence and visible pollution events. The World Health Organization estimates that air pollution causes millions of premature deaths each year, and fine particles are the most harmful component. Wildfire smoke from Canada and the United States has blanketed cities, raising demand for real-time air quality data. People spend about 90% of their time indoors, so offices, schools, and hospitals install sensors linked to ventilation and filtration. Healthy building certifications such as WELL and RESET require air quality monitoring. Consumer air purifiers and smart home devices include particle sensors. Schools in several countries have installed sensors to protect children with asthma. These trends extend demand beyond government agencies.
Restraints Impact Analysis
| Restraint | Impact on CAGR Forecast | Geographic Relevance | Impact Timeline |
| High cost of reference-grade monitors | High | Asia Pacific, Latin America, Middle East & Africa | Medium term (2-4 years) |
| Data accuracy concerns with low-cost sensors | Medium | Global | Medium term (2-4 years) |
Two restraints limit how quickly the particulate matter monitoring market grows.
High Equipment Costs Slow the Particulate Matter Monitoring Market
High costs of reference-grade monitors slow the particulate matter monitoring market. Regulatory instruments are expensive to buy and run.
The specific causes are complex technology and operating requirements. A federal equivalent method PM2.5 monitor can cost tens of thousands of dollars, and a full station with shelter, power, climate control, and data systems costs much more. Stations need trained technicians for calibration, filter changes, and maintenance. Beta attenuation monitors use small radioactive sources that need licensing in some countries. Local governments in developing countries often lack budgets for enough stations, leaving large areas unmonitored. Funding for monitoring can be cut during budget pressures. Spare parts, filter tape, and calibration services add ongoing costs over the instrument’s life. Shipping and import duties raise prices further in emerging markets. These factors limit network expansion in lower-income regions.
Sensor Accuracy Concerns Restrict the Particulate Matter Monitoring Market
Data accuracy concerns with low-cost sensors restrict the particulate matter monitoring market. Cheaper devices can give misleading readings.
The underlying causes are measurement limits and calibration needs. Low-cost optical particle counters can be affected by humidity, particle type, and aging, causing large errors compared with reference instruments. Readings from different brands may not match. Regulators do not accept most low-cost sensor data for compliance. Users may lose trust if sensors show unrealistic values. Calibration against reference monitors and data correction algorithms add cost and complexity for users. Standards bodies are still developing performance targets for sensors, which leaves buyers unsure which products to trust. Short sensor lifetimes also mean frequent replacement. These factors slow the replacement of reference networks and limit some uses of low-cost sensors.
Market Opportunities
Hybrid Sensor Networks and Smart Cities Open a Data Revenue Pool
Hybrid sensor networks and smart city programs open a data revenue pool in the particulate matter monitoring market. Cities want street-level pollution maps.
Vendors that combine hardware, software, and analytics can capture this opportunity. Dense networks of low-cost sensors calibrated against reference stations show pollution hotspots near roads, schools, and factories. Cloud platforms, dashboards, and AI forecasting help cities issue alerts and plan traffic or industrial controls. TSI expanded its OmniTrak platform in 2026 with in-field calibration and onboard data logging. Satellite data and modeling fill gaps between monitors. Subscription data services create recurring revenue. Communities and schools use sensors for local awareness. These services widen the customer base, and partnerships with telecom operators and smart city integrators help vendors win large city contracts. Health researchers also buy data to study links between pollution and disease.
India and Emerging Markets Create a Volume Revenue Pool
Severe pollution in India and other emerging markets creates a volume revenue pool in the particulate matter monitoring market. Many cities have very high PM2.5 levels and too few monitors.
Equipment makers with affordable, rugged products can capture this opportunity. India’s National Clean Air Programme funds monitoring in more than 130 cities, and the Central Pollution Control Board is expanding continuous stations. Delhi, Mumbai, Kolkata, and Lucknow face severe winter pollution. Indonesia, Vietnam, Thailand, Pakistan, and Bangladesh have serious air quality problems. Saudi Arabia and the United Arab Emirates need dust monitoring. Local assembly lowers costs. International funding from development banks and climate programs supports new networks, and data sharing platforms help governments and citizens track progress. Training local technicians improves station uptime.
Segment Analysis
By Technology: Optical & Laser Scattering Lead While TEOM Grows Fastest
Optical & Laser Scattering held 59.6% share in 2026. Optical particle counters and laser scattering sensors measure particles in real time by detecting light scattered by each particle. They are compact, fast, and used in indoor monitors, portable devices, cleanrooms, and dense sensor networks. TSI, Grimm Aerosol Technik, Palas, and many sensor makers supply these devices. Beta attenuation monitors are the main federal equivalent method in many networks.
Tapered Element Oscillating Microbalance is the fastest-growing technology, expanding at an 11.3% CAGR through 2033. TEOM instruments measure particle mass directly by weighing particles on a vibrating filter, giving continuous, reference-grade data. Thermo Fisher Scientific leads this technology. Many agencies pair TEOM and beta instruments to meet both PM2.5 and PM10 requirements. For the market, TEOM growth supports high-value regulatory sales.
By Deployment: Fixed Monitoring Stations Lead While Portable & Wearable Monitors Grow Fastest
Fixed Monitoring Stations held 71.2% share in 2026. Fixed stations measure ambient air quality for regulatory networks, industrial fence lines, and smart city projects. They include reference monitors and sensor nodes mounted on poles and buildings. Indoor fixed monitors are installed in offices, schools, and hospitals, often linked to building management systems. Industrial fence-line monitors track dust from quarries, ports, and construction sites.
Portable & Wearable Monitors are the fastest-growing deployment type, expanding at a 12.3% CAGR through 2033. Workers in mining, construction, and manufacturing wear personal monitors to measure dust and silica exposure under workplace safety rules. Researchers use portable monitors for exposure studies. Silica dust rules in the United States and Australia have raised demand for personal samplers. Consumers also buy handheld monitors to check air at home. For the market, portable growth adds new users.
By End User: Government & Regulatory Agencies Lead While Commercial & Residential Buildings Grow Fastest
Government & Regulatory Agencies held 31.8% share in 2026. Environmental agencies operate national and local monitoring networks to meet legal requirements and inform the public. PM2.5 and PM10 monitoring is central to air quality reporting. Industrial facilities, mining, and research institutes form other large end users, and power plants and cement kilns must monitor stack particulate emissions.
Commercial & Residential Buildings are the fastest-growing end user, expanding at a 12.8% CAGR through 2033. Building owners install sensors to manage ventilation, filtration, and energy use, and to earn healthy building certifications. Smart thermostats and air purifiers include particle sensors. Data from these sensors helps prove indoor air quality to employees and visitors. For the market, building growth adds high-volume sensor demand.
Geography Analysis
Which Region Is Leading the Particulate Matter Monitoring Market?
North America is leading the particulate matter monitoring market with a 44.2% share in 2026. The United States has a large national monitoring network and stricter PM2.5 standards set in 2024, which require new monitors near pollution sources and in vulnerable communities. Wildfire smoke has driven demand for real-time public data and indoor air monitors. Thermo Fisher Scientific, Teledyne, TSI, and Met One Instruments are based in the region. Canada monitors wildfire smoke across many provinces and northern communities. Workplace exposure rules from OSHA support personal monitors, and many cities share real-time data with residents through apps. One change shaping the region is hybrid sensor networks.
Europe Advances the Particulate Matter Monitoring Market Through New Air Quality Rules
Europe is a major particulate matter monitoring market. Germany, the United Kingdom, France, Italy, and Poland have dense monitoring networks and strong industrial demand. The revised European Union Ambient Air Quality Directive will lower PM2.5 limits from 2030, requiring more monitoring and new sampling points. Grimm Aerosol Technik and Palas are based in Germany, and Acoem in France. Poland faces severe winter smog from coal heating, and Italy’s Po Valley has some of Europe’s highest PM2.5 levels. Key barriers include budget limits in local authorities. One opportunity is network upgrades before 2030, when the new limits take effect.
Which Country Is Growing Fastest in the Particulate Matter Monitoring Market?
India is growing fastest in the particulate matter monitoring market at a 14.2% CAGR through 2033, within Asia Pacific. India has some of the world’s most polluted cities and is expanding continuous monitoring under the National Clean Air Programme. China remains the largest country market in Asia Pacific, with large national networks and industrial monitoring. Japan and South Korea have strict standards and dense networks. Indonesia and Thailand face haze from fires, and Vietnam is expanding monitoring in Hanoi. Local governments in India are also deploying sensor networks alongside reference stations. One opportunity is affordable monitors for smaller Indian cities.
Latin America Grows the Particulate Matter Monitoring Market Through Urban Networks
Latin America is a growing particulate matter monitoring market. Mexico City, Santiago, São Paulo, Lima, and Bogotá run large monitoring networks to manage urban smog and issue alerts. Brazil and Chile also monitor mining and industrial emissions closely. Peru and Colombia are expanding networks, and Mexico is updating its air quality standards. Mining regions in Chile and Peru require dust monitoring near communities. Wildfires in the Amazon and Chile add smoke episodes that raise public demand for real-time data. Key barriers include limited budgets and maintenance skills. One opportunity is calibrated sensor networks for cities.
Middle East & Africa Builds the Particulate Matter Monitoring Market
Middle East & Africa is an emerging particulate matter monitoring market. Saudi Arabia and the United Arab Emirates monitor frequent dust storms and urban air quality as part of national environmental and health programs. South Africa monitors mining and coal power emissions in the Highveld region. Egypt, Nigeria, and Kenya have serious urban pollution and few monitors, and international programs are funding low-cost sensor networks in African cities. Large construction projects in Saudi Arabia require dust monitoring. Key barriers include tight budgets and limited maintenance skills. One opportunity is continuous dust monitoring for construction, ports, and mining sites.
Competitive Landscape
The particulate matter monitoring market is highly concentrated. Thermo Fisher Scientific leads with more than 18% share, followed by Teledyne Technologies at about 14% and TSI Incorporated at about 12%, and the top five, including Horiba and Grimm Aerosol Technik, hold about 62%. Other players include Acoem with Met One Instruments, AMETEK, Siemens, Palas, Aeroqual, Clarity Movement, Kunak, and Sensirion.
Companies compete on accuracy, regulatory approvals, reliability, data platforms, service networks, and price. Reference-grade instruments need federal or European certification, which creates high barriers to entry. Low-cost sensor companies compete on price and network scale, while established vendors add sensor networks to their portfolios. Service contracts for calibration and maintenance provide steady revenue. Software platforms that combine data from different brands are becoming important, and many vendors sell through distributors and system integrators in emerging markets.
Strategic moves show how competition is changing. In February 2024, the United States Environmental Protection Agency finalized the stricter PM2.5 standard. In August 2024, Met One Instruments introduced the BAM 1022 PLUS. In October 2024, the European Union adopted its revised air quality directive. In July 2026, TSI expanded its OmniTrak platform with in-field calibration. These moves show competition shifting toward higher sensitivity and connected networks.
Three themes shape vendor strategy. First, vendors are improving sensitivity for lower limits. Second, they are adding cloud platforms and analytics. Third, they are expanding in Asia Pacific.
Particulate Matter Monitoring Market Industry Leaders
- Thermo Fisher Scientific
- Teledyne Technologies
- TSI Incorporated
- Horiba
- Grimm Aerosol Technik
Recent Industry Developments
- July 2026: TSI Incorporated expanded its OmniTrak solution with in-field particulate calibration and onboard data logging - simplifies accurate monitoring in the field.
- October 2024: The Council of the European Union adopted the revised Ambient Air Quality Directive, lowering the annual PM2.5 limit to 10 micrograms per cubic meter from 2030 - drives network upgrades in Europe.
- August 2024: Met One Instruments introduced the BAM 1022 PLUS with nearly twice the sensitivity of its predecessor - supports compliance with lower PM2.5 limits.
- February 2024: The United States Environmental Protection Agency lowered the annual PM2.5 standard to 9 micrograms per cubic meter - requires expanded monitoring across states.
Companies Covered in the Report
- Thermo Fisher Scientific
- Teledyne Technologies
- TSI Incorporated
- Horiba
- Grimm Aerosol Technik
- Acoem (Met One Instruments)
- AMETEK
- Siemens
- Palas
- Aeroqual
- Clarity Movement
- Sensirion
Particulate Matter Monitoring Market Report Scope
This report covers particulate matter monitoring instruments, sensors, and data platforms using optical and laser scattering, beta attenuation, TEOM, and gravimetric methods, in fixed stations and portable and wearable monitors, for PM1, PM2.5, and PM10 measurement by government agencies, industry, commercial and residential buildings, and research institutes. It excludes gas-only analyzers. The base year is 2025, and the forecast period runs from 2026 to 2033. All values are expressed in US$ Billion.
Technology
- Optical & Laser Scattering
- Beta Attenuation
- Tapered Element Oscillating Microbalance
- Gravimetric
Deployment
- Fixed Monitoring Stations
- Portable & Wearable Monitors
End User
- Government & Regulatory Agencies
- Industrial Facilities
- Commercial & Residential Buildings
- Research Institutes
Regions
- North America
- Europe
- Asia Pacific
- Latin America
- Middle East & Africa
Key Questions Answered in the Report
How big is the particulate matter monitoring market in 2026?
The particulate matter monitoring market is valued at US$ 1.99 billion in 2026, led by optical monitors and government monitoring networks.
What is the particulate matter monitoring market forecast to 2033?
The market is projected to reach US$ 4.01 billion by 2033, growing at a 10.5% CAGR and adding US$ 2.02 billion.
Which end user is growing fastest in particulate matter monitoring?
Commercial and residential buildings are growing fastest at a 12.8% CAGR through 2033, driven by healthy building standards and smart ventilation.
Which country is growing fastest in the particulate matter monitoring market?
India is growing fastest at a 14.2% CAGR through 2033, driven by the National Clean Air Programme and expanding monitoring networks.
Which region holds the largest particulate matter monitoring market share?
North America holds the largest share at 44.2% in 2026, supported by stricter PM2.5 standards and leading instrument manufacturers.
1. Executive Summary
1.1. Global Particulate Matter Monitoring Market Snapshot
1.2. Future Projections
1.3. Key Report Takeaways
1.4. Regional Snapshot
2. Market Overview
2.1. Market Definition and Report Scope
2.2. Historical Trends 2020–2025
2.3. Market Dynamics
2.3.1. Drivers
2.3.1.1. Stricter Regulations Are Driving the Particulate Matter Monitoring Market
2.3.1.2. Health Awareness Is Expanding the Particulate Matter Monitoring Market
2.3.2. Restraints
2.3.2.1. High Equipment Costs Slow the Particulate Matter Monitoring Market
2.3.2.2. Sensor Accuracy Concerns Restrict the Particulate Matter Monitoring Market
2.3.3. Market Opportunities
2.3.3.1. Hybrid Sensor Networks and Smart Cities Open a Data Revenue Pool
2.3.3.2. India and Emerging Markets Create a Volume Revenue Pool
3. Global Particulate Matter Monitoring Market Outlook, 2020-2033
3.1. Global Particulate Matter Monitoring Market Outlook, by Technology, Value (US$ Billion), 2020-2033
3.1.1. Optical & Laser Scattering
3.1.2. Beta Attenuation
3.1.3. Tapered Element Oscillating Microbalance
3.1.4. Gravimetric
3.2. Global Particulate Matter Monitoring Market Outlook, by Deployment, Value (US$ Billion), 2020-2033
3.2.1. Fixed Monitoring Stations
3.2.2. Portable & Wearable Monitors
3.3. Global Particulate Matter Monitoring Market Outlook, by End User, Value (US$ Billion), 2020-2033
3.3.1. Government & Regulatory Agencies
3.3.2. Industrial Facilities
3.3.3. Commercial & Residential Buildings
3.3.4. Research Institutes
3.4. Global Particulate Matter Monitoring Market Outlook, by Region, Value (US$ Billion), 2020-2033
3.4.1. North America
3.4.2. Europe
3.4.3. Asia Pacific
3.4.4. Latin America
3.4.5. Middle East & Africa
4. North America Particulate Matter Monitoring Market Outlook, 2020-2033
4.1. North America Particulate Matter Monitoring Market Outlook, by Technology, Value (US$ Billion), 2020-2033
4.1.1. Optical & Laser Scattering
4.1.2. Beta Attenuation
4.1.3. Tapered Element Oscillating Microbalance
4.1.4. Gravimetric
4.2. North America Particulate Matter Monitoring Market Outlook, by Deployment, Value (US$ Billion), 2020-2033
4.2.1. Fixed Monitoring Stations
4.2.2. Portable & Wearable Monitors
4.3. North America Particulate Matter Monitoring Market Outlook, by End User, Value (US$ Billion), 2020-2033
4.3.1. Government & Regulatory Agencies
4.3.2. Industrial Facilities
4.3.3. Commercial & Residential Buildings
4.3.4. Research Institutes
4.4. North America Particulate Matter Monitoring Market Outlook, by Country, Value (US$ Billion), 2020-2033
4.4.1. United States Particulate Matter Monitoring Market Outlook, by Technology, 2020-2033
4.4.2. United States Particulate Matter Monitoring Market Outlook, by Deployment, 2020-2033
4.4.3. United States Particulate Matter Monitoring Market Outlook, by End User, 2020-2033
4.4.4. Canada Particulate Matter Monitoring Market Outlook, by Technology, 2020-2033
4.4.5. Canada Particulate Matter Monitoring Market Outlook, by Deployment, 2020-2033
4.4.6. Canada Particulate Matter Monitoring Market Outlook, by End User, 2020-2033
5. Europe Particulate Matter Monitoring Market Outlook, 2020-2033
5.1. Europe Particulate Matter Monitoring Market Outlook, by Technology, Value (US$ Billion), 2020-2033
5.1.1. Optical & Laser Scattering
5.1.2. Beta Attenuation
5.1.3. Tapered Element Oscillating Microbalance
5.1.4. Gravimetric
5.2. Europe Particulate Matter Monitoring Market Outlook, by Deployment, Value (US$ Billion), 2020-2033
5.2.1. Fixed Monitoring Stations
5.2.2. Portable & Wearable Monitors
5.3. Europe Particulate Matter Monitoring Market Outlook, by End User, Value (US$ Billion), 2020-2033
5.3.1. Government & Regulatory Agencies
5.3.2. Industrial Facilities
5.3.3. Commercial & Residential Buildings
5.3.4. Research Institutes
5.4. Europe Particulate Matter Monitoring Market Outlook, by Country, Value (US$ Billion), 2020-2033
5.4.1. Germany Particulate Matter Monitoring Market Outlook, by Technology, 2020-2033
5.4.2. Germany Particulate Matter Monitoring Market Outlook, by Deployment, 2020-2033
5.4.3. Germany Particulate Matter Monitoring Market Outlook, by End User, 2020-2033
5.4.4. United Kingdom Particulate Matter Monitoring Market Outlook, by Technology, 2020-2033
5.4.5. United Kingdom Particulate Matter Monitoring Market Outlook, by Deployment, 2020-2033
5.4.6. United Kingdom Particulate Matter Monitoring Market Outlook, by End User, 2020-2033
5.4.7. France Particulate Matter Monitoring Market Outlook, by Technology, 2020-2033
5.4.8. France Particulate Matter Monitoring Market Outlook, by Deployment, 2020-2033
5.4.9. France Particulate Matter Monitoring Market Outlook, by End User, 2020-2033
5.4.10. Italy Particulate Matter Monitoring Market Outlook, by Technology, 2020-2033
5.4.11. Italy Particulate Matter Monitoring Market Outlook, by Deployment, 2020-2033
5.4.12. Italy Particulate Matter Monitoring Market Outlook, by End User, 2020-2033
5.4.13. Poland Particulate Matter Monitoring Market Outlook, by Technology, 2020-2033
5.4.14. Poland Particulate Matter Monitoring Market Outlook, by Deployment, 2020-2033
5.4.15. Poland Particulate Matter Monitoring Market Outlook, by End User, 2020-2033
6. Asia Pacific Particulate Matter Monitoring Market Outlook, 2020-2033
6.1. Asia Pacific Particulate Matter Monitoring Market Outlook, by Technology, Value (US$ Billion), 2020-2033
6.1.1. Optical & Laser Scattering
6.1.2. Beta Attenuation
6.1.3. Tapered Element Oscillating Microbalance
6.1.4. Gravimetric
6.2. Asia Pacific Particulate Matter Monitoring Market Outlook, by Deployment, Value (US$ Billion), 2020-2033
6.2.1. Fixed Monitoring Stations
6.2.2. Portable & Wearable Monitors
6.3. Asia Pacific Particulate Matter Monitoring Market Outlook, by End User, Value (US$ Billion), 2020-2033
6.3.1. Government & Regulatory Agencies
6.3.2. Industrial Facilities
6.3.3. Commercial & Residential Buildings
6.3.4. Research Institutes
6.4. Asia Pacific Particulate Matter Monitoring Market Outlook, by Country, Value (US$ Billion), 2020-2033
6.4.1. India Particulate Matter Monitoring Market Outlook, by Technology, 2020-2033
6.4.2. India Particulate Matter Monitoring Market Outlook, by Deployment, 2020-2033
6.4.3. India Particulate Matter Monitoring Market Outlook, by End User, 2020-2033
6.4.4. China Particulate Matter Monitoring Market Outlook, by Technology, 2020-2033
6.4.5. China Particulate Matter Monitoring Market Outlook, by Deployment, 2020-2033
6.4.6. China Particulate Matter Monitoring Market Outlook, by End User, 2020-2033
6.4.7. Japan Particulate Matter Monitoring Market Outlook, by Technology, 2020-2033
6.4.8. Japan Particulate Matter Monitoring Market Outlook, by Deployment, 2020-2033
6.4.9. Japan Particulate Matter Monitoring Market Outlook, by End User, 2020-2033
6.4.10. South Korea Particulate Matter Monitoring Market Outlook, by Technology, 2020-2033
6.4.11. South Korea Particulate Matter Monitoring Market Outlook, by Deployment, 2020-2033
6.4.12. South Korea Particulate Matter Monitoring Market Outlook, by End User, 2020-2033
6.4.13. Indonesia Particulate Matter Monitoring Market Outlook, by Technology, 2020-2033
6.4.14. Indonesia Particulate Matter Monitoring Market Outlook, by Deployment, 2020-2033
6.4.15. Indonesia Particulate Matter Monitoring Market Outlook, by End User, 2020-2033
6.4.16. Thailand Particulate Matter Monitoring Market Outlook, by Technology, 2020-2033
6.4.17. Thailand Particulate Matter Monitoring Market Outlook, by Deployment, 2020-2033
6.4.18. Thailand Particulate Matter Monitoring Market Outlook, by End User, 2020-2033
6.4.19. Vietnam Particulate Matter Monitoring Market Outlook, by Technology, 2020-2033
6.4.20. Vietnam Particulate Matter Monitoring Market Outlook, by Deployment, 2020-2033
6.4.21. Vietnam Particulate Matter Monitoring Market Outlook, by End User, 2020-2033
7. Latin America Particulate Matter Monitoring Market Outlook, 2020-2033
7.1. Latin America Particulate Matter Monitoring Market Outlook, by Technology, Value (US$ Billion), 2020-2033
7.1.1. Optical & Laser Scattering
7.1.2. Beta Attenuation
7.1.3. Tapered Element Oscillating Microbalance
7.1.4. Gravimetric
7.2. Latin America Particulate Matter Monitoring Market Outlook, by Deployment, Value (US$ Billion), 2020-2033
7.2.1. Fixed Monitoring Stations
7.2.2. Portable & Wearable Monitors
7.3. Latin America Particulate Matter Monitoring Market Outlook, by End User, Value (US$ Billion), 2020-2033
7.3.1. Government & Regulatory Agencies
7.3.2. Industrial Facilities
7.3.3. Commercial & Residential Buildings
7.3.4. Research Institutes
7.4. Latin America Particulate Matter Monitoring Market Outlook, by Country, Value (US$ Billion), 2020-2033
7.4.1. Brazil Particulate Matter Monitoring Market Outlook, by Technology, 2020-2033
7.4.2. Brazil Particulate Matter Monitoring Market Outlook, by Deployment, 2020-2033
7.4.3. Brazil Particulate Matter Monitoring Market Outlook, by End User, 2020-2033
7.4.4. Chile Particulate Matter Monitoring Market Outlook, by Technology, 2020-2033
7.4.5. Chile Particulate Matter Monitoring Market Outlook, by Deployment, 2020-2033
7.4.6. Chile Particulate Matter Monitoring Market Outlook, by End User, 2020-2033
7.4.7. Peru Particulate Matter Monitoring Market Outlook, by Technology, 2020-2033
7.4.8. Peru Particulate Matter Monitoring Market Outlook, by Deployment, 2020-2033
7.4.9. Peru Particulate Matter Monitoring Market Outlook, by End User, 2020-2033
7.4.10. Colombia Particulate Matter Monitoring Market Outlook, by Technology, 2020-2033
7.4.11. Colombia Particulate Matter Monitoring Market Outlook, by Deployment, 2020-2033
7.4.12. Colombia Particulate Matter Monitoring Market Outlook, by End User, 2020-2033
7.4.13. Mexico Particulate Matter Monitoring Market Outlook, by Technology, 2020-2033
7.4.14. Mexico Particulate Matter Monitoring Market Outlook, by Deployment, 2020-2033
7.4.15. Mexico Particulate Matter Monitoring Market Outlook, by End User, 2020-2033
8. Middle East & Africa Particulate Matter Monitoring Market Outlook, 2020-2033
8.1. Middle East & Africa Particulate Matter Monitoring Market Outlook, by Technology, Value (US$ Billion), 2020-2033
8.1.1. Optical & Laser Scattering
8.1.2. Beta Attenuation
8.1.3. Tapered Element Oscillating Microbalance
8.1.4. Gravimetric
8.2. Middle East & Africa Particulate Matter Monitoring Market Outlook, by Deployment, Value (US$ Billion), 2020-2033
8.2.1. Fixed Monitoring Stations
8.2.2. Portable & Wearable Monitors
8.3. Middle East & Africa Particulate Matter Monitoring Market Outlook, by End User, Value (US$ Billion), 2020-2033
8.3.1. Government & Regulatory Agencies
8.3.2. Industrial Facilities
8.3.3. Commercial & Residential Buildings
8.3.4. Research Institutes
8.4. Middle East & Africa Particulate Matter Monitoring Market Outlook, by Country, Value (US$ Billion), 2020-2033
8.4.1. Saudi Arabia Particulate Matter Monitoring Market Outlook, by Technology, 2020-2033
8.4.2. Saudi Arabia Particulate Matter Monitoring Market Outlook, by Deployment, 2020-2033
8.4.3. Saudi Arabia Particulate Matter Monitoring Market Outlook, by End User, 2020-2033
8.4.4. United Arab Emirates Particulate Matter Monitoring Market Outlook, by Technology, 2020-2033
8.4.5. United Arab Emirates Particulate Matter Monitoring Market Outlook, by Deployment, 2020-2033
8.4.6. United Arab Emirates Particulate Matter Monitoring Market Outlook, by End User, 2020-2033
8.4.7. South Africa Particulate Matter Monitoring Market Outlook, by Technology, 2020-2033
8.4.8. South Africa Particulate Matter Monitoring Market Outlook, by Deployment, 2020-2033
8.4.9. South Africa Particulate Matter Monitoring Market Outlook, by End User, 2020-2033
8.4.10. Egypt Particulate Matter Monitoring Market Outlook, by Technology, 2020-2033
8.4.11. Egypt Particulate Matter Monitoring Market Outlook, by Deployment, 2020-2033
8.4.12. Egypt Particulate Matter Monitoring Market Outlook, by End User, 2020-2033
8.4.13. Nigeria Particulate Matter Monitoring Market Outlook, by Technology, 2020-2033
8.4.14. Nigeria Particulate Matter Monitoring Market Outlook, by Deployment, 2020-2033
8.4.15. Nigeria Particulate Matter Monitoring Market Outlook, by End User, 2020-2033
8.4.16. Kenya Particulate Matter Monitoring Market Outlook, by Technology, 2020-2033
8.4.17. Kenya Particulate Matter Monitoring Market Outlook, by Deployment, 2020-2033
8.4.18. Kenya Particulate Matter Monitoring Market Outlook, by End User, 2020-2033
9. Competitive Landscape
9.1. Market Concentration and Industry Leaders
9.2. Competitive Differentiation
9.3. Strategic Moves and Market Direction
9.4. Recent Industry Developments
9.5. Company Profiles
9.5.1. Thermo Fisher Scientific
9.5.2. Teledyne Technologies
9.5.3. TSI Incorporated
9.5.4. Horiba
9.5.5. Grimm Aerosol Technik
9.5.6. Acoem (Met One Instruments)
9.5.7. AMETEK
9.5.8. Siemens
9.5.9. Palas
9.5.10. Aeroqual
9.5.11. Clarity Movement
9.5.12. Sensirion
10. Appendix
10.1. Research Methodology
10.2. Report Assumptions
10.3. Acronyms and Abbreviations
| Technology | Optical & Laser Scattering, Beta Attenuation, Tapered Element Oscillating Microbalance, Gravimetric |
| Deployment | Fixed Monitoring Stations, Portable & Wearable Monitors |
| End User | Government & Regulatory Agencies, Industrial Facilities, Commercial & Residential Buildings, Research Institutes |
| Regions | North America, Europe, Asia Pacific, Latin America, Middle East & Africa |
Our Research Methodology
Considering the volatility of business today, traditional approaches to strategizing a game plan can be unfruitful if not detrimental. True ambiguity is no way to determine a forecast. A myriad of predetermined factors must be accounted for such as the degree of risk involved, the magnitude of circumstances, as well as conditions or consequences that are not known or unpredictable. To circumvent binary views that cast uncertainty, the application of market research intelligence to strategically posture, move, and enable actionable outcomes is necessary.
View Methodology
Quality Assured
Rigorous Validation Process

Confidentiality Assured
End-to-end Data Security

Custom Research Services
Tailored To Your Objectives
FAQs
The particulate matter monitoring market is valued at US$ 1.99 billion in 2026, led by optical monitors and government monitoring networks.
The market is projected to reach US$ 4.01 billion by 2033, growing at a 10.5% CAGR and adding US$ 2.02 billion.
Commercial and residential buildings are growing fastest at a 12.8% CAGR through 2033, driven by healthy building standards and smart ventilation.
India is growing fastest at a 14.2% CAGR through 2033, driven by the National Clean Air Programme and expanding monitoring networks.
North America holds the largest share at 44.2% in 2026, supported by stricter PM2.5 standards and leading instrument manufacturers.
Related Reports
Thresher Market Size, Share, Insights, Competitive Landscape, and Forecast 2026 to 2033
Thresher market to reach US$ 3.52 billion by 2033 at a 4.1% CAGR. Explore product types, crops, power sources, leading companies and regional trends.
Rotary Sprinkler System Market Size, Share, Insights, Competitive Landscape, and Forecast 2026 to 2033
Rotary sprinkler system market to reach US$ 4.99 billion by 2033 at a 5.5% CAGR. Explore product types, smart controls, applications and regional trends.
Greenhouse Multi-Layer Benching Systems Market Size, Share, Insights, Competitive Landscape, and Forecast 2026 to 2033
Greenhouse multi-layer benching systems market to reach US$ 2.09 billion by 2033 at a 7.0% CAGR. Explore benching types, crops and regional trends.
Food and Beverage Automated Storage Retrieval System Market Size, Share, Insights, Competitive Landscape, and Forecast 2026 to 2033
Food and beverage AS/RS market to reach US$ 3.10 billion by 2033 at a 9.7% CAGR. Explore system types, temperature ranges and regional trends.
Agricultural Haying and Forage Machinery Market Size, Share, Insights, Competitive Landscape, and Forecast 2026 to 2033
Agricultural haying and forage machinery market to reach US$ 13.06 billion by 2033 at a 4.1% CAGR. Explore products, operations and regional trends.
Valve Remote Control System Market Size, Share, Insights, Competitive Landscape, and Forecast 2026 to 2033
Valve remote control system market to reach US$ 15.16 billion by 2033 at a 6.5% CAGR. Explore actuation types, applications and regional trends.