



Thresher Market
Thresher Market Size, Share, Insights, Competitive Landscape, and Forecast 2026 to 2033
Thresher Market Analysis, 2026–2033
Thresher Market
Thresher Market Size, Share, Insights, Competitive Landscape, and Forecast 2026 to 2033
Thresher Market Size and Trend Analysis
How Fast Is the Thresher Market Growing?
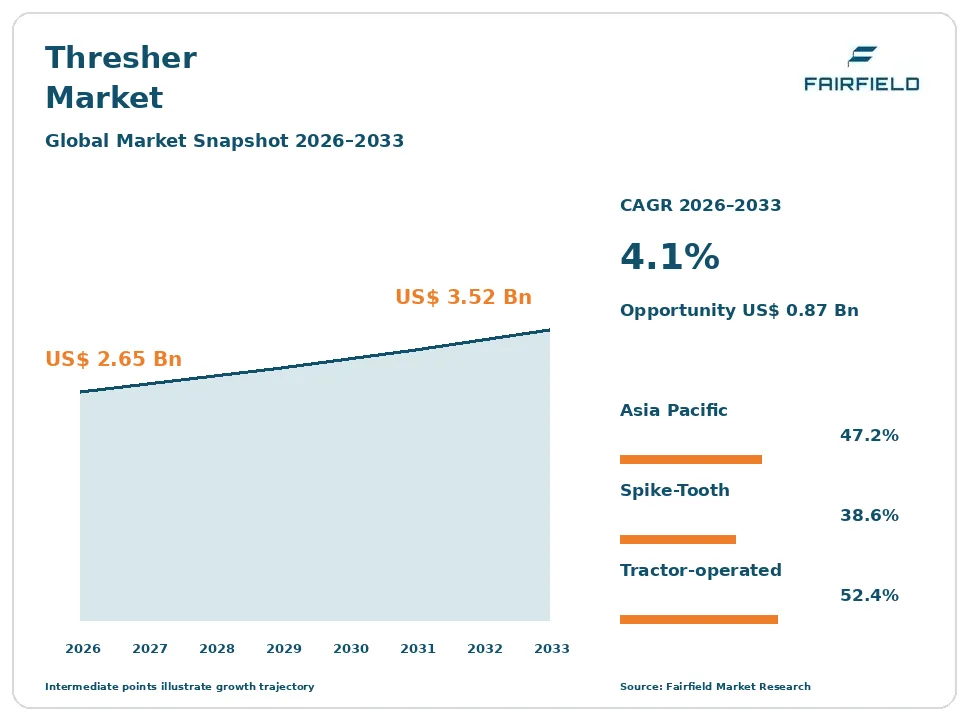
The global thresher market size is expected to be valued at US$ 2.65 billion in 2026 and projected to reach US$ 3.52 billion by 2033, growing at a CAGR of 4.1% between 2026 and 2033.
Between 2020 and 2025, the market grew at a CAGR of about 3.6%, as pandemic labor shortages and mechanization subsidies encouraged smallholders to buy or hire threshers. Three factors now drive growth: rising farm wages and rural labor migration, government support for farm mechanization, and the need to cut post-harvest losses in wheat, rice, maize, pulses, and oilseeds. The market is shifting from manual and pedal machines toward tractor-operated threshers, high-capacity axial flow threshers, and multi-crop threshers that handle several crops with simple adjustments. Custom hiring centers and youth-run threshing services are making machines available to small farms that cannot buy them. Better grain cleaning and lower post-harvest losses improve farmer incomes.
Key Report Takeaways
- By Product Type: Spike-Tooth held 38.6% share in 2026, while Axial Flow is projected to expand at a 5.2% CAGR through 2033, driven by higher capacity, cleaner grain, and suitability for wet paddy crops.
- By Crop: Wheat held 34.2% share in 2026, while Groundnut & Oilseeds are projected to expand at a 5.3% CAGR through 2033, driven by new crop-specific machines and rising oilseed production.
- By Power Source: Tractor-operated held 52.4% share in 2026, while Electric is projected to expand at a 6.1% CAGR through 2033, driven by rural electrification and low running costs.
- By Region: Asia Pacific held 47.2% share in 2026, while Middle East & Africa is projected to expand at a 5.8% CAGR through 2033, driven by smallholder mechanization in Nigeria, Ethiopia, and Tanzania.
Global Thresher Market Trends and Insights
Drivers Impact Analysis
Two drivers carry the strongest influence on thresher demand during the forecast period.
| Driver | Impact on CAGR Forecast | Geographic Relevance | Impact Timeline |
| Rural labor shortages and rising wages | High | Asia Pacific, Middle East & Africa | Long term (≥4 years) |
| Government mechanization subsidies | High | Asia Pacific, Middle East & Africa, Latin America | Medium term (2-4 years) |
Labor Shortages Are Driving the Thresher Market
Rural labor shortages and rising wages are the strongest driver of the thresher market. Manual threshing is slow, tiring, and increasingly expensive.
The mechanism is the movement of workers from farms to cities and other jobs. In India, China, Indonesia, Vietnam, and Bangladesh, rural wages have risen as young people move to urban areas. Harvest windows are short, and delays expose crops to rain, pests, and grain shattering. A thresher can process in hours what takes a team of workers several days. Smallholder farmers in Tanzania spend large amounts of time threshing by hand, and studies estimate mechanical threshing could cut labor hours by more than 85%. Women and youth often carry the burden of manual threshing, so machines also improve working conditions. These pressures push farmers toward mechanical threshing.
Mechanization Subsidies Are Expanding the Thresher Market
Government mechanization subsidies are expanding the thresher market. Many governments pay part of the cost of farm machines for smallholders.
The cause is policy support for farm mechanization to raise productivity and food security. India’s Sub-Mission on Agricultural Mechanization subsidizes threshers and funds custom hiring centers where farmers can rent machines. China provides purchase subsidies for agricultural machinery, including threshers and small harvesters. Nigeria, Ethiopia, Kenya, and Tanzania support mechanization through national programs and donor projects. A project in Tanzania launched in 2024 covers 50% of multi-crop thresher costs for women and youth service providers. Bangladesh and Nepal offer subsidies for power threshers. Development banks and donors fund mechanization hubs and service provider training. These programs make threshers more affordable and expand sales.
Restraints Impact Analysis
Two restraints limit how quickly the thresher market grows.
| Restraint | Impact on CAGR Forecast | Geographic Relevance | Impact Timeline |
| Shift to combine harvesters on larger farms | High | Asia Pacific, Latin America, Europe | Long term (≥4 years) |
| Low farmer incomes and safety concerns | Medium | Asia Pacific, Middle East & Africa | Medium term (2-4 years) |
Combine Harvester Adoption Slows the Thresher Market
The shift to combine harvesters on larger farms slows the thresher market. Combines cut, thresh, and clean grain in one operation.
The specific causes are farm consolidation and the availability of custom combine services. In North America, Europe, Latin America, and much of China, large farms use combines rather than stationary threshers. In India, combine harvesting services have spread rapidly in Punjab, Haryana, and Madhya Pradesh for wheat and rice. Compact combines from Kubota, Yanmar, and Chinese makers are now affordable for contractors serving small farms. Each new combine replaces demand for several threshers in its service area. Governments in some countries now subsidize combines more than threshers. Straw management rules also affect machine choice. These trends reduce thresher demand in more developed farming regions.
Low Incomes and Safety Concerns Restrict the Thresher Market
Low farmer incomes and safety concerns restrict the thresher market. Many smallholders cannot afford to buy a thresher.
The underlying causes are poverty, limited credit, and machine hazards. Smallholders in Middle East & Africa and parts of Asia Pacific often farm less than 2 hectares and earn low incomes, making even small machines a major investment. Credit is difficult to obtain in rural areas without collateral. Thresher accidents, especially injuries to hands and arms from feeding crops into drums, have been a serious problem in India and other countries. Poorly made local machines can break down often and lack safety guards. Spare parts and repair services may be hard to find in remote areas. Fuel prices raise operating costs for diesel-powered machines. These factors slow purchases among the poorest farmers.
Market Opportunities
Multi-Crop and Smart Threshers Open a Value Revenue Pool
Multi-crop threshers and smart threshing features open a value revenue pool in the thresher market. Farmers want one machine for many crops.
Manufacturers that offer flexible, efficient machines can capture this opportunity. Multi-crop threshers handle wheat, rice, maize, sorghum, millet, soybeans, beans, and sunflower with changes to sieves, speeds, and concaves. Mahindra & Mahindra offers more than 30 thresher models and launched a groundnut thresher with real-time grain quality and loss monitoring in 2025. Better cleaning systems reduce post-harvest losses and improve grain prices. Safety features such as feed chutes and guards help meet regulations. Service providers can earn more by threshing several crops each season. Smart features such as digital counters, loss sensors, and remote diagnostics add value per machine and help dealers sell premium models to service providers.
Middle East & Africa Smallholder Mechanization Creates a Volume Revenue Pool
Smallholder mechanization in Middle East & Africa creates a volume revenue pool in the thresher market. Most small farms in the region still thresh by hand.
Local manufacturers and international firms with affordable machines can capture this opportunity. Imara Tech in Tanzania has sold more than 800 multi-crop threshers to service providers, and donor-funded programs are expanding adoption. SAYeTECH in Ghana builds multi-crop threshers for maize, soybeans, and rice. Nigeria and Ethiopia are expanding rice and wheat production to reduce imports. Pay-per-use threshing services lower costs for farmers. Local assembly cuts prices, shortens delivery times, and creates rural jobs. Mobile money makes it easier for farmers to pay for services. Training programs build repair skills, and spare parts networks keep machines running during short harvest seasons.
Segment Analysis
By Product Type: Spike-Tooth Leads While Axial Flow Grows Fastest
Spike-Tooth held 38.6% share in 2026. Spike-tooth threshers use a drum fitted with spikes that rotate against a concave to separate grain from straw. They are simple, durable, and well suited for wheat, barley, and other small grains, and they produce chopped straw (bhusa) used as animal feed in India and Pakistan. Many local manufacturers build spike-tooth machines at low cost. Hammer mill and wire-loop threshers serve specific crops and regions.
Axial Flow is the fastest-growing product type, expanding at a 5.2% CAGR through 2033. Axial flow threshers move crop along the length of the drum, giving longer threshing time, higher capacity, and cleaner grain. They handle wet paddy and multiple crops well, with lower grain damage. They are popular for rice in Asia Pacific and maize in Middle East & Africa. For the market, axial flow growth raises capacity and value.
By Crop: Wheat Leads While Groundnut & Oilseeds Grow Fastest
Wheat held 34.2% share in 2026. Wheat threshers are widely used in India, Pakistan, Ethiopia, Egypt, and Afghanistan, where farmers want both clean grain and chopped straw for livestock. Many tractor-operated threshers are designed mainly for wheat, with adjustments for other small grains. Rice forms the second-largest crop group, with paddy threshers used across Asia Pacific. Maize shellers and threshers are important in Middle East & Africa.
Groundnut & Oilseeds are the fastest-growing crop group, expanding at a 5.3% CAGR through 2033. Groundnut, sunflower, soybean, and mustard need specialized drums and cleaning settings to avoid damaging seeds. Mahindra & Mahindra launched a dedicated groundnut thresher in 2025 for farmers in four states of India. Multi-crop threshers also handle oilseeds. For the market, oilseed growth adds crop-specific machine sales.
By Power Source: Tractor-operated Leads While Electric Grows Fastest
Tractor-operated held 52.4% share in 2026. Tractor-operated threshers run from the tractor’s power take-off shaft and can be towed between fields, making them popular with farmers and custom service providers in India, Pakistan, and Nepal. They offer high capacity for wheat, rice, and pulses. Engine-powered threshers with their own diesel or petrol engines are common where tractors are scarce, especially in Middle East & Africa.
Electric is the fastest-growing power source, expanding at a 6.1% CAGR through 2033. Electric threshers have lower running costs, less noise, and no exhaust fumes, and they suit villages with reliable grid power. Rural electrification in India, Bangladesh, and Vietnam supports adoption. Solar-powered small threshers are being tested in off-grid areas. For the market, electric growth reduces fuel dependence.
Geography Analysis
North America Advances the Thresher Market Through Research and Specialty Uses
North America is a small thresher market because most grain is harvested with combines. Demand comes from plant breeding stations, seed companies, universities, and research plots, where small plot threshers process individual samples. ALMACO and Wintersteiger supply these research machines. Small specialty farms in the United States and Canada use threshers for heritage grains, beans, and seed saving. Organic and small-scale growers add niche demand, and seed banks use small threshers to clean and store samples. Prices for research models are high, which supports value despite low volumes. One change shaping the region is precision plot threshers with weighing and data collection.
Europe Builds the Thresher Market Through Plot and Seed Research
Europe is a modest thresher market, as large farms rely on combines. Plant breeders, seed companies, and research institutes in Germany, France, Austria, and the Netherlands use plot threshers for trials. Countries such as Romania, Bulgaria, Poland, and Greece have many small farms that still use threshers for pulses, seeds, and some grains. Turkey-made threshers are exported to many markets. Interest in heritage grains and organic seed production supports small machines. Wintersteiger in Austria is a leading supplier of plot threshers worldwide. Key barriers include the dominance of combines. One opportunity is advanced research threshers.
Which Region Is Leading the Thresher Market?
Asia Pacific is leading the thresher market with a 47.2% share in 2026. India is the largest country market, with millions of smallholder farms growing wheat, rice, pulses, and oilseeds, and large manufacturers including Mahindra & Mahindra, TAFE, Sonalika Group, Swaraj, and Dasmesh. China has a large thresher and small harvester industry. Pakistan, Bangladesh, Nepal, Indonesia, Vietnam, and the Philippines use threshers for wheat and rice. Custom hiring centers and subsidy schemes increase access for small farmers. One change shaping the region is the shift to axial flow and multi-crop machines.
Latin America Grows the Thresher Market Through Smallholder Crops
Latin America is a moderate thresher market. Large farms in Brazil and Argentina use combines, but smallholders in Bolivia, Peru, Ecuador, Guatemala, and Honduras use threshers for beans, quinoa, rice, and maize. Mexico has many small maize and bean farms in hilly areas that use shellers and threshers after hand harvesting. Government programs and cooperatives support mechanization for small producers. Rice growers in Colombia and Peru also use portable threshers on small plots. Key barriers include fragmented landholdings, hilly terrain, and limited credit. One opportunity is compact multi-crop threshers for quinoa and other highland grains.
Which Region Is Growing Fastest in the Thresher Market?
Middle East & Africa is growing fastest in the thresher market at a 5.8% CAGR through 2033. Nigeria, Ethiopia, Tanzania, Kenya, and Ghana are expanding rice, wheat, maize, and soybean output while most smallholders still thresh by hand. Donor programs and youth-led companies such as Imara Tech and SAYeTECH are spreading affordable multi-crop threshers. Egypt and Morocco use wheat threshers widely. Pay-per-use services help farmers who cannot afford machines, and mobile money makes payment easier. Saudi Arabia supports wheat and barley farms with modern equipment. One opportunity is local manufacturing and service networks.
Competitive Landscape
The thresher market is fragmented. Mahindra & Mahindra, TAFE, Sonalika Group, Swaraj, and Dasmesh lead in India, while Kubota, Yanmar, and Iseki supply rice threshers and compact machines across Asia Pacific. Chinese makers such as Lovol and many small firms sell low-cost threshers. ALMACO and Wintersteiger lead in research plot threshers, and youth-led firms such as Imara Tech and SAYeTECH serve Middle East & Africa. Thousands of local workshops also build threshers.
Companies compete on capacity, grain cleanliness, crop flexibility, durability, safety, after-sales service, and price. Large brands benefit from tractor dealer networks and financing, while local makers compete on low prices and custom designs. Government subsidy lists and certification affect which machines qualify for support, so testing approvals are important in India and China. Custom hiring operators are a growing customer group, and they value high throughput and quick repairs.
Strategic moves show how competition is changing. In August 2024, the Alliance of Bioversity International and CIAT and partners launched a program in Tanzania to scale Imara Tech multi-crop threshers for women and youth. In October 2025, Mahindra & Mahindra launched a tractor-operated groundnut thresher with real-time grain quality and loss monitoring. These moves show competition shifting toward crop-specific and multi-crop machines with service-based models.
Three themes shape vendor strategy. First, companies are developing multi-crop and crop-specific machines. Second, they are adding safety and monitoring features. Third, they are expanding in Middle East & Africa, where mechanization is lowest and growth is fastest.
Thresher Market Industry Leaders
Mahindra & Mahindra Kubota TAFE Sonalika Group Yanmar
Recent Industry Developments
- October 2025: Mahindra & Mahindra launched a tractor-operated groundnut thresher with real-time grain quality and loss monitoring for Gujarat, Rajasthan, Madhya Pradesh, and Uttar Pradesh - expands crop-specific threshing in India.
- August 2024: The Alliance of Bioversity International and CIAT and partners began scaling Imara Tech multi-crop threshers in Tanzania with 50% cost support - widens access for women and youth service providers.
- July 2024: Tanzania Agricultural Research Institute and partners started promoting multi-crop threshers with farmer groups across nine regions - builds demand for mechanized threshing in Middle East & Africa.
Companies Covered in the Report
- Mahindra & Mahindra
- Kubota
- TAFE
- Sonalika Group
- Yanmar
- Iseki
- Swaraj
- Dasmesh
- Lovol
- ALMACO
- Wintersteiger
- Imara Tech
Thresher Market Report Scope
This report covers stationary and mobile threshers, including spike-tooth, axial flow, hammer mill, and wire-loop types, powered by tractors, engines, electric motors, or manual and pedal operation, used for wheat, rice, maize, pulses, groundnut, oilseeds, and other crops. It includes research plot threshers but excludes combine harvesters and maize shellers sold separately. The base year is 2025, and the forecast period runs from 2026 to 2033. All values are expressed in US$ Billion.
Product Type
- Spike-Tooth
- Axial Flow
- Hammer Mill
- Wire-Loop & Others
Crop
- Wheat
- Rice
- Maize
- Groundnut & Oilseeds
- Pulses & Others
Power Source
- Tractor-operated
- Engine-powered
- Electric
- Manual & Pedal
Regions
- North America
- Europe
- Asia Pacific
- Latin America
- Middle East & Africa
Key Questions Answered in the Report
How big is the thresher market in 2026?
The thresher market is valued at US$ 2.65 billion in 2026, led by spike-tooth wheat threshers used across Asia Pacific.
What is the thresher market forecast to 2033?
The thresher market is projected to reach US$ 3.52 billion by 2033, growing at a 4.1% CAGR and adding US$ 0.87 billion.
Which product type is growing fastest in the thresher market?
Axial flow threshers are growing fastest at a 5.2% CAGR through 2033, driven by higher capacity, cleaner grain, and paddy suitability.
Which region is growing fastest in the thresher market?
Middle East & Africa is growing fastest at a 5.8% CAGR through 2033, driven by smallholder mechanization in Nigeria and Tanzania.
Which region holds the largest thresher market share?
Asia Pacific holds the largest share at 47.2% in 2026, supported by millions of smallholder farms and large manufacturers in India.
1. Executive Summary
1.1. Global Thresher Market Snapshot
1.2. Future Projections
1.3. Key Report Takeaways
1.4. Regional Snapshot
2. Market Overview
2.1. Market Definition and Report Scope
2.2. Historical Trends 2020–2025
2.3. Market Dynamics
2.3.1. Drivers
2.3.1.1. Labor Shortages Are Driving the Thresher Market
2.3.1.2. Mechanization Subsidies Are Expanding the Thresher Market
2.3.2. Restraints
2.3.2.1. Combine Harvester Adoption Slows the Thresher Market
2.3.2.2. Low Incomes and Safety Concerns Restrict the Thresher Market
2.3.3. Market Opportunities
2.3.3.1. Multi-Crop and Smart Threshers Open a Value Revenue Pool
2.3.3.2. Middle East & Africa Smallholder Mechanization Creates a Volume Revenue Pool
3. Global Thresher Market Outlook, 2020-2033
3.1. Global Thresher Market Outlook, by Product Type, Value (US$ Billion), 2020-2033
3.1.1. Spike-Tooth
3.1.2. Axial Flow
3.1.3. Hammer Mill
3.1.4. Wire-Loop & Others
3.2. Global Thresher Market Outlook, by Crop, Value (US$ Billion), 2020-2033
3.2.1. Wheat
3.2.2. Rice
3.2.3. Maize
3.2.4. Groundnut & Oilseeds
3.2.5. Pulses & Others
3.3. Global Thresher Market Outlook, by Power Source, Value (US$ Billion), 2020-2033
3.3.1. Tractor-operated
3.3.2. Engine-powered
3.3.3. Electric
3.3.4. Manual & Pedal
3.4. Global Thresher Market Outlook, by Region, Value (US$ Billion), 2020-2033
3.4.1. North America
3.4.2. Europe
3.4.3. Asia Pacific
3.4.4. Latin America
3.4.5. Middle East & Africa
4. North America Thresher Market Outlook, 2020-2033
4.1. North America Thresher Market Outlook, by Product Type, Value (US$ Billion), 2020-2033
4.1.1. Spike-Tooth
4.1.2. Axial Flow
4.1.3. Hammer Mill
4.1.4. Wire-Loop & Others
4.2. North America Thresher Market Outlook, by Crop, Value (US$ Billion), 2020-2033
4.2.1. Wheat
4.2.2. Rice
4.2.3. Maize
4.2.4. Groundnut & Oilseeds
4.2.5. Pulses & Others
4.3. North America Thresher Market Outlook, by Power Source, Value (US$ Billion), 2020-2033
4.3.1. Tractor-operated
4.3.2. Engine-powered
4.3.3. Electric
4.3.4. Manual & Pedal
4.4. North America Thresher Market Outlook, by Country, Value (US$ Billion), 2020-2033
4.4.1. United States Thresher Market Outlook, by Product Type, 2020-2033
4.4.2. United States Thresher Market Outlook, by Crop, 2020-2033
4.4.3. United States Thresher Market Outlook, by Power Source, 2020-2033
4.4.4. Canada Thresher Market Outlook, by Product Type, 2020-2033
4.4.5. Canada Thresher Market Outlook, by Crop, 2020-2033
4.4.6. Canada Thresher Market Outlook, by Power Source, 2020-2033
5. Europe Thresher Market Outlook, 2020-2033
5.1. Europe Thresher Market Outlook, by Product Type, Value (US$ Billion), 2020-2033
5.1.1. Spike-Tooth
5.1.2. Axial Flow
5.1.3. Hammer Mill
5.1.4. Wire-Loop & Others
5.2. Europe Thresher Market Outlook, by Crop, Value (US$ Billion), 2020-2033
5.2.1. Wheat
5.2.2. Rice
5.2.3. Maize
5.2.4. Groundnut & Oilseeds
5.2.5. Pulses & Others
5.3. Europe Thresher Market Outlook, by Power Source, Value (US$ Billion), 2020-2033
5.3.1. Tractor-operated
5.3.2. Engine-powered
5.3.3. Electric
5.3.4. Manual & Pedal
5.4. Europe Thresher Market Outlook, by Country, Value (US$ Billion), 2020-2033
5.4.1. Germany Thresher Market Outlook, by Product Type, 2020-2033
5.4.2. Germany Thresher Market Outlook, by Crop, 2020-2033
5.4.3. Germany Thresher Market Outlook, by Power Source, 2020-2033
5.4.4. France Thresher Market Outlook, by Product Type, 2020-2033
5.4.5. France Thresher Market Outlook, by Crop, 2020-2033
5.4.6. France Thresher Market Outlook, by Power Source, 2020-2033
5.4.7. Austria Thresher Market Outlook, by Product Type, 2020-2033
5.4.8. Austria Thresher Market Outlook, by Crop, 2020-2033
5.4.9. Austria Thresher Market Outlook, by Power Source, 2020-2033
5.4.10. Netherlands Thresher Market Outlook, by Product Type, 2020-2033
5.4.11. Netherlands Thresher Market Outlook, by Crop, 2020-2033
5.4.12. Netherlands Thresher Market Outlook, by Power Source, 2020-2033
5.4.13. Romania Thresher Market Outlook, by Product Type, 2020-2033
5.4.14. Romania Thresher Market Outlook, by Crop, 2020-2033
5.4.15. Romania Thresher Market Outlook, by Power Source, 2020-2033
5.4.16. Bulgaria Thresher Market Outlook, by Product Type, 2020-2033
5.4.17. Bulgaria Thresher Market Outlook, by Crop, 2020-2033
5.4.18. Bulgaria Thresher Market Outlook, by Power Source, 2020-2033
5.4.19. Poland Thresher Market Outlook, by Product Type, 2020-2033
5.4.20. Poland Thresher Market Outlook, by Crop, 2020-2033
5.4.21. Poland Thresher Market Outlook, by Power Source, 2020-2033
5.4.22. Greece Thresher Market Outlook, by Product Type, 2020-2033
5.4.23. Greece Thresher Market Outlook, by Crop, 2020-2033
5.4.24. Greece Thresher Market Outlook, by Power Source, 2020-2033
5.4.25. Turkey Thresher Market Outlook, by Product Type, 2020-2033
5.4.26. Turkey Thresher Market Outlook, by Crop, 2020-2033
5.4.27. Turkey Thresher Market Outlook, by Power Source, 2020-2033
6. Asia Pacific Thresher Market Outlook, 2020-2033
6.1. Asia Pacific Thresher Market Outlook, by Product Type, Value (US$ Billion), 2020-2033
6.1.1. Spike-Tooth
6.1.2. Axial Flow
6.1.3. Hammer Mill
6.1.4. Wire-Loop & Others
6.2. Asia Pacific Thresher Market Outlook, by Crop, Value (US$ Billion), 2020-2033
6.2.1. Wheat
6.2.2. Rice
6.2.3. Maize
6.2.4. Groundnut & Oilseeds
6.2.5. Pulses & Others
6.3. Asia Pacific Thresher Market Outlook, by Power Source, Value (US$ Billion), 2020-2033
6.3.1. Tractor-operated
6.3.2. Engine-powered
6.3.3. Electric
6.3.4. Manual & Pedal
6.4. Asia Pacific Thresher Market Outlook, by Country, Value (US$ Billion), 2020-2033
6.4.1. India Thresher Market Outlook, by Product Type, 2020-2033
6.4.2. India Thresher Market Outlook, by Crop, 2020-2033
6.4.3. India Thresher Market Outlook, by Power Source, 2020-2033
6.4.4. China Thresher Market Outlook, by Product Type, 2020-2033
6.4.5. China Thresher Market Outlook, by Crop, 2020-2033
6.4.6. China Thresher Market Outlook, by Power Source, 2020-2033
6.4.7. Pakistan Thresher Market Outlook, by Product Type, 2020-2033
6.4.8. Pakistan Thresher Market Outlook, by Crop, 2020-2033
6.4.9. Pakistan Thresher Market Outlook, by Power Source, 2020-2033
6.4.10. Bangladesh Thresher Market Outlook, by Product Type, 2020-2033
6.4.11. Bangladesh Thresher Market Outlook, by Crop, 2020-2033
6.4.12. Bangladesh Thresher Market Outlook, by Power Source, 2020-2033
6.4.13. Nepal Thresher Market Outlook, by Product Type, 2020-2033
6.4.14. Nepal Thresher Market Outlook, by Crop, 2020-2033
6.4.15. Nepal Thresher Market Outlook, by Power Source, 2020-2033
6.4.16. Indonesia Thresher Market Outlook, by Product Type, 2020-2033
6.4.17. Indonesia Thresher Market Outlook, by Crop, 2020-2033
6.4.18. Indonesia Thresher Market Outlook, by Power Source, 2020-2033
6.4.19. Vietnam Thresher Market Outlook, by Product Type, 2020-2033
6.4.20. Vietnam Thresher Market Outlook, by Crop, 2020-2033
6.4.21. Vietnam Thresher Market Outlook, by Power Source, 2020-2033
6.4.22. Philippines Thresher Market Outlook, by Product Type, 2020-2033
6.4.23. Philippines Thresher Market Outlook, by Crop, 2020-2033
6.4.24. Philippines Thresher Market Outlook, by Power Source, 2020-2033
7. Latin America Thresher Market Outlook, 2020-2033
7.1. Latin America Thresher Market Outlook, by Product Type, Value (US$ Billion), 2020-2033
7.1.1. Spike-Tooth
7.1.2. Axial Flow
7.1.3. Hammer Mill
7.1.4. Wire-Loop & Others
7.2. Latin America Thresher Market Outlook, by Crop, Value (US$ Billion), 2020-2033
7.2.1. Wheat
7.2.2. Rice
7.2.3. Maize
7.2.4. Groundnut & Oilseeds
7.2.5. Pulses & Others
7.3. Latin America Thresher Market Outlook, by Power Source, Value (US$ Billion), 2020-2033
7.3.1. Tractor-operated
7.3.2. Engine-powered
7.3.3. Electric
7.3.4. Manual & Pedal
7.4. Latin America Thresher Market Outlook, by Country, Value (US$ Billion), 2020-2033
7.4.1. Brazil Thresher Market Outlook, by Product Type, 2020-2033
7.4.2. Brazil Thresher Market Outlook, by Crop, 2020-2033
7.4.3. Brazil Thresher Market Outlook, by Power Source, 2020-2033
7.4.4. Argentina Thresher Market Outlook, by Product Type, 2020-2033
7.4.5. Argentina Thresher Market Outlook, by Crop, 2020-2033
7.4.6. Argentina Thresher Market Outlook, by Power Source, 2020-2033
7.4.7. Bolivia Thresher Market Outlook, by Product Type, 2020-2033
7.4.8. Bolivia Thresher Market Outlook, by Crop, 2020-2033
7.4.9. Bolivia Thresher Market Outlook, by Power Source, 2020-2033
7.4.10. Peru Thresher Market Outlook, by Product Type, 2020-2033
7.4.11. Peru Thresher Market Outlook, by Crop, 2020-2033
7.4.12. Peru Thresher Market Outlook, by Power Source, 2020-2033
7.4.13. Ecuador Thresher Market Outlook, by Product Type, 2020-2033
7.4.14. Ecuador Thresher Market Outlook, by Crop, 2020-2033
7.4.15. Ecuador Thresher Market Outlook, by Power Source, 2020-2033
7.4.16. Guatemala Thresher Market Outlook, by Product Type, 2020-2033
7.4.17. Guatemala Thresher Market Outlook, by Crop, 2020-2033
7.4.18. Guatemala Thresher Market Outlook, by Power Source, 2020-2033
7.4.19. Honduras Thresher Market Outlook, by Product Type, 2020-2033
7.4.20. Honduras Thresher Market Outlook, by Crop, 2020-2033
7.4.21. Honduras Thresher Market Outlook, by Power Source, 2020-2033
7.4.22. Mexico Thresher Market Outlook, by Product Type, 2020-2033
7.4.23. Mexico Thresher Market Outlook, by Crop, 2020-2033
7.4.24. Mexico Thresher Market Outlook, by Power Source, 2020-2033
7.4.25. Colombia Thresher Market Outlook, by Product Type, 2020-2033
7.4.26. Colombia Thresher Market Outlook, by Crop, 2020-2033
7.4.27. Colombia Thresher Market Outlook, by Power Source, 2020-2033
8. Middle East & Africa Thresher Market Outlook, 2020-2033
8.1. Middle East & Africa Thresher Market Outlook, by Product Type, Value (US$ Billion), 2020-2033
8.1.1. Spike-Tooth
8.1.2. Axial Flow
8.1.3. Hammer Mill
8.1.4. Wire-Loop & Others
8.2. Middle East & Africa Thresher Market Outlook, by Crop, Value (US$ Billion), 2020-2033
8.2.1. Wheat
8.2.2. Rice
8.2.3. Maize
8.2.4. Groundnut & Oilseeds
8.2.5. Pulses & Others
8.3. Middle East & Africa Thresher Market Outlook, by Power Source, Value (US$ Billion), 2020-2033
8.3.1. Tractor-operated
8.3.2. Engine-powered
8.3.3. Electric
8.3.4. Manual & Pedal
8.4. Middle East & Africa Thresher Market Outlook, by Country, Value (US$ Billion), 2020-2033
8.4.1. Nigeria Thresher Market Outlook, by Product Type, 2020-2033
8.4.2. Nigeria Thresher Market Outlook, by Crop, 2020-2033
8.4.3. Nigeria Thresher Market Outlook, by Power Source, 2020-2033
8.4.4. Ethiopia Thresher Market Outlook, by Product Type, 2020-2033
8.4.5. Ethiopia Thresher Market Outlook, by Crop, 2020-2033
8.4.6. Ethiopia Thresher Market Outlook, by Power Source, 2020-2033
8.4.7. Tanzania Thresher Market Outlook, by Product Type, 2020-2033
8.4.8. Tanzania Thresher Market Outlook, by Crop, 2020-2033
8.4.9. Tanzania Thresher Market Outlook, by Power Source, 2020-2033
8.4.10. Kenya Thresher Market Outlook, by Product Type, 2020-2033
8.4.11. Kenya Thresher Market Outlook, by Crop, 2020-2033
8.4.12. Kenya Thresher Market Outlook, by Power Source, 2020-2033
8.4.13. Ghana Thresher Market Outlook, by Product Type, 2020-2033
8.4.14. Ghana Thresher Market Outlook, by Crop, 2020-2033
8.4.15. Ghana Thresher Market Outlook, by Power Source, 2020-2033
8.4.16. Egypt Thresher Market Outlook, by Product Type, 2020-2033
8.4.17. Egypt Thresher Market Outlook, by Crop, 2020-2033
8.4.18. Egypt Thresher Market Outlook, by Power Source, 2020-2033
8.4.19. Morocco Thresher Market Outlook, by Product Type, 2020-2033
8.4.20. Morocco Thresher Market Outlook, by Crop, 2020-2033
8.4.21. Morocco Thresher Market Outlook, by Power Source, 2020-2033
8.4.22. Saudi Arabia Thresher Market Outlook, by Product Type, 2020-2033
8.4.23. Saudi Arabia Thresher Market Outlook, by Crop, 2020-2033
8.4.24. Saudi Arabia Thresher Market Outlook, by Power Source, 2020-2033
9. Competitive Landscape
9.1. Market Concentration and Industry Leaders
9.2. Competitive Differentiation
9.3. Strategic Moves and Market Direction
9.4. Recent Industry Developments
9.5. Company Profiles
9.5.1. Mahindra & Mahindra
9.5.2. Kubota
9.5.3. TAFE
9.5.4. Sonalika Group
9.5.5. Yanmar
9.5.6. Iseki
9.5.7. Swaraj
9.5.8. Dasmesh
9.5.9. Lovol
9.5.10. ALMACO
9.5.11. Wintersteiger
9.5.12. Imara Tech
10. Appendix
10.1. Research Methodology
10.2. Report Assumptions
10.3. Acronyms and Abbreviations
| Product Type | Spike-Tooth, Axial Flow, Hammer Mill, Wire-Loop & Others |
| Crop | Wheat, Rice, Maize, Groundnut & Oilseeds, Pulses & Others |
| Power Source | Tractor-operated, Engine-powered, Electric, Manual & Pedal |
| Regions | North America, Europe, Asia Pacific, Latin America, Middle East & Africa |
Our Research Methodology
Considering the volatility of business today, traditional approaches to strategizing a game plan can be unfruitful if not detrimental. True ambiguity is no way to determine a forecast. A myriad of predetermined factors must be accounted for such as the degree of risk involved, the magnitude of circumstances, as well as conditions or consequences that are not known or unpredictable. To circumvent binary views that cast uncertainty, the application of market research intelligence to strategically posture, move, and enable actionable outcomes is necessary.
View Methodology
Quality Assured
Rigorous Validation Process

Confidentiality Assured
End-to-end Data Security

Custom Research Services
Tailored To Your Objectives
FAQs
The thresher market is valued at US$ 2.65 billion in 2026, led by spike-tooth wheat threshers used across Asia Pacific.
The thresher market is projected to reach US$ 3.52 billion by 2033, growing at a 4.1% CAGR and adding US$ 0.87 billion.
Axial flow threshers are growing fastest at a 5.2% CAGR through 2033, driven by higher capacity, cleaner grain, and paddy suitability.
Middle East & Africa is growing fastest at a 5.8% CAGR through 2033, driven by smallholder mechanization in Nigeria and Tanzania.
Asia Pacific holds the largest share at 47.2% in 2026, supported by millions of smallholder farms and large manufacturers in India.
Related Reports
Rotary Sprinkler System Market Size, Share, Insights, Competitive Landscape, and Forecast 2026 to 2033
Rotary sprinkler system market to reach US$ 4.99 billion by 2033 at a 5.5% CAGR. Explore product types, smart controls, applications and regional trends.
Greenhouse Multi-Layer Benching Systems Market Size, Share, Insights, Competitive Landscape, and Forecast 2026 to 2033
Greenhouse multi-layer benching systems market to reach US$ 2.09 billion by 2033 at a 7.0% CAGR. Explore benching types, crops and regional trends.
Food and Beverage Automated Storage Retrieval System Market Size, Share, Insights, Competitive Landscape, and Forecast 2026 to 2033
Food and beverage AS/RS market to reach US$ 3.10 billion by 2033 at a 9.7% CAGR. Explore system types, temperature ranges and regional trends.
Agricultural Haying and Forage Machinery Market Size, Share, Insights, Competitive Landscape, and Forecast 2026 to 2033
Agricultural haying and forage machinery market to reach US$ 13.06 billion by 2033 at a 4.1% CAGR. Explore products, operations and regional trends.
Valve Remote Control System Market Size, Share, Insights, Competitive Landscape, and Forecast 2026 to 2033
Valve remote control system market to reach US$ 15.16 billion by 2033 at a 6.5% CAGR. Explore actuation types, applications and regional trends.
Torque Sensors for Robotic Systems Market Size, Share, Insights, Competitive Landscape, and Forecast 2026 to 2033
Torque sensors for robotic systems market to reach US$ 5.61 billion by 2033 at an 11.0% CAGR. Explore sensor types, robot types and regional trends.