



Polymer Emulsion Market
Polymer Emulsion Market Size, Share, Insights, Competitive Landscape, and Forecast 2026 to 2033
Polymer Emulsion Market Size and Trend Analysis
How Fast Will the Polymer Emulsion Market Grow by 2033?
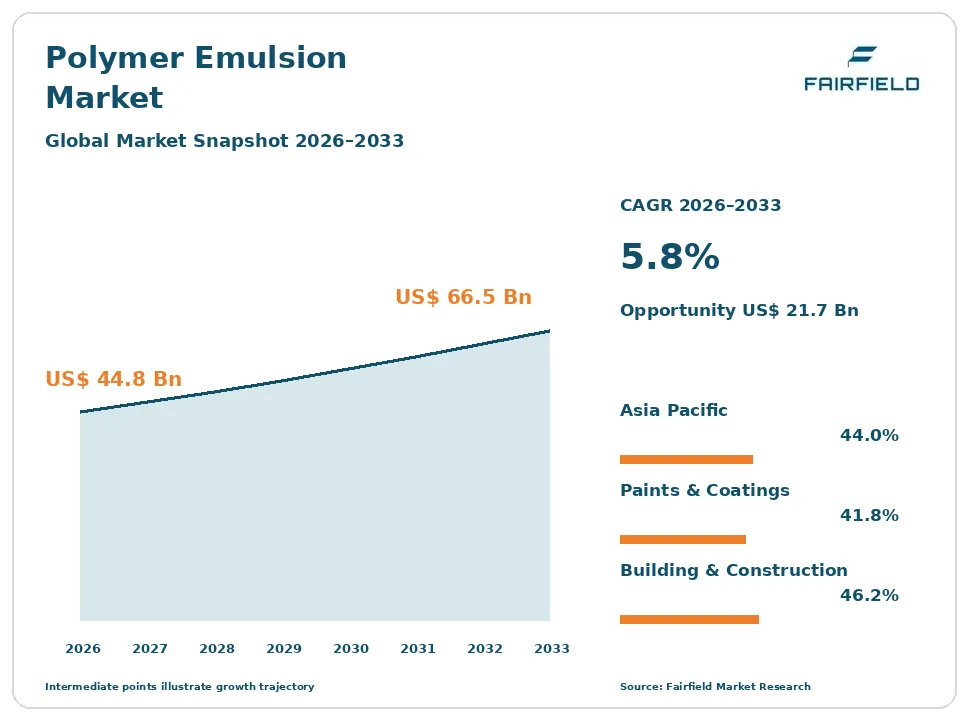
The global polymer emulsion market size is expected to be valued at US$ 44.8 billion in 2026 and projected to reach US$ 66.5 billion by 2033, growing at a CAGR of 5.8% between 2026 and 2033.
Between 2020 and 2025 the market expanded at roughly 4.6% a year, held back by a weak residential construction cycle and by sharp monomer cost swings that compressed volumes. Three factors carry growth through 2033. Solventborne-to-waterborne conversion still has headroom in industrial, wood and protective coatings, where regulatory limits bite later than in decorative paint. Construction chemicals such as cement modifiers, tile adhesives and liquid-applied waterproofing membranes are absorbing more latex binders per square metre of building. Architectural demand in emerging economies is rising with urban housing stock. The overall direction is steady, volume-led commodity growth tied to building activity rather than to a technology adoption curve.
Key Report Takeaways
- By Product Type: Pure acrylic dispersions held 23.8% share in 2026, while bio-based and partially bio-based grades are projected to expand at an 11.6% CAGR through 2033, driven by embodied-carbon criteria entering architectural and building-product specifications.
- By Application: Paints and coatings held 41.8% share in 2026, while construction chemicals are projected to expand at a 7.9% CAGR through 2033, driven by polymer-modified mortars and liquid-applied waterproofing replacing bitumen sheet systems.
- By End-use Industry: Building and construction held 46.2% share in 2026, while healthcare and personal protection is projected to grow at a 7.6% CAGR through 2033, driven by nitrile examination glove capacity shifting toward Asian and emerging producers.
- By Solids Content: Medium-solids dispersions held 54.3% share in 2026, while high-solids grades are projected to advance at a 7.4% CAGR through 2033, driven by freight economics that penalise shipping water over long distances.
- By Geography: Asia Pacific held 44.0% share in 2026, while Middle East & Africa is projected to post a 7.8% CAGR through 2033, driven by Gulf construction programmes and rising decorative paint penetration across African cities.
Global Polymer Emulsion Market Trends and Insights
Drivers Impact Analysis
| Driver | Impact on CAGR Forecast | Geographic Relevance | Impact Timeline |
| Remaining solventborne conversion in industrial, wood and protective coatings | High | Europe, North America, Asia Pacific | Medium term (2–4 years) |
| Latex binder intensity rising in construction chemicals and waterproofing | High | Asia Pacific, Middle East & Africa, Latin America | Long term (≥4 years) |
Two forces account for most of the incremental volume added to waterborne polymer dispersions through 2033.
Unfinished Solventborne Conversion in Industrial Coatings Keeps Polymer Emulsion Volumes Climbing
The substitution that built this industry is largely finished in architectural paint in developed markets, but it is still running in industrial coatings. Waterborne dispersions now hold most decorative paint volume in Europe and North America, so growth there tracks the building cycle. Industrial wood finishes, metal primers, coil coatings, protective maintenance systems and plastic coatings remain substantially solventborne, and each conversion moves a large tonnage of resin into emulsion form.
The mechanism is regulatory and technical at once. Volatile organic compound limits under the EU Paints Directive and the architectural coatings rules of the US Environmental Protection Agency and the California Air Resources Board removed the easy solventborne options first. Industrial applications were given longer because waterborne films struggled on hardness, corrosion resistance and humidity-dependent drying. Self-crosslinking acrylics, hybrid acrylic-polyurethane systems and higher glass-transition-temperature latex binders have narrowed that performance gap enough for specifiers to switch.
Polymer-Modified Construction Chemicals Lift Latex Binder Consumption per Building
Construction chemicals are adding dispersion volume faster than any other established outlet, because each formulation uses more binder than the product it replaces. Polymer-modified cementitious mortars, tile adhesives, self-levelling screeds, external insulation render systems and liquid-applied waterproofing membranes all depend on redispersible or liquid latex to deliver flexibility, adhesion and crack bridging. A square metre of liquid-applied roofing membrane consumes several times the binder of a comparable painted surface.
Two causes drive this. Building codes and durability expectations increasingly demand crack-bridging waterproofing on balconies, wet rooms, podium decks and basements, work that bitumen sheet once handled with no polymer content. Separately, indoor air quality schemes and low-emission product labelling for construction products favour water-based systems over solvent-carried alternatives, and formaldehyde limits push formulators away from older binder chemistries. Both effects raise latex content per completed building rather than simply raising the number of buildings.
Restraints Impact Analysis
| Restraint | Impact on CAGR Forecast | Geographic Relevance | Impact Timeline |
| Monomer price volatility in vinyl acetate, acrylic esters, styrene and butadiene | High | Global | Short term (≤2 years) |
| Regulatory tightening on isothiazolinone in-can preservatives | Medium | Europe, North America | Medium term (2–4 years) |
Two structural pressures sit on margins and on formulation freedom across the waterborne dispersion business.
Monomer Price Swings Pass Straight Through Thin Polymer Emulsion Margins
Monomer cost is the single biggest swing factor in dispersion profitability, and it is largely outside producer control. Vinyl acetate monomer, butyl acrylate, 2-ethylhexyl acrylate, styrene and butadiene typically account for the large majority of a finished dispersion’s cost. Because emulsion polymerisation adds modest conversion value on top of that raw material, a monomer spike that cannot be repriced within a quarter removes most of the margin on a contract.
The underlying cause is that these monomers are petrochemical derivatives whose pricing follows naphtha, ethylene, propylene and crude butadiene availability rather than paint demand. Butadiene in particular is a by-product of steam cracking, so its supply moves with cracker feedstock slates instead of with styrene-butadiene latex orders. Customers in architectural paint and paper coating negotiate annually and resist mid-year increases, so the lag between monomer escalation and price recovery is where producer earnings are lost.
Isothiazolinone Preservative Rules Force Costly Reformulation of Water-Based Dispersions
In-can preservative chemistry is under genuine regulatory pressure, and it is a hard problem for a product that is mostly water. Every waterborne dispersion needs biocidal protection against bacterial and fungal spoilage in the drum. The isothiazolinone actives that have done this work for decades are classified as skin sensitisers, with tightened labelling thresholds and concentration limits that force sensitisation warnings onto consumer-facing paint at levels once considered routine.
The cause is a convergence of two regimes. The EU Biocidal Products Regulation requires active substance approval and product authorisation, which has narrowed the approved palette and raised registration cost per active. Separately, harmonised classification and labelling treatment of isothiazolinones, including methylisothiazolinone, lowered the concentration at which sensitisation labelling applies. Producers must requalify shelf life, microbial challenge testing and plant hygiene for every affected grade, and alternative actives generally cost more per kilogram while offering a narrower spectrum.
Market Opportunities
Low-Carbon and Bio-Based Dispersions Open a Premium Grade Pool in Specified Construction
Bio-based and partially bio-based dispersions are the fastest-expanding product pool in the market, because buyers have begun to specify embodied carbon rather than only performance. Grades built on bio-derived monomers, bio-attributed feedstock allocation or renewable-content binders command a price premium that conventional acrylic emulsion cannot. This converts a sustainability claim into a distinct revenue line with its own margin structure, instead of a cost added to an existing commodity grade.
Paint manufacturers, construction product makers and large building owners create the demand. Green building rating schemes and the EU Ecolabel criteria for paints and varnishes award points for low-emission and renewable-content formulations, and public procurement increasingly asks for environmental product declarations. That gives a coatings customer a commercial reason to pay more for a certified binder. Producers with mass-balance certification and verified cradle-to-gate carbon data are positioned to capture this pool.
Preservative-Reduced and High-Solids Platforms Create a Reformulation Revenue Pool
Dispersion grades that need less in-can biocide, or none, open a premium reformulation market that did not exist a decade ago. Retailers and specifiers in sensitised categories now ask for paint without sensitisation labelling, and formulators will pay for a binder that makes that possible. Technologies include polymer-bound biocidal functionality, pH and preservative-free manufacturing in closed hygienic plants, and grades supplied for immediate conversion rather than long storage.
The same engineering effort supports high-solids dispersions, which address the other persistent cost in this business. Shipping a dispersion means shipping water, so raising solids from the mid-forties toward sixty percent cuts freight, drum and warehouse cost per kilogram of delivered polymer. Decorative paint companies, tile adhesive makers and paper coating mills within a few hundred kilometres of a plant are the natural buyers, and REACH registration data already supports these grades.
Segment Analysis
By Product Type: Pure Acrylic Holds the Core While Bio-Based Grades Scale Fastest
Pure acrylic dispersions led the product mix with 23.8% share in 2026, because acrylic chemistry delivers the ultraviolet stability, alkali resistance and wet adhesion that exterior masonry paint and elastomeric roof coatings require. Styrene-acrylic grades followed at 19.5%, trading some weathering performance for cost, while vinyl acetate-ethylene and other vinyl copolymers took 18.6% on the strength of interior paint, adhesives and redispersible powder feedstock. Styrene-butadiene latex held 14.4%, concentrated in paper coating and carpet backing.
Bio-based and partially bio-based grades are the growth story at an 11.6% CAGR through 2033, from a small 2.2% base. Renewable-content monomers and mass-balance allocation let producers supply a drop-in binder with a verified lower cradle-to-gate footprint. Polyurethane dispersions, at 6.1%, grow on wood, leather and flexible packaging adhesives. The implication is that value migration, not volume migration, defines the premium end of the product portfolio.
By Application: Paints and Coatings Dominate as Construction Chemicals Accelerate
Paints and coatings absorbed 41.8% of waterborne dispersion demand in 2026, the largest single outlet, because architectural and decorative paint is the highest-tonnage use of latex binders anywhere. Adhesives and sealants followed at 20.4%, spanning packaging, woodworking and pressure-sensitive laminating. Paper and paperboard coating and board sizing held 13.1%, supported by fibre-based packaging replacing plastic, where food contact rules govern which binders may be used on the product side.
Construction chemicals, at 8.2% share, expand fastest at a 7.9% CAGR through 2033. Polymer-modified mortars, tile adhesives, screeds and liquid-applied waterproofing each carry higher binder loading than a painted surface, so the segment grows in value faster than in square metres. Nonwovens and textile binders took 7.6%, carpet backing 5.3% and gloves and dipped goods 3.6%. For producers, the practical consequence is a shift in technical service toward cementitious compatibility testing.
By End-use Industry: Building and Construction Anchors Volume While Healthcare Grows Quickest
Building and construction consumed 46.2% of polymer emulsion volume in 2026, a share no other industry approaches, because paint, adhesives, sealants, mortars and membranes all route through the same construction cycle. Paper, packaging and printing followed at 14.8%, and textiles, carpets and nonwovens took 13.5%. Automotive and transportation accounted for 9.7%, largely through waterborne primers, interior laminating adhesives and acoustic treatments, with furniture and woodworking at 9.4%.
Healthcare and personal protection, at 6.4% share, is the fastest-growing end use at a 7.6% CAGR through 2033. Nitrile and other specialty latexes feed examination and surgical glove lines, and demand is normalising upward after post-pandemic destocking, with new dipping capacity concentrated in Malaysia, Thailand, Vietnam and India. The business implication is that producers serving gloves need medical-grade quality systems and protein and accelerator control that commodity paint grades never require.
By Solids Content: Medium-Solids Grades Lead as High-Solids Dispersions Gain on Freight Cost
Medium-solids dispersions between 40% and 55% held 54.3% share in 2026, the default commercial format because it balances pumpability, stability and mechanical shear tolerance at the customer’s mixer. Low-solids grades below 40% took 22.6%, used where penetration into porous substrates, fine filament binding in nonwovens or spray viscosity matters more than transport efficiency. These lower-solids formats also tolerate wider particle size distributions and simpler filtration.
High-solids grades above 55% hold 23.1% share and grow fastest at a 7.4% CAGR through 2033. The reason is freight: a dispersion is mostly water, and raising solids by ten points removes roughly a fifth of the shipped mass per kilogram of delivered polymer. Achieving it requires bimodal particle size design and careful surfactant selection to keep viscosity workable. The implication is that high-solids capability lets a producer serve a wider delivery radius from the same plant.
Geography Analysis
North America Shifts From Substitution Growth to Repaint-Cycle Demand
North America accounted for 21.0% of global polymer emulsion demand in 2026 and is forecast to grow at 4.7% a year to 2033, the slowest of the five regions. The United States dominates, with Canada and Mexico adding converting and adhesives capacity. Waterborne substitution in architectural paint is essentially complete here, so volume now follows housing starts, repaint cycles and commercial refurbishment rather than chemistry change.
The remaining conversion runway sits in industrial maintenance, coil and wood coatings, where US Environmental Protection Agency rules and California Air Resources Board architectural coatings limits set the baseline that state programmes tighten. Regional producers compete on technical service and delivery radius rather than on price alone, because freight on a water-based product penalises long hauls. The clearest change shaping the region is demand for binders carrying verified low-emission and low-odour credentials in commercial specifications.
How Regulation Built Europe’s Waterborne Dispersion Industry
Europe held 24.5% share in 2026 and grows at 4.3% through 2033, the lowest regional rate, because its substitution story finished earliest. Germany, France, Italy, Spain, the Netherlands and Poland account for most consumption, supported by a dense base of emulsion plants placed close to paint and construction chemical customers. The Paints Directive volatile organic compound limits are the reason the regional industry looks the way it does.
Regulatory intensity now shapes product design more than volume. The Biocidal Products Regulation, classification treatment of isothiazolinones, REACH registration and the restriction on intentionally added microplastics all land on formulators at once, and compliance capability has become a competitive asset. The barrier is energy and feedstock cost relative to other producing regions, which pressures commodity grades. The opportunity lies in EU Ecolabel qualified and renewable-content binders, where regional buyers pay a premium that commodity markets will not.
Which Region Is Leading the Polymer Emulsion Market?
Asia Pacific is leading the polymer emulsion market, with 44.0% share in 2026 and a 6.9% CAGR to 2033, the largest absolute growth of any region. China alone supplies and consumes the greatest volume, with India, Japan, Korea, Indonesia, Vietnam and Thailand adding capacity. Scale comes from three things at once: the world’s largest construction pipeline, the largest paper and packaging converting base, and most global glove dipping capacity.
Substitution still has real room here. Decorative paint in several markets remains partly solventborne, and national volatile organic compound rules are tightening on a later schedule than in Europe. Local monomer integration into vinyl acetate and acrylic esters gives regional producers a cost position that imports cannot match once freight on water is counted. The change to watch is premiumisation of architectural paint in urban India and coastal China, which pulls demand toward higher-performance acrylic emulsion grades.
Latin America Builds Local Dispersion Capacity to Escape Import Freight
Latin America held 6.0% share in 2026 and grows at 6.4% to 2033, ahead of the mature regions. Brazil and Mexico account for most consumption, with Colombia, Chile and Argentina contributing steadily. Decorative paint for housing repair and self-build construction is the dominant outlet, and vinyl acetate-based and styrene-acrylic grades carry more of the mix here than in higher-income markets because affordability governs formulation choice.
The main barriers are currency volatility that makes dollar-denominated monomer purchases unpredictable, and uneven enforcement of coatings emission rules across national jurisdictions. Logistics costs inland from port cities are a further drag. The opportunity is import substitution: because shipping a dispersion means shipping water, locally sited emulsion capacity has a durable structural advantage over imported product, and regional converters increasingly prefer suppliers able to deliver within a short haul.
Which Region Is Growing Fastest in the Polymer Emulsion Market?
Middle East & Africa is growing fastest in the polymer emulsion market, at a 7.8% CAGR through 2033 from a 4.5% share in 2026, the smallest base of the five regions. Saudi Arabia, the United Arab Emirates, Egypt, Nigeria, Morocco and South Africa drive most of the increase. Gulf infrastructure and residential construction programmes consume large volumes of exterior masonry paint, waterproofing membranes and polymer-modified mortars.
Two causes explain the pace. Decorative paint penetration per person remains well below global averages across much of the continent, so urbanisation converts directly into first-time painted surface area. Separately, regional petrochemical integration gives Gulf producers access to competitively priced acrylic and vinyl feedstock. Barriers are real: fragmented distribution, limited technical service and inconsistent product standards slow premium grade adoption. The change underway is construction chemical formulators localising production, which anchors nearby dispersion demand.
Competitive Landscape
The polymer emulsion market is moderately concentrated at the global level and fragmented regionally, an unusual combination explained by freight. A handful of integrated chemical companies hold leading global positions through monomer backward integration and multi-continent plant networks, yet in any individual country a regional or family-owned emulsion producer can hold meaningful share simply by being closer to the customer. Shipping a dispersion means shipping water, so delivery radius caps how far a large producer’s cost advantage reaches. Consolidation has therefore proceeded by acquiring regional plants and customer books rather than by building export scale.
Competition runs on four things. Monomer integration and feedstock flexibility decide who survives a price spike, since monomers dominate the cost base. Technical service capability matters because customers do not buy a dispersion, they buy a paint or adhesive that must pass their own performance tests. Regulatory capability has become a differentiator in its own right, covering biocide authorisation, registration dossiers and substance restriction compliance. Finally, verified sustainability data, including renewable content and cradle-to-gate carbon figures, now appears in tenders that once asked only for price and specification.
Strategic activity concentrates on capacity placed near demand, on debottlenecking existing reactor trains rather than greenfield builds, and on portfolio moves toward specialty dispersions with defensible margins. Several producers have narrowed commodity exposure while expanding polyurethane dispersion, specialty latex and construction chemical binder lines. Partnerships with paint and construction chemical customers to co-develop low-biocide and renewable-content grades are increasingly common, because the qualification burden is shared.
The broad strategic direction is clear. Producers are trying to replace exposure to a volatile commodity spread with positions in grades where formulation knowledge, regulatory documentation and proximity create switching cost.
Polymer Emulsion Industry Leaders
- BASF SE
- Dow Inc.
- Arkema S.A.
- Wacker Chemie AG
- Synthomer plc
Recent Industry Developments
- January 2010: The second and stricter phase of volatile organic compound limits under the EU Paints Directive became applicable to decorative paints and varnishes placed on the market – it closed most remaining solventborne options in European architectural coatings and locked in waterborne dispersions as the default binder.
- September 2013: The EU Biocidal Products Regulation became applicable, requiring active substance approval and product authorisation for in-can preservatives – it narrowed the approved biocide palette available to protect waterborne dispersions and raised the fixed cost of maintaining each preserved grade.
- May 2020: A harmonised EU classification of methylisothiazolinone as a skin sensitiser with a lowered generic concentration limit became applicable under the classification and labelling rules – it forced sensitisation labelling onto consumer paints at previously routine preservative levels and triggered widespread reformulation.
- October 2023: The EU restriction on intentionally added microplastics under REACH entered into force – it obliged dispersion producers and their formulating customers to assess whether a polymer loses its particle character on film formation, clarifying the status of coatings and adhesives binders.
Companies Covered in the Report
- BASF SE
- Dow Inc.
- Arkema S.A.
- Wacker Chemie AG
- Celanese Corporation
- Synthomer plc
- Trinseo PLC
- Nippon Shokubai Co., Ltd.
- DIC Corporation
- Covestro AG
- The Lubrizol Corporation
- Zeon Corporation
- Vinavil S.p.A.
- Organik Kimya
Polymer Emulsion Market Report Scope
This report covers waterborne polymer dispersions and latexes made by emulsion polymerisation and sold into coatings, adhesives, paper, nonwovens, construction chemicals and dipped goods. Solventborne resins, powder coatings and solid polymers are excluded, and all values are stated on a wet dispersion basis rather than dry solids. The base year is 2025, the forecast period runs from 2026 to 2033, and all values are expressed in US$ Billion.
Product Type
- Pure Acrylic
- Styrene-Acrylic
- Vinyl Acetate Homopolymer
- Vinyl Acetate-Ethylene and Other Vinyl Copolymers
- Styrene-Butadiene Latex
- Polyurethane Dispersions
- Nitrile and Other Specialty Latexes
- Bio-based and Partially Bio-based Grades
Application
- Paints and Coatings
- Adhesives and Sealants
- Paper and Paperboard Coating and Board Sizing
- Carpet Backing
- Nonwovens and Textile Binders
- Construction Chemicals
- Gloves and Dipped Goods
End-use Industry
- Building and Construction
- Paper, Packaging and Printing
- Textiles, Carpets and Nonwovens
- Healthcare and Personal Protection
- Automotive and Transportation
- Furniture and Woodworking
Solids Content
- Low Solids (Below 40%)
- Medium Solids (40–55%)
- High Solids (Above 55%)
Regions
- North America
- Europe
- Asia Pacific
- Latin America
- Middle East & Africa
Key Questions Answered in the Report
How big is the polymer emulsion market in 2026?
The global polymer emulsion market is valued at US$ 44.8 billion in 2026, measured on a wet dispersion basis across all end-use applications and all five standard regions.
What is the forecast size and CAGR of the polymer emulsion market by 2033?
The market is projected to reach US$ 66.5 billion by 2033, growing at a 5.8% CAGR and adding an absolute opportunity of US$ 21.7 billion.
Which product type leads the polymer emulsion market?
Pure acrylic dispersions lead with 23.8% share in 2026, because acrylic chemistry provides the ultraviolet stability and alkali resistance exterior architectural coatings require.
Which segment and region are growing fastest in the polymer emulsion market?
Bio-based and partially bio-based grades grow fastest at 11.6%, and Middle East & Africa is the fastest region at a 7.8% CAGR through 2033.
Which region holds the largest polymer emulsion market share?
Asia Pacific holds the largest share at 44.0% in 2026, supported by its construction pipeline, paper converting base and concentration of glove dipping capacity.
1. Executive Summary
1.1. Global Polymer Emulsion Market Snapshot
1.2. Future Projections
1.3. Key Report Takeaways
1.4. Regional Snapshot
2. Market Overview
2.1. Market Definition and Report Scope
2.2. Historical Trends 2020–2025
2.3. Market Dynamics
2.3.1. Drivers
2.3.1.1. Unfinished Solventborne Conversion in Industrial Coatings Keeps Polymer Emulsion Volumes Climbing
2.3.1.2. Polymer-Modified Construction Chemicals Lift Latex Binder Consumption per Building
2.3.2. Restraints
2.3.2.1. Monomer Price Swings Pass Straight Through Thin Polymer Emulsion Margins
2.3.2.2. Isothiazolinone Preservative Rules Force Costly Reformulation of Water-Based Dispersions
2.3.3. Market Opportunities
2.3.3.1. Low-Carbon and Bio-Based Dispersions Open a Premium Grade Pool in Specified Construction
2.3.3.2. Preservative-Reduced and High-Solids Platforms Create a Reformulation Revenue Pool
3. Global Polymer Emulsion Market Outlook, 2020–2033
3.1. Global Polymer Emulsion Market Outlook, by Product Type, Value (US$ Billion), 2020–2033
3.1.1. Pure Acrylic
3.1.2. Styrene-Acrylic
3.1.3. Vinyl Acetate Homopolymer
3.1.4. Vinyl Acetate-Ethylene and Other Vinyl Copolymers
3.1.5. Styrene-Butadiene Latex
3.1.6. Polyurethane Dispersions
3.1.7. Nitrile and Other Specialty Latexes
3.1.8. Bio-based and Partially Bio-based Grades
3.2. Global Polymer Emulsion Market Outlook, by Application, Value (US$ Billion), 2020–2033
3.2.1. Paints and Coatings
3.2.2. Adhesives and Sealants
3.2.3. Paper and Paperboard Coating and Board Sizing
3.2.4. Carpet Backing
3.2.5. Nonwovens and Textile Binders
3.2.6. Construction Chemicals
3.2.7. Gloves and Dipped Goods
3.3. Global Polymer Emulsion Market Outlook, by End-use Industry, Value (US$ Billion), 2020–2033
3.3.1. Building and Construction
3.3.2. Paper, Packaging and Printing
3.3.3. Textiles, Carpets and Nonwovens
3.3.4. Healthcare and Personal Protection
3.3.5. Automotive and Transportation
3.3.6. Furniture and Woodworking
3.4. Global Polymer Emulsion Market Outlook, by Solids Content, Value (US$ Billion), 2020–2033
3.4.1. Low Solids (Below 40%)
3.4.2. Medium Solids (40–55%)
3.4.3. High Solids (Above 55%)
3.5. Global Polymer Emulsion Market Outlook, by Region, Value (US$ Billion), 2020–2033
3.5.1. North America
3.5.2. Europe
3.5.3. Asia Pacific
3.5.4. Latin America
3.5.5. Middle East & Africa
4. North America Polymer Emulsion Market Outlook, 2020–2033
4.1. North America Polymer Emulsion Market Outlook, by Product Type, Value (US$ Billion), 2020–2033
4.1.1. Pure Acrylic
4.1.2. Styrene-Acrylic
4.1.3. Vinyl Acetate Homopolymer
4.1.4. Vinyl Acetate-Ethylene and Other Vinyl Copolymers
4.1.5. Styrene-Butadiene Latex
4.1.6. Polyurethane Dispersions
4.1.7. Nitrile and Other Specialty Latexes
4.1.8. Bio-based and Partially Bio-based Grades
4.2. North America Polymer Emulsion Market Outlook, by Application, Value (US$ Billion), 2020–2033
4.2.1. Paints and Coatings
4.2.2. Adhesives and Sealants
4.2.3. Paper and Paperboard Coating and Board Sizing
4.2.4. Carpet Backing
4.2.5. Nonwovens and Textile Binders
4.2.6. Construction Chemicals
4.2.7. Gloves and Dipped Goods
4.3. North America Polymer Emulsion Market Outlook, by End-use Industry, Value (US$ Billion), 2020–2033
4.3.1. Building and Construction
4.3.2. Paper, Packaging and Printing
4.3.3. Textiles, Carpets and Nonwovens
4.3.4. Healthcare and Personal Protection
4.3.5. Automotive and Transportation
4.3.6. Furniture and Woodworking
4.4. North America Polymer Emulsion Market Outlook, by Solids Content, Value (US$ Billion), 2020–2033
4.4.1. Low Solids (Below 40%)
4.4.2. Medium Solids (40–55%)
4.4.3. High Solids (Above 55%)
4.5. North America Polymer Emulsion Market Outlook, by Country, Value (US$ Billion), 2020–2033
4.5.1. United States Polymer Emulsion Market Outlook, by Product Type, 2020–2033
4.5.2. United States Polymer Emulsion Market Outlook, by Application, 2020–2033
4.5.3. United States Polymer Emulsion Market Outlook, by End-use Industry, 2020–2033
4.5.4. United States Polymer Emulsion Market Outlook, by Solids Content, 2020–2033
4.5.5. Canada Polymer Emulsion Market Outlook, by Product Type, 2020–2033
4.5.6. Canada Polymer Emulsion Market Outlook, by Application, 2020–2033
4.5.7. Canada Polymer Emulsion Market Outlook, by End-use Industry, 2020–2033
4.5.8. Canada Polymer Emulsion Market Outlook, by Solids Content, 2020–2033
4.5.9. Mexico Polymer Emulsion Market Outlook, by Product Type, 2020–2033
4.5.10. Mexico Polymer Emulsion Market Outlook, by Application, 2020–2033
4.5.11. Mexico Polymer Emulsion Market Outlook, by End-use Industry, 2020–2033
4.5.12. Mexico Polymer Emulsion Market Outlook, by Solids Content, 2020–2033
5. Europe Polymer Emulsion Market Outlook, 2020–2033
5.1. Europe Polymer Emulsion Market Outlook, by Product Type, Value (US$ Billion), 2020–2033
5.1.1. Pure Acrylic
5.1.2. Styrene-Acrylic
5.1.3. Vinyl Acetate Homopolymer
5.1.4. Vinyl Acetate-Ethylene and Other Vinyl Copolymers
5.1.5. Styrene-Butadiene Latex
5.1.6. Polyurethane Dispersions
5.1.7. Nitrile and Other Specialty Latexes
5.1.8. Bio-based and Partially Bio-based Grades
5.2. Europe Polymer Emulsion Market Outlook, by Application, Value (US$ Billion), 2020–2033
5.2.1. Paints and Coatings
5.2.2. Adhesives and Sealants
5.2.3. Paper and Paperboard Coating and Board Sizing
5.2.4. Carpet Backing
5.2.5. Nonwovens and Textile Binders
5.2.6. Construction Chemicals
5.2.7. Gloves and Dipped Goods
5.3. Europe Polymer Emulsion Market Outlook, by End-use Industry, Value (US$ Billion), 2020–2033
5.3.1. Building and Construction
5.3.2. Paper, Packaging and Printing
5.3.3. Textiles, Carpets and Nonwovens
5.3.4. Healthcare and Personal Protection
5.3.5. Automotive and Transportation
5.3.6. Furniture and Woodworking
5.4. Europe Polymer Emulsion Market Outlook, by Solids Content, Value (US$ Billion), 2020–2033
5.4.1. Low Solids (Below 40%)
5.4.2. Medium Solids (40–55%)
5.4.3. High Solids (Above 55%)
5.5. Europe Polymer Emulsion Market Outlook, by Country, Value (US$ Billion), 2020–2033
5.5.1. Germany Polymer Emulsion Market Outlook, by Product Type, 2020–2033
5.5.2. Germany Polymer Emulsion Market Outlook, by Application, 2020–2033
5.5.3. Germany Polymer Emulsion Market Outlook, by End-use Industry, 2020–2033
5.5.4. Germany Polymer Emulsion Market Outlook, by Solids Content, 2020–2033
5.5.5. France Polymer Emulsion Market Outlook, by Product Type, 2020–2033
5.5.6. France Polymer Emulsion Market Outlook, by Application, 2020–2033
5.5.7. France Polymer Emulsion Market Outlook, by End-use Industry, 2020–2033
5.5.8. France Polymer Emulsion Market Outlook, by Solids Content, 2020–2033
5.5.9. Italy Polymer Emulsion Market Outlook, by Product Type, 2020–2033
5.5.10. Italy Polymer Emulsion Market Outlook, by Application, 2020–2033
5.5.11. Italy Polymer Emulsion Market Outlook, by End-use Industry, 2020–2033
5.5.12. Italy Polymer Emulsion Market Outlook, by Solids Content, 2020–2033
5.5.13. Spain Polymer Emulsion Market Outlook, by Product Type, 2020–2033
5.5.14. Spain Polymer Emulsion Market Outlook, by Application, 2020–2033
5.5.15. Spain Polymer Emulsion Market Outlook, by End-use Industry, 2020–2033
5.5.16. Spain Polymer Emulsion Market Outlook, by Solids Content, 2020–2033
5.5.17. Netherlands Polymer Emulsion Market Outlook, by Product Type, 2020–2033
5.5.18. Netherlands Polymer Emulsion Market Outlook, by Application, 2020–2033
5.5.19. Netherlands Polymer Emulsion Market Outlook, by End-use Industry, 2020–2033
5.5.20. Netherlands Polymer Emulsion Market Outlook, by Solids Content, 2020–2033
5.5.21. Poland Polymer Emulsion Market Outlook, by Product Type, 2020–2033
5.5.22. Poland Polymer Emulsion Market Outlook, by Application, 2020–2033
5.5.23. Poland Polymer Emulsion Market Outlook, by End-use Industry, 2020–2033
5.5.24. Poland Polymer Emulsion Market Outlook, by Solids Content, 2020–2033
6. Asia Pacific Polymer Emulsion Market Outlook, 2020–2033
6.1. Asia Pacific Polymer Emulsion Market Outlook, by Product Type, Value (US$ Billion), 2020–2033
6.1.1. Pure Acrylic
6.1.2. Styrene-Acrylic
6.1.3. Vinyl Acetate Homopolymer
6.1.4. Vinyl Acetate-Ethylene and Other Vinyl Copolymers
6.1.5. Styrene-Butadiene Latex
6.1.6. Polyurethane Dispersions
6.1.7. Nitrile and Other Specialty Latexes
6.1.8. Bio-based and Partially Bio-based Grades
6.2. Asia Pacific Polymer Emulsion Market Outlook, by Application, Value (US$ Billion), 2020–2033
6.2.1. Paints and Coatings
6.2.2. Adhesives and Sealants
6.2.3. Paper and Paperboard Coating and Board Sizing
6.2.4. Carpet Backing
6.2.5. Nonwovens and Textile Binders
6.2.6. Construction Chemicals
6.2.7. Gloves and Dipped Goods
6.3. Asia Pacific Polymer Emulsion Market Outlook, by End-use Industry, Value (US$ Billion), 2020–2033
6.3.1. Building and Construction
6.3.2. Paper, Packaging and Printing
6.3.3. Textiles, Carpets and Nonwovens
6.3.4. Healthcare and Personal Protection
6.3.5. Automotive and Transportation
6.3.6. Furniture and Woodworking
6.4. Asia Pacific Polymer Emulsion Market Outlook, by Solids Content, Value (US$ Billion), 2020–2033
6.4.1. Low Solids (Below 40%)
6.4.2. Medium Solids (40–55%)
6.4.3. High Solids (Above 55%)
6.5. Asia Pacific Polymer Emulsion Market Outlook, by Country, Value (US$ Billion), 2020–2033
6.5.1. China Polymer Emulsion Market Outlook, by Product Type, 2020–2033
6.5.2. China Polymer Emulsion Market Outlook, by Application, 2020–2033
6.5.3. China Polymer Emulsion Market Outlook, by End-use Industry, 2020–2033
6.5.4. China Polymer Emulsion Market Outlook, by Solids Content, 2020–2033
6.5.5. India Polymer Emulsion Market Outlook, by Product Type, 2020–2033
6.5.6. India Polymer Emulsion Market Outlook, by Application, 2020–2033
6.5.7. India Polymer Emulsion Market Outlook, by End-use Industry, 2020–2033
6.5.8. India Polymer Emulsion Market Outlook, by Solids Content, 2020–2033
6.5.9. Japan Polymer Emulsion Market Outlook, by Product Type, 2020–2033
6.5.10. Japan Polymer Emulsion Market Outlook, by Application, 2020–2033
6.5.11. Japan Polymer Emulsion Market Outlook, by End-use Industry, 2020–2033
6.5.12. Japan Polymer Emulsion Market Outlook, by Solids Content, 2020–2033
6.5.13. Korea Polymer Emulsion Market Outlook, by Product Type, 2020–2033
6.5.14. Korea Polymer Emulsion Market Outlook, by Application, 2020–2033
6.5.15. Korea Polymer Emulsion Market Outlook, by End-use Industry, 2020–2033
6.5.16. Korea Polymer Emulsion Market Outlook, by Solids Content, 2020–2033
6.5.17. Indonesia Polymer Emulsion Market Outlook, by Product Type, 2020–2033
6.5.18. Indonesia Polymer Emulsion Market Outlook, by Application, 2020–2033
6.5.19. Indonesia Polymer Emulsion Market Outlook, by End-use Industry, 2020–2033
6.5.20. Indonesia Polymer Emulsion Market Outlook, by Solids Content, 2020–2033
6.5.21. Vietnam Polymer Emulsion Market Outlook, by Product Type, 2020–2033
6.5.22. Vietnam Polymer Emulsion Market Outlook, by Application, 2020–2033
6.5.23. Vietnam Polymer Emulsion Market Outlook, by End-use Industry, 2020–2033
6.5.24. Vietnam Polymer Emulsion Market Outlook, by Solids Content, 2020–2033
6.5.25. Thailand Polymer Emulsion Market Outlook, by Product Type, 2020–2033
6.5.26. Thailand Polymer Emulsion Market Outlook, by Application, 2020–2033
6.5.27. Thailand Polymer Emulsion Market Outlook, by End-use Industry, 2020–2033
6.5.28. Thailand Polymer Emulsion Market Outlook, by Solids Content, 2020–2033
7. Latin America Polymer Emulsion Market Outlook, 2020–2033
7.1. Latin America Polymer Emulsion Market Outlook, by Product Type, Value (US$ Billion), 2020–2033
7.1.1. Pure Acrylic
7.1.2. Styrene-Acrylic
7.1.3. Vinyl Acetate Homopolymer
7.1.4. Vinyl Acetate-Ethylene and Other Vinyl Copolymers
7.1.5. Styrene-Butadiene Latex
7.1.6. Polyurethane Dispersions
7.1.7. Nitrile and Other Specialty Latexes
7.1.8. Bio-based and Partially Bio-based Grades
7.2. Latin America Polymer Emulsion Market Outlook, by Application, Value (US$ Billion), 2020–2033
7.2.1. Paints and Coatings
7.2.2. Adhesives and Sealants
7.2.3. Paper and Paperboard Coating and Board Sizing
7.2.4. Carpet Backing
7.2.5. Nonwovens and Textile Binders
7.2.6. Construction Chemicals
7.2.7. Gloves and Dipped Goods
7.3. Latin America Polymer Emulsion Market Outlook, by End-use Industry, Value (US$ Billion), 2020–2033
7.3.1. Building and Construction
7.3.2. Paper, Packaging and Printing
7.3.3. Textiles, Carpets and Nonwovens
7.3.4. Healthcare and Personal Protection
7.3.5. Automotive and Transportation
7.3.6. Furniture and Woodworking
7.4. Latin America Polymer Emulsion Market Outlook, by Solids Content, Value (US$ Billion), 2020–2033
7.4.1. Low Solids (Below 40%)
7.4.2. Medium Solids (40–55%)
7.4.3. High Solids (Above 55%)
7.5. Latin America Polymer Emulsion Market Outlook, by Country, Value (US$ Billion), 2020–2033
7.5.1. Brazil Polymer Emulsion Market Outlook, by Product Type, 2020–2033
7.5.2. Brazil Polymer Emulsion Market Outlook, by Application, 2020–2033
7.5.3. Brazil Polymer Emulsion Market Outlook, by End-use Industry, 2020–2033
7.5.4. Brazil Polymer Emulsion Market Outlook, by Solids Content, 2020–2033
7.5.5. Mexico Polymer Emulsion Market Outlook, by Product Type, 2020–2033
7.5.6. Mexico Polymer Emulsion Market Outlook, by Application, 2020–2033
7.5.7. Mexico Polymer Emulsion Market Outlook, by End-use Industry, 2020–2033
7.5.8. Mexico Polymer Emulsion Market Outlook, by Solids Content, 2020–2033
7.5.9. Colombia Polymer Emulsion Market Outlook, by Product Type, 2020–2033
7.5.10. Colombia Polymer Emulsion Market Outlook, by Application, 2020–2033
7.5.11. Colombia Polymer Emulsion Market Outlook, by End-use Industry, 2020–2033
7.5.12. Colombia Polymer Emulsion Market Outlook, by Solids Content, 2020–2033
7.5.13. Chile Polymer Emulsion Market Outlook, by Product Type, 2020–2033
7.5.14. Chile Polymer Emulsion Market Outlook, by Application, 2020–2033
7.5.15. Chile Polymer Emulsion Market Outlook, by End-use Industry, 2020–2033
7.5.16. Chile Polymer Emulsion Market Outlook, by Solids Content, 2020–2033
7.5.17. Argentina Polymer Emulsion Market Outlook, by Product Type, 2020–2033
7.5.18. Argentina Polymer Emulsion Market Outlook, by Application, 2020–2033
7.5.19. Argentina Polymer Emulsion Market Outlook, by End-use Industry, 2020–2033
7.5.20. Argentina Polymer Emulsion Market Outlook, by Solids Content, 2020–2033
8. Middle East & Africa Polymer Emulsion Market Outlook, 2020–2033
8.1. Middle East & Africa Polymer Emulsion Market Outlook, by Product Type, Value (US$ Billion), 2020–2033
8.1.1. Pure Acrylic
8.1.2. Styrene-Acrylic
8.1.3. Vinyl Acetate Homopolymer
8.1.4. Vinyl Acetate-Ethylene and Other Vinyl Copolymers
8.1.5. Styrene-Butadiene Latex
8.1.6. Polyurethane Dispersions
8.1.7. Nitrile and Other Specialty Latexes
8.1.8. Bio-based and Partially Bio-based Grades
8.2. Middle East & Africa Polymer Emulsion Market Outlook, by Application, Value (US$ Billion), 2020–2033
8.2.1. Paints and Coatings
8.2.2. Adhesives and Sealants
8.2.3. Paper and Paperboard Coating and Board Sizing
8.2.4. Carpet Backing
8.2.5. Nonwovens and Textile Binders
8.2.6. Construction Chemicals
8.2.7. Gloves and Dipped Goods
8.3. Middle East & Africa Polymer Emulsion Market Outlook, by End-use Industry, Value (US$ Billion), 2020–2033
8.3.1. Building and Construction
8.3.2. Paper, Packaging and Printing
8.3.3. Textiles, Carpets and Nonwovens
8.3.4. Healthcare and Personal Protection
8.3.5. Automotive and Transportation
8.3.6. Furniture and Woodworking
8.4. Middle East & Africa Polymer Emulsion Market Outlook, by Solids Content, Value (US$ Billion), 2020–2033
8.4.1. Low Solids (Below 40%)
8.4.2. Medium Solids (40–55%)
8.4.3. High Solids (Above 55%)
8.5. Middle East & Africa Polymer Emulsion Market Outlook, by Country, Value (US$ Billion), 2020–2033
8.5.1. Saudi Arabia Polymer Emulsion Market Outlook, by Product Type, 2020–2033
8.5.2. Saudi Arabia Polymer Emulsion Market Outlook, by Application, 2020–2033
8.5.3. Saudi Arabia Polymer Emulsion Market Outlook, by End-use Industry, 2020–2033
8.5.4. Saudi Arabia Polymer Emulsion Market Outlook, by Solids Content, 2020–2033
8.5.5. United Arab Emirates Polymer Emulsion Market Outlook, by Product Type, 2020–2033
8.5.6. United Arab Emirates Polymer Emulsion Market Outlook, by Application, 2020–2033
8.5.7. United Arab Emirates Polymer Emulsion Market Outlook, by End-use Industry, 2020–2033
8.5.8. United Arab Emirates Polymer Emulsion Market Outlook, by Solids Content, 2020–2033
8.5.9. Egypt Polymer Emulsion Market Outlook, by Product Type, 2020–2033
8.5.10. Egypt Polymer Emulsion Market Outlook, by Application, 2020–2033
8.5.11. Egypt Polymer Emulsion Market Outlook, by End-use Industry, 2020–2033
8.5.12. Egypt Polymer Emulsion Market Outlook, by Solids Content, 2020–2033
8.5.13. Nigeria Polymer Emulsion Market Outlook, by Product Type, 2020–2033
8.5.14. Nigeria Polymer Emulsion Market Outlook, by Application, 2020–2033
8.5.15. Nigeria Polymer Emulsion Market Outlook, by End-use Industry, 2020–2033
8.5.16. Nigeria Polymer Emulsion Market Outlook, by Solids Content, 2020–2033
8.5.17. Morocco Polymer Emulsion Market Outlook, by Product Type, 2020–2033
8.5.18. Morocco Polymer Emulsion Market Outlook, by Application, 2020–2033
8.5.19. Morocco Polymer Emulsion Market Outlook, by End-use Industry, 2020–2033
8.5.20. Morocco Polymer Emulsion Market Outlook, by Solids Content, 2020–2033
8.5.21. South Africa Polymer Emulsion Market Outlook, by Product Type, 2020–2033
8.5.22. South Africa Polymer Emulsion Market Outlook, by Application, 2020–2033
8.5.23. South Africa Polymer Emulsion Market Outlook, by End-use Industry, 2020–2033
8.5.24. South Africa Polymer Emulsion Market Outlook, by Solids Content, 2020–2033
9. Competitive Landscape
9.1. Market Concentration and Industry Leaders
9.2. Competitive Differentiation
9.3. Strategic Moves and Market Direction
9.4. Recent Industry Developments
9.5. Company Profiles
9.5.1. BASF SE
9.5.2. Dow Inc.
9.5.3. Arkema S.A.
9.5.4. Wacker Chemie AG
9.5.5. Celanese Corporation
9.5.6. Synthomer plc
9.5.7. Trinseo PLC
9.5.8. Nippon Shokubai Co., Ltd.
9.5.9. DIC Corporation
9.5.10. Covestro AG
9.5.11. The Lubrizol Corporation
9.5.12. Zeon Corporation
9.5.13. Vinavil S.p.A.
9.5.14. Organik Kimya
10. Appendix
10.1. Research Methodology
10.2. Report Assumptions
10.3. Acronyms and Abbreviations
| Product Type | Pure Acrylic, Styrene-Acrylic, Vinyl Acetate Homopolymer, Vinyl Acetate-Ethylene and Other Vinyl Copolymers, Styrene-Butadiene Latex, Polyurethane Dispersions, Nitrile and Other Specialty Latexes, Bio-based and Partially Bio-based Grades |
| Application | Paints and Coatings, Adhesives and Sealants, Paper and Paperboard Coating and Board Sizing, Carpet Backing, Nonwovens and Textile Binders, Construction Chemicals, Gloves and Dipped Goods |
| End-use Industry | Building and Construction, Paper, Packaging and Printing, Textiles, Carpets and Nonwovens, Healthcare and Personal Protection, Automotive and Transportation, Furniture and Woodworking |
| Solids Content | Low Solids (Below 40%), Medium Solids (40–55%), High Solids (Above 55%) |
| Regions | North America, Europe, Asia Pacific, Latin America, Middle East & Africa |
Our Research Methodology
Considering the volatility of business today, traditional approaches to strategizing a game plan can be unfruitful if not detrimental. True ambiguity is no way to determine a forecast. A myriad of predetermined factors must be accounted for such as the degree of risk involved, the magnitude of circumstances, as well as conditions or consequences that are not known or unpredictable. To circumvent binary views that cast uncertainty, the application of market research intelligence to strategically posture, move, and enable actionable outcomes is necessary.
View Methodology
Quality Assured
Rigorous Validation Process

Confidentiality Assured
End-to-end Data Security

Custom Research Services
Tailored To Your Objectives
FAQs
The global polymer emulsion market is valued at US$ 44.8 billion in 2026, measured on a wet dispersion basis across all end-use applications and all five standard regions.
The market is projected to reach US$ 66.5 billion by 2033, growing at a 5.8% CAGR and adding an absolute opportunity of US$ 21.7 billion.
Pure acrylic dispersions lead with 23.8% share in 2026, because acrylic chemistry provides the ultraviolet stability and alkali resistance exterior architectural coatings require.
Bio-based and partially bio-based grades grow fastest at 11.6%, and Middle East & Africa is the fastest region at a 7.8% CAGR through 2033.
Asia Pacific holds the largest share at 44.0% in 2026, supported by its construction pipeline, paper converting base and concentration of glove dipping capacity.
Related Reports
On The Go Packaging Market Size, Share, Insights, Competitive Landscape, and Forecast 2026 to 2033
On the go packaging market to grow from US$2.19 Bn in 2026 to US$3.00 Bn by 2033 at 4.6% CAGR. Explore materials, products, applications and regions.
Nylon 6 Market Size, Share, Insights, Competitive Landscape, and Forecast 2026 to 2033
Nylon 6 market to reach US$ 26.95 billion by 2033 at a 5.6% CAGR. Explore product forms, applications, feedstocks, leading companies and regional trends.
Vitamin A-Acetate Market Size, Share, Insights, Competitive Landscape, and Forecast 2026 to 2033
Vitamin A-acetate market to reach US$ 2.68 billion by 2033 at a 5.9% CAGR. Explore forms, grades, applications, leading companies and regional trends.
Spinosad Active Ingredient Market Size, Share, Insights, Competitive Landscape, and Forecast 2026 to 2033
Spinosad active ingredient market to reach US$ 1.257 billion by 2033 at an 8.6% CAGR. Explore forms, crops, applications, companies and regional trends.
D-Psicose (Allulose) Market Size, Share, Insights, Competitive Landscape, and Forecast 2026 to 2033
D-psicose (allulose) market to reach US$ 0.749 billion by 2033 at a 15.7% CAGR. Explore forms, applications, sales channels and regional trends.
Butter Packaging Market Size, Share, Insights, Competitive Landscape, and Forecast 2026 to 2033
Butter packaging market to reach US$ 4.83 billion by 2033 at a 6.4% CAGR. Explore materials, packaging types, end uses and regional trends.