



Spinosad Active Ingredient Market
Spinosad Active Ingredient Market Size, Share, Insights, Competitive Landscape, and Forecast 2026 to 2033
Spinosad Active Ingredient Market Analysis, 2026–2033
Spinosad Active Ingredient Market
Spinosad Active Ingredient Market Size, Share, Insights, Competitive Landscape, and Forecast 2026 to 2033
Spinosad Active Ingredient Market Size and Trend Analysis
How Fast Is the Spinosad Active Ingredient Market Growing?
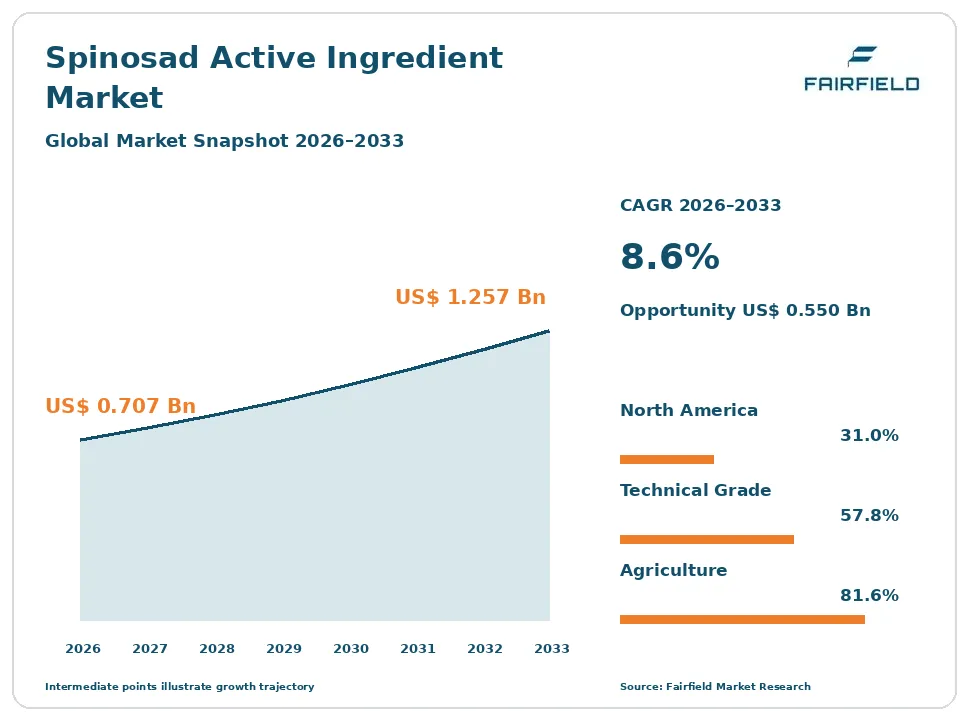
The global spinosad active ingredient market size is expected to be valued at US$ 0.707 billion in 2026 and projected to reach US$ 1.257 billion by 2033, growing at a CAGR of 8.6% between 2026 and 2033.
Between 2020 and 2025, the market grew at a CAGR of about 7.4%, as growers replaced older broad-spectrum insecticides and organic acreage expanded. Three factors now drive growth: bans and restrictions on organophosphates and neonicotinoids, rising demand for organic farming inputs, and the role of spinosad in integrated pest management and resistance programs. The market is shifting from a single originator supply base toward wider generic production after patent expiry, with fermentation capacity expanding in China and India. Spinosad is valued as a biopesticide-like natural product, while its semi-synthetic cousin spinetoram extends the spinosyn class into longer-lasting field crop uses. New formulations are opening public health and animal health uses.
Key Report Takeaways
- By Form: Technical Grade held 57.8% share in 2026, while Suspension Concentrate is projected to expand at a 9.7% CAGR through 2033, driven by ready-to-use formulations for growers and generic formulators.
- By Crop Type: Fruits & Nuts held 34.5% share in 2026, while Vegetables & Protected Crops are projected to expand at a 9.4% CAGR through 2033, driven by low residue needs and greenhouse pest control.
- By Application: Agriculture held 81.6% share in 2026, while Public Health is projected to expand at a 10.1% CAGR through 2033, driven by mosquito larvicides and rising vector-borne disease control.
- By Region: North America held 31.0% share in 2026, while Asia Pacific is projected to expand at a 10.2% CAGR through 2033, driven by generic production and adoption in China and India.
Global Spinosad Active Ingredient Market Trends and Insights
Drivers Impact Analysis
Two drivers carry the strongest influence on spinosad active ingredient demand during the forecast period.
| Driver | Impact on CAGR Forecast | Geographic Relevance | Impact Timeline |
| Restrictions on older synthetic insecticides | High | Europe, North America, Asia Pacific | Long term (≥4 years) |
| Growth of organic farming and low-residue produce | High | North America, Europe | Medium term (2-4 years) |
Restrictions on Synthetic Insecticides Are Driving the Spinosad Active Ingredient Market
Restrictions on older synthetic insecticides are the strongest driver of the spinosad active ingredient market. Regulators are removing many organophosphates, carbamates, and neonicotinoids from use.
The mechanism is regulatory pressure that leaves growers with fewer effective tools. The European Union has banned outdoor use of key neonicotinoids and withdrawn chlorpyrifos. The United States Environmental Protection Agency revoked chlorpyrifos food tolerances, and India and Brazil have restricted several older chemicals. Spinosad controls caterpillars, thrips, leafminers, and fruit flies with low toxicity to mammals and many beneficial insects. As a Group 5 insecticide, it shows no cross-resistance to other major classes, making it valuable in integrated pest management rotations. Food companies and retailers also set lower residue limits than regulators. Growers also view spinosad as a biopesticide-style option that fits sustainability programs. These forces push growers toward spinosad-based products.
Organic Farming Growth Is Expanding the Spinosad Active Ingredient Market
The growth of organic farming and low-residue produce is expanding the spinosad active ingredient market. Spinosad is one of the few effective insecticides approved for organic use.
The cause is rising consumer demand for organic and residue-free food. Global organic farmland exceeds 96 million hectares, and organic food sales keep rising in the United States, Germany, France, and China. Spinosad is made by fermentation of the soil bacterium Saccharopolyspora spinosa, which allows certified organic formulations. Organic growers of apples, berries, grapes, vegetables, and leafy greens rely on it for caterpillars and thrips. The European Union Farm to Fork goals aim for 25% organic farmland. Export growers in Chile, Peru, Mexico, and India need low-residue programs to meet buyer standards. These trends support strong demand for organic-listed spinosad products.
Restraints Impact Analysis
Two restraints limit how quickly the spinosad active ingredient market grows.
| Restraint | Impact on CAGR Forecast | Geographic Relevance | Impact Timeline |
| Pollinator and aquatic toxicity concerns | Medium | Europe, North America | Medium term (2-4 years) |
| Price pressure and competition from alternatives | High | Global | Short term (≤2 years) |
Pollinator Concerns Slow the Spinosad Active Ingredient Market
Pollinator and aquatic toxicity concerns slow the spinosad active ingredient market. Although spinosad is natural, it can still harm some non-target species.
The specific causes are toxicity findings and regulatory reviews. Spinosad is highly toxic to bees when wet spray contacts them, so labels restrict application during bloom or when bees are foraging. It is also toxic to some aquatic invertebrates. The United States Environmental Protection Agency registration review led to an interim decision with label mitigation measures, and companies such as Clarke updated labels in 2025. Some regulators require buffer zones and timing limits. Resistance has appeared in some pests, such as diamondback moth and western flower thrips, after heavy use. Several European Union member states also require extra risk assessments for products near water. These factors limit application windows and require careful stewardship.
Price Competition Restricts the Spinosad Active Ingredient Market
Price pressure and competition from alternatives restrict the spinosad active ingredient market. Spinosad costs more per hectare than many generic synthetic insecticides.
The underlying causes are production costs and crowded insect control markets. Fermentation requires large tanks, careful strain management, and purification, which keep technical costs higher than simple chemical synthesis. Generic producers in China and India have cut prices after patent expiry, squeezing margins for formulators. Diamides such as chlorantraniliprole, and newer chemistries, compete for caterpillar control in field crops. Spinetoram competes within the same class for longer residual control in field crops. Biological options such as Bacillus thuringiensis and baculoviruses compete in organic programs. Smallholders in price-sensitive markets often choose cheaper products, and counterfeit pesticides undercut legitimate sales. These factors slow value growth even as volumes rise.
Market Opportunities
Public Health and Animal Health Open a Diversified Revenue Pool
Public health and animal health uses open a diversified revenue pool in the spinosad active ingredient market. Spinosad works well against mosquito larvae, fleas, and lice.
Formulators that develop non-crop products can capture this opportunity. Mosquito control agencies use spinosad larvicides such as Clarke Natular in water bodies to fight dengue, Zika, and West Nile virus. Parkers Pharma launched a 180-day extended-release spinosad larvicide tablet in 2025. Spinosad is used in pet flea treatments and head lice lotions. Climate change is spreading mosquito ranges into new areas of Europe, North America, and Asia Pacific, increasing larviciding budgets. These markets offer higher prices and less seasonal demand than crop protection uses. Partnerships with public health agencies build long-term supply contracts and steady revenue.
Asia Pacific Generic Production Creates a Volume Revenue Pool
Generic production and rising adoption in Asia Pacific create a volume revenue pool in the spinosad active ingredient market. Patent expiry has opened the market to many producers.
Producers with efficient fermentation can capture this opportunity. China has large fermentation capacity and exports spinosad technical to formulators worldwide. India registers growing numbers of spinosad and spinetoram formulations for cotton, chili, vegetables, and pulses. Rising vegetable and fruit exports from India, Vietnam, and Thailand require low-residue insect control. Government programs promote safer pesticides and integrated pest management for smallholders. Gadot Agro launched an organic-certified spinosad suspension concentrate in 2025. Lower prices broaden access to small farms, and local formulators in India, Indonesia, and Vietnam are expanding registrations. Farmer training on integrated pest management helps build demand for selective products.
Segment Analysis
By Form: Technical Grade Leads While Suspension Concentrate Grows Fastest
Technical Grade held 57.8% share in 2026. Technical spinosad is the concentrated active ingredient, usually around 90% purity, sold by fermentation producers to formulators who make branded products. Corteva Agriscience remains the largest technical producer, with generic producers in China and India supplying many regional formulators. Technical sales benefit from direct business-to-business contracts. Wettable powders, granules, and baits serve specific uses such as fruit fly control and stored grain protection.
Suspension Concentrate is the fastest-growing form, expanding at a 9.7% CAGR through 2033. Suspension concentrates are water-based liquid formulations that are easy to measure, mix, and spray, and many are certified for organic farming. Growers prefer them for foliar sprays on fruits and vegetables. Generic formulators are launching new concentrate products. For the market, concentrate growth raises value per unit sold.
By Crop Type: Fruits & Nuts Lead While Vegetables & Protected Crops Grow Fastest
Fruits & Nuts held 34.5% share in 2026. Apples, pears, citrus, stone fruits, grapes, berries, and tree nuts face caterpillars, leafrollers, thrips, and fruit flies that spinosad controls well. Short pre-harvest intervals let growers spray close to harvest while meeting low residue limits for export. Fruit fly bait sprays are common in citrus and olives. Integrated pest management programs value spinosad’s selectivity.
Vegetables & Protected Crops are the fastest-growing crop type, expanding at a 9.4% CAGR through 2033. Tomatoes, peppers, cucumbers, brassicas, and leafy greens suffer heavy damage from thrips, leafminers, and caterpillars. Greenhouse growers need products compatible with beneficial insects used for biological control. Vegetable acreage under protected cultivation is rising in China, India, Mexico, and Spain. For the market, vegetable growth expands treated area.
By Application: Agriculture Leads While Public Health Grows Fastest
Agriculture held 81.6% share in 2026. Crop protection is the core use of spinosad, covering fruits, vegetables, cotton, corn, soybeans, and stored grain. Products such as Entrust, Success, Tracer, and Conserve are sold worldwide, along with many generic brands. Organic farming accounts for a growing share of agricultural use. Animal health applications, including flea control and livestock pests, form another established segment.
Public Health is the fastest-growing application, expanding at a 10.1% CAGR through 2033. Mosquito control districts and city health departments use spinosad larvicides in standing water, catch basins, and containers. Spinosad works against larvae resistant to other larvicides and has low risk to people and fish at label rates. Rising dengue cases in Asia Pacific and Latin America support demand. For the market, public health growth reduces dependence on crop seasons.
Geography Analysis
Which Region Is Leading the Spinosad Active Ingredient Market?
North America is leading the spinosad active ingredient market with a 31.0% share in 2026. The United States is the largest country market, valued at about US$ 0.130 billion in 2024, with large organic fruit and vegetable production in California, Washington, and Florida. Corteva Agriscience manufactures spinosyns by fermentation at its plant in Midland, Michigan. Mosquito control districts in Florida, Texas, and California are major users of larvicides. Canada adds demand from fruit, potato, and berry growers. One change shaping the region is the label mitigation following the federal registration review.
Europe Advances the Spinosad Active Ingredient Market Through Organic Farming
Europe is a major spinosad active ingredient market supported by strict pesticide rules and fast-growing organic farming. Spain, Italy, France, and Greece use spinosad on fruits, vegetables, grapes, and olives, including fruit fly baits. Germany and the Netherlands use it in greenhouse vegetables and ornamentals. The European Union withdrawal of several synthetic insecticides has increased reliance on spinosad and other selective products. Bee protection rules limit spraying during flowering. Many growers treat spinosad as a biopesticide partner for biological control in glasshouses. One opportunity is integrated programs for greenhouse crops, where beneficial insects must survive treatment.
Which Region Is Growing Fastest in the Spinosad Active Ingredient Market?
Asia Pacific is growing fastest in the spinosad active ingredient market at a 10.2% CAGR through 2033. China has extensive fermentation infrastructure, a large generic production base, and strong exports, while also using spinosad on vegetables and fruits at home. India is registering many spinosad and spinetoram formulations for cotton, chili, brinjal, and pulses. Japan and South Korea use spinosad in high-value fruits and vegetables. Australia uses it on horticulture and stored grain. Vietnam and Thailand need low-residue products for exports. Local formulators are expanding distribution in rural markets. One opportunity is affordable generic formulations for smallholders.
Latin America Grows the Spinosad Active Ingredient Market Through Export Horticulture
Latin America is a growing spinosad active ingredient market. Brazil uses spinosad and spinetoram in soybeans, cotton, corn, fruits, and vegetables to manage resistant caterpillars and thrips. Mexico, Chile, and Peru export berries, avocados, grapes, and vegetables to markets with strict residue limits, which favors spinosad. Argentina uses it in fruit and vegetable production. Rising dengue cases in Brazil, Colombia, Argentina, and Mexico are increasing public health use, and organic coffee and banana growers add demand. Key barriers include price competition from generics and diamides, and long registration timelines. One opportunity is export-focused residue programs.
Middle East & Africa Builds the Spinosad Active Ingredient Market
Middle East & Africa is an emerging spinosad active ingredient market. Morocco, Egypt, and South Africa export fruits and vegetables to Europe and need low-residue insect control. Kenya uses spinosad on flowers and vegetables for export. Saudi Arabia and the United Arab Emirates use it in greenhouse vegetables and date palms. Mosquito control programs in malaria-affected countries such as Nigeria and Tanzania add public health demand. Israel and Egypt use it in citrus, grapes, and vegetables for export markets. Key barriers include limited registrations, weak distribution, and price sensitivity. One opportunity is low-residue horticulture export programs.
Competitive Landscape
The spinosad active ingredient market is highly concentrated. Corteva Agriscience, which discovered and commercialized spinosyns, remains the largest technical producer and brand owner through Entrust, Success, Tracer, and the Qalcova active brand. Generic producers in China and India supply technical grade to formulators, while distributors and formulators such as UPL, Nufarm, Gowan Company, Certis Biologicals, ADAMA, Gadot Agro, and Clarke sell finished products.
Companies compete on technical purity, fermentation cost, formulation quality, organic certification, registrations, and price. Registration data packages are expensive and take years, so registered products in key countries are valuable assets. Corteva protects its position through brand strength, technical support, and newer spinetoram products, while generic suppliers compete mainly on price. Public health suppliers compete on long-lasting larvicide formulations.
Strategic moves show how competition is changing. In November 2024, Health Canada proposed a higher spinosad residue limit for cranberries. In January 2025, Gadot Agro launched SPINOZZI, an organic-certified suspension concentrate. In May 2025, Parkers Pharma launched Spinomax XRT, an extended-release larvicide tablet. In September 2025, the United States Environmental Protection Agency accepted Clarke label amendments for Natular T30. These moves show competition shifting toward new formulations and stewardship.
Three themes shape vendor strategy. First, companies are developing new formulations such as long-lasting larvicides and organic concentrates. Second, they are expanding registrations in Asia Pacific and Latin America, where crop and public health demand is growing. Third, they are investing in pollinator stewardship and resistance management.
Spinosad Active Ingredient Market Industry Leaders
Corteva Agriscience UPL Nufarm Gowan Company Certis Biologicals
Recent Industry Developments
- September 2025: The United States Environmental Protection Agency accepted Clarke label amendments for its Natular T30 spinosad larvicide under registration review - confirms continued public health use with updated mitigation.
- May 2025: Parkers Pharma launched Spinomax XRT, a 180-day extended-release larvicide tablet with 6.25% spinosad - extends spinosad into long-lasting mosquito control.
- January 2025: Gadot Agro launched SPINOZZI, a spinosad suspension concentrate certified for organic farming - adds a generic organic option for growers.
- November 2024: Health Canada proposed raising the spinosad maximum residue limit for cranberries to 0.7 ppm - supports wider crop use in North America.
Companies Covered in the Report
- Corteva Agriscience
- UPL
- Nufarm
- Gowan Company
- Certis Biologicals
- ADAMA
- Gadot Agro
- Clarke
- FMC Corporation
- Syngenta Group
- Koppert
- Andermatt Group
Spinosad Active Ingredient Market Report Scope
This report covers spinosad active ingredient, including technical grade and formulated products such as suspension concentrates, wettable powders, granules, and baits, used in agriculture, public health, and animal health across fruits and nuts, vegetables and protected crops, field crops, and other crops. It excludes spinetoram and other spinosyn derivatives. The base year is 2025, and the forecast period runs from 2026 to 2033. All values are expressed in US$ Billion.
Form
- Technical Grade
- Suspension Concentrate
- Wettable Powder & Granules
- Baits
Crop Type
- Fruits & Nuts
- Vegetables & Protected Crops
- Field Crops
- Others
Application
- Agriculture
- Public Health
- Animal Health
Regions
- North America
- Europe
- Asia Pacific
- Latin America
- Middle East & Africa
Key Questions Answered in the Report
How big is the spinosad active ingredient market in 2026?
The spinosad active ingredient market is valued at US$ 0.707 billion in 2026, led by technical grade sales to crop protection formulators.
What is the spinosad active ingredient market forecast to 2033?
The market is projected to reach US$ 1.257 billion by 2033, growing at an 8.6% CAGR and adding US$ 0.550 billion.
Which application is growing fastest in the spinosad active ingredient market?
Public health is growing fastest at a 10.1% CAGR through 2033, driven by mosquito larvicides and rising vector-borne disease control.
Which region is growing fastest in the spinosad active ingredient market?
Asia Pacific is growing fastest at a 10.2% CAGR through 2033, driven by generic production and wider use in China and India.
Which region holds the largest spinosad active ingredient market share?
North America holds the largest share at 31.0% in 2026, supported by organic produce, mosquito control, and Corteva Agriscience production.
1. Executive Summary
1.1. Global Spinosad Active Ingredient Market Snapshot
1.2. Future Projections
1.3. Key Report Takeaways
1.4. Regional Snapshot
2. Market Overview
2.1. Market Definition and Report Scope
2.2. Historical Trends 2020–2025
2.3. Market Dynamics
2.3.1. Drivers
2.3.1.1. Restrictions on Synthetic Insecticides Are Driving the Spinosad Active Ingredient Market
2.3.1.2. Organic Farming Growth Is Expanding the Spinosad Active Ingredient Market
2.3.2. Restraints
2.3.2.1. Pollinator Concerns Slow the Spinosad Active Ingredient Market
2.3.2.2. Price Competition Restricts the Spinosad Active Ingredient Market
2.3.3. Market Opportunities
2.3.3.1. Public Health and Animal Health Open a Diversified Revenue Pool
2.3.3.2. Asia Pacific Generic Production Creates a Volume Revenue Pool
3. Global Spinosad Active Ingredient Market Outlook, 2020-2033
3.1. Global Spinosad Active Ingredient Market Outlook, by Form, Value (US$ Billion), 2020-2033
3.1.1. Technical Grade
3.1.2. Suspension Concentrate
3.1.3. Wettable Powder & Granules
3.1.4. Baits
3.2. Global Spinosad Active Ingredient Market Outlook, by Crop Type, Value (US$ Billion), 2020-2033
3.2.1. Fruits & Nuts
3.2.2. Vegetables & Protected Crops
3.2.3. Field Crops
3.2.4. Others
3.3. Global Spinosad Active Ingredient Market Outlook, by Application, Value (US$ Billion), 2020-2033
3.3.1. Agriculture
3.3.2. Public Health
3.3.3. Animal Health
3.4. Global Spinosad Active Ingredient Market Outlook, by Region, Value (US$ Billion), 2020-2033
3.4.1. North America
3.4.2. Europe
3.4.3. Asia Pacific
3.4.4. Latin America
3.4.5. Middle East & Africa
4. North America Spinosad Active Ingredient Market Outlook, 2020-2033
4.1. North America Spinosad Active Ingredient Market Outlook, by Form, Value (US$ Billion), 2020-2033
4.1.1. Technical Grade
4.1.2. Suspension Concentrate
4.1.3. Wettable Powder & Granules
4.1.4. Baits
4.2. North America Spinosad Active Ingredient Market Outlook, by Crop Type, Value (US$ Billion), 2020-2033
4.2.1. Fruits & Nuts
4.2.2. Vegetables & Protected Crops
4.2.3. Field Crops
4.2.4. Others
4.3. North America Spinosad Active Ingredient Market Outlook, by Application, Value (US$ Billion), 2020-2033
4.3.1. Agriculture
4.3.2. Public Health
4.3.3. Animal Health
4.4. North America Spinosad Active Ingredient Market Outlook, by Country, Value (US$ Billion), 2020-2033
4.4.1. United States Spinosad Active Ingredient Market Outlook, by Form, 2020-2033
4.4.2. United States Spinosad Active Ingredient Market Outlook, by Crop Type, 2020-2033
4.4.3. United States Spinosad Active Ingredient Market Outlook, by Application, 2020-2033
4.4.4. Canada Spinosad Active Ingredient Market Outlook, by Form, 2020-2033
4.4.5. Canada Spinosad Active Ingredient Market Outlook, by Crop Type, 2020-2033
4.4.6. Canada Spinosad Active Ingredient Market Outlook, by Application, 2020-2033
5. Europe Spinosad Active Ingredient Market Outlook, 2020-2033
5.1. Europe Spinosad Active Ingredient Market Outlook, by Form, Value (US$ Billion), 2020-2033
5.1.1. Technical Grade
5.1.2. Suspension Concentrate
5.1.3. Wettable Powder & Granules
5.1.4. Baits
5.2. Europe Spinosad Active Ingredient Market Outlook, by Crop Type, Value (US$ Billion), 2020-2033
5.2.1. Fruits & Nuts
5.2.2. Vegetables & Protected Crops
5.2.3. Field Crops
5.2.4. Others
5.3. Europe Spinosad Active Ingredient Market Outlook, by Application, Value (US$ Billion), 2020-2033
5.3.1. Agriculture
5.3.2. Public Health
5.3.3. Animal Health
5.4. Europe Spinosad Active Ingredient Market Outlook, by Country, Value (US$ Billion), 2020-2033
5.4.1. Spain Spinosad Active Ingredient Market Outlook, by Form, 2020-2033
5.4.2. Spain Spinosad Active Ingredient Market Outlook, by Crop Type, 2020-2033
5.4.3. Spain Spinosad Active Ingredient Market Outlook, by Application, 2020-2033
5.4.4. Italy Spinosad Active Ingredient Market Outlook, by Form, 2020-2033
5.4.5. Italy Spinosad Active Ingredient Market Outlook, by Crop Type, 2020-2033
5.4.6. Italy Spinosad Active Ingredient Market Outlook, by Application, 2020-2033
5.4.7. France Spinosad Active Ingredient Market Outlook, by Form, 2020-2033
5.4.8. France Spinosad Active Ingredient Market Outlook, by Crop Type, 2020-2033
5.4.9. France Spinosad Active Ingredient Market Outlook, by Application, 2020-2033
5.4.10. Greece Spinosad Active Ingredient Market Outlook, by Form, 2020-2033
5.4.11. Greece Spinosad Active Ingredient Market Outlook, by Crop Type, 2020-2033
5.4.12. Greece Spinosad Active Ingredient Market Outlook, by Application, 2020-2033
5.4.13. Germany Spinosad Active Ingredient Market Outlook, by Form, 2020-2033
5.4.14. Germany Spinosad Active Ingredient Market Outlook, by Crop Type, 2020-2033
5.4.15. Germany Spinosad Active Ingredient Market Outlook, by Application, 2020-2033
5.4.16. Netherlands Spinosad Active Ingredient Market Outlook, by Form, 2020-2033
5.4.17. Netherlands Spinosad Active Ingredient Market Outlook, by Crop Type, 2020-2033
5.4.18. Netherlands Spinosad Active Ingredient Market Outlook, by Application, 2020-2033
6. Asia Pacific Spinosad Active Ingredient Market Outlook, 2020-2033
6.1. Asia Pacific Spinosad Active Ingredient Market Outlook, by Form, Value (US$ Billion), 2020-2033
6.1.1. Technical Grade
6.1.2. Suspension Concentrate
6.1.3. Wettable Powder & Granules
6.1.4. Baits
6.2. Asia Pacific Spinosad Active Ingredient Market Outlook, by Crop Type, Value (US$ Billion), 2020-2033
6.2.1. Fruits & Nuts
6.2.2. Vegetables & Protected Crops
6.2.3. Field Crops
6.2.4. Others
6.3. Asia Pacific Spinosad Active Ingredient Market Outlook, by Application, Value (US$ Billion), 2020-2033
6.3.1. Agriculture
6.3.2. Public Health
6.3.3. Animal Health
6.4. Asia Pacific Spinosad Active Ingredient Market Outlook, by Country, Value (US$ Billion), 2020-2033
6.4.1. China Spinosad Active Ingredient Market Outlook, by Form, 2020-2033
6.4.2. China Spinosad Active Ingredient Market Outlook, by Crop Type, 2020-2033
6.4.3. China Spinosad Active Ingredient Market Outlook, by Application, 2020-2033
6.4.4. India Spinosad Active Ingredient Market Outlook, by Form, 2020-2033
6.4.5. India Spinosad Active Ingredient Market Outlook, by Crop Type, 2020-2033
6.4.6. India Spinosad Active Ingredient Market Outlook, by Application, 2020-2033
6.4.7. Japan Spinosad Active Ingredient Market Outlook, by Form, 2020-2033
6.4.8. Japan Spinosad Active Ingredient Market Outlook, by Crop Type, 2020-2033
6.4.9. Japan Spinosad Active Ingredient Market Outlook, by Application, 2020-2033
6.4.10. South Korea Spinosad Active Ingredient Market Outlook, by Form, 2020-2033
6.4.11. South Korea Spinosad Active Ingredient Market Outlook, by Crop Type, 2020-2033
6.4.12. South Korea Spinosad Active Ingredient Market Outlook, by Application, 2020-2033
6.4.13. Australia Spinosad Active Ingredient Market Outlook, by Form, 2020-2033
6.4.14. Australia Spinosad Active Ingredient Market Outlook, by Crop Type, 2020-2033
6.4.15. Australia Spinosad Active Ingredient Market Outlook, by Application, 2020-2033
6.4.16. Vietnam Spinosad Active Ingredient Market Outlook, by Form, 2020-2033
6.4.17. Vietnam Spinosad Active Ingredient Market Outlook, by Crop Type, 2020-2033
6.4.18. Vietnam Spinosad Active Ingredient Market Outlook, by Application, 2020-2033
6.4.19. Thailand Spinosad Active Ingredient Market Outlook, by Form, 2020-2033
6.4.20. Thailand Spinosad Active Ingredient Market Outlook, by Crop Type, 2020-2033
6.4.21. Thailand Spinosad Active Ingredient Market Outlook, by Application, 2020-2033
7. Latin America Spinosad Active Ingredient Market Outlook, 2020-2033
7.1. Latin America Spinosad Active Ingredient Market Outlook, by Form, Value (US$ Billion), 2020-2033
7.1.1. Technical Grade
7.1.2. Suspension Concentrate
7.1.3. Wettable Powder & Granules
7.1.4. Baits
7.2. Latin America Spinosad Active Ingredient Market Outlook, by Crop Type, Value (US$ Billion), 2020-2033
7.2.1. Fruits & Nuts
7.2.2. Vegetables & Protected Crops
7.2.3. Field Crops
7.2.4. Others
7.3. Latin America Spinosad Active Ingredient Market Outlook, by Application, Value (US$ Billion), 2020-2033
7.3.1. Agriculture
7.3.2. Public Health
7.3.3. Animal Health
7.4. Latin America Spinosad Active Ingredient Market Outlook, by Country, Value (US$ Billion), 2020-2033
7.4.1. Brazil Spinosad Active Ingredient Market Outlook, by Form, 2020-2033
7.4.2. Brazil Spinosad Active Ingredient Market Outlook, by Crop Type, 2020-2033
7.4.3. Brazil Spinosad Active Ingredient Market Outlook, by Application, 2020-2033
7.4.4. Mexico Spinosad Active Ingredient Market Outlook, by Form, 2020-2033
7.4.5. Mexico Spinosad Active Ingredient Market Outlook, by Crop Type, 2020-2033
7.4.6. Mexico Spinosad Active Ingredient Market Outlook, by Application, 2020-2033
7.4.7. Chile Spinosad Active Ingredient Market Outlook, by Form, 2020-2033
7.4.8. Chile Spinosad Active Ingredient Market Outlook, by Crop Type, 2020-2033
7.4.9. Chile Spinosad Active Ingredient Market Outlook, by Application, 2020-2033
7.4.10. Peru Spinosad Active Ingredient Market Outlook, by Form, 2020-2033
7.4.11. Peru Spinosad Active Ingredient Market Outlook, by Crop Type, 2020-2033
7.4.12. Peru Spinosad Active Ingredient Market Outlook, by Application, 2020-2033
7.4.13. Argentina Spinosad Active Ingredient Market Outlook, by Form, 2020-2033
7.4.14. Argentina Spinosad Active Ingredient Market Outlook, by Crop Type, 2020-2033
7.4.15. Argentina Spinosad Active Ingredient Market Outlook, by Application, 2020-2033
7.4.16. Colombia Spinosad Active Ingredient Market Outlook, by Form, 2020-2033
7.4.17. Colombia Spinosad Active Ingredient Market Outlook, by Crop Type, 2020-2033
7.4.18. Colombia Spinosad Active Ingredient Market Outlook, by Application, 2020-2033
8. Middle East & Africa Spinosad Active Ingredient Market Outlook, 2020-2033
8.1. Middle East & Africa Spinosad Active Ingredient Market Outlook, by Form, Value (US$ Billion), 2020-2033
8.1.1. Technical Grade
8.1.2. Suspension Concentrate
8.1.3. Wettable Powder & Granules
8.1.4. Baits
8.2. Middle East & Africa Spinosad Active Ingredient Market Outlook, by Crop Type, Value (US$ Billion), 2020-2033
8.2.1. Fruits & Nuts
8.2.2. Vegetables & Protected Crops
8.2.3. Field Crops
8.2.4. Others
8.3. Middle East & Africa Spinosad Active Ingredient Market Outlook, by Application, Value (US$ Billion), 2020-2033
8.3.1. Agriculture
8.3.2. Public Health
8.3.3. Animal Health
8.4. Middle East & Africa Spinosad Active Ingredient Market Outlook, by Country, Value (US$ Billion), 2020-2033
8.4.1. Morocco Spinosad Active Ingredient Market Outlook, by Form, 2020-2033
8.4.2. Morocco Spinosad Active Ingredient Market Outlook, by Crop Type, 2020-2033
8.4.3. Morocco Spinosad Active Ingredient Market Outlook, by Application, 2020-2033
8.4.4. Egypt Spinosad Active Ingredient Market Outlook, by Form, 2020-2033
8.4.5. Egypt Spinosad Active Ingredient Market Outlook, by Crop Type, 2020-2033
8.4.6. Egypt Spinosad Active Ingredient Market Outlook, by Application, 2020-2033
8.4.7. South Africa Spinosad Active Ingredient Market Outlook, by Form, 2020-2033
8.4.8. South Africa Spinosad Active Ingredient Market Outlook, by Crop Type, 2020-2033
8.4.9. South Africa Spinosad Active Ingredient Market Outlook, by Application, 2020-2033
8.4.10. Kenya Spinosad Active Ingredient Market Outlook, by Form, 2020-2033
8.4.11. Kenya Spinosad Active Ingredient Market Outlook, by Crop Type, 2020-2033
8.4.12. Kenya Spinosad Active Ingredient Market Outlook, by Application, 2020-2033
8.4.13. Saudi Arabia Spinosad Active Ingredient Market Outlook, by Form, 2020-2033
8.4.14. Saudi Arabia Spinosad Active Ingredient Market Outlook, by Crop Type, 2020-2033
8.4.15. Saudi Arabia Spinosad Active Ingredient Market Outlook, by Application, 2020-2033
8.4.16. United Arab Emirates Spinosad Active Ingredient Market Outlook, by Form, 2020-2033
8.4.17. United Arab Emirates Spinosad Active Ingredient Market Outlook, by Crop Type, 2020-2033
8.4.18. United Arab Emirates Spinosad Active Ingredient Market Outlook, by Application, 2020-2033
8.4.19. Nigeria Spinosad Active Ingredient Market Outlook, by Form, 2020-2033
8.4.20. Nigeria Spinosad Active Ingredient Market Outlook, by Crop Type, 2020-2033
8.4.21. Nigeria Spinosad Active Ingredient Market Outlook, by Application, 2020-2033
8.4.22. Tanzania Spinosad Active Ingredient Market Outlook, by Form, 2020-2033
8.4.23. Tanzania Spinosad Active Ingredient Market Outlook, by Crop Type, 2020-2033
8.4.24. Tanzania Spinosad Active Ingredient Market Outlook, by Application, 2020-2033
8.4.25. Israel Spinosad Active Ingredient Market Outlook, by Form, 2020-2033
8.4.26. Israel Spinosad Active Ingredient Market Outlook, by Crop Type, 2020-2033
8.4.27. Israel Spinosad Active Ingredient Market Outlook, by Application, 2020-2033
9. Competitive Landscape
9.1. Market Concentration and Industry Leaders
9.2. Competitive Differentiation
9.3. Strategic Moves and Market Direction
9.4. Recent Industry Developments
9.5. Company Profiles
9.5.1. Corteva Agriscience
9.5.2. UPL
9.5.3. Nufarm
9.5.4. Gowan Company
9.5.5. Certis Biologicals
9.5.6. ADAMA
9.5.7. Gadot Agro
9.5.8. Clarke
9.5.9. FMC Corporation
9.5.10. Syngenta Group
9.5.11. Koppert
9.5.12. Andermatt Group
10. Appendix
10.1. Research Methodology
10.2. Report Assumptions
10.3. Acronyms and Abbreviations
| Form | Technical Grade, Suspension Concentrate, Wettable Powder & Granules, Baits |
| Crop Type | Fruits & Nuts, Vegetables & Protected Crops, Field Crops, Others |
| Application | Agriculture, Public Health, Animal Health |
| Regions | North America, Europe, Asia Pacific, Latin America, Middle East & Africa |
Our Research Methodology
Considering the volatility of business today, traditional approaches to strategizing a game plan can be unfruitful if not detrimental. True ambiguity is no way to determine a forecast. A myriad of predetermined factors must be accounted for such as the degree of risk involved, the magnitude of circumstances, as well as conditions or consequences that are not known or unpredictable. To circumvent binary views that cast uncertainty, the application of market research intelligence to strategically posture, move, and enable actionable outcomes is necessary.
View Methodology
Quality Assured
Rigorous Validation Process

Confidentiality Assured
End-to-end Data Security

Custom Research Services
Tailored To Your Objectives
FAQs
The spinosad active ingredient market is valued at US$ 0.707 billion in 2026, led by technical grade sales to crop protection formulators.
The market is projected to reach US$ 1.257 billion by 2033, growing at an 8.6% CAGR and adding US$ 0.550 billion.
Public health is growing fastest at a 10.1% CAGR through 2033, driven by mosquito larvicides and rising vector-borne disease control.
Asia Pacific is growing fastest at a 10.2% CAGR through 2033, driven by generic production and wider use in China and India.
North America holds the largest share at 31.0% in 2026, supported by organic produce, mosquito control, and Corteva Agriscience production.
Related Reports
On The Go Packaging Market Size, Share, Insights, Competitive Landscape, and Forecast 2026 to 2033
On the go packaging market to grow from US$2.19 Bn in 2026 to US$3.00 Bn by 2033 at 4.6% CAGR. Explore materials, products, applications and regions.
Nylon 6 Market Size, Share, Insights, Competitive Landscape, and Forecast 2026 to 2033
Nylon 6 market to reach US$ 26.95 billion by 2033 at a 5.6% CAGR. Explore product forms, applications, feedstocks, leading companies and regional trends.
Vitamin A-Acetate Market Size, Share, Insights, Competitive Landscape, and Forecast 2026 to 2033
Vitamin A-acetate market to reach US$ 2.68 billion by 2033 at a 5.9% CAGR. Explore forms, grades, applications, leading companies and regional trends.
D-Psicose (Allulose) Market Size, Share, Insights, Competitive Landscape, and Forecast 2026 to 2033
D-psicose (allulose) market to reach US$ 0.749 billion by 2033 at a 15.7% CAGR. Explore forms, applications, sales channels and regional trends.
Butter Packaging Market Size, Share, Insights, Competitive Landscape, and Forecast 2026 to 2033
Butter packaging market to reach US$ 4.83 billion by 2033 at a 6.4% CAGR. Explore materials, packaging types, end uses and regional trends.
Plastic Films and Sheets Market Size, Share, Insights, Competitive Landscape, and Forecast 2026 to 2033
Plastic films and sheets market to reach US$ 237.30 billion by 2033 at a 6.0% CAGR. Explore product types, end uses and regional trends.