



Pre-Engineered Buildings Market
Pre-Engineered Buildings Market Size, Share, Insights, Competitive Landscape, and Forecast 2026 to 2033
Report Overview
Pre-Engineered Buildings Market Size and Trend Analysis
How Fast Will Pre-Engineered Building Demand Grow by 2033?
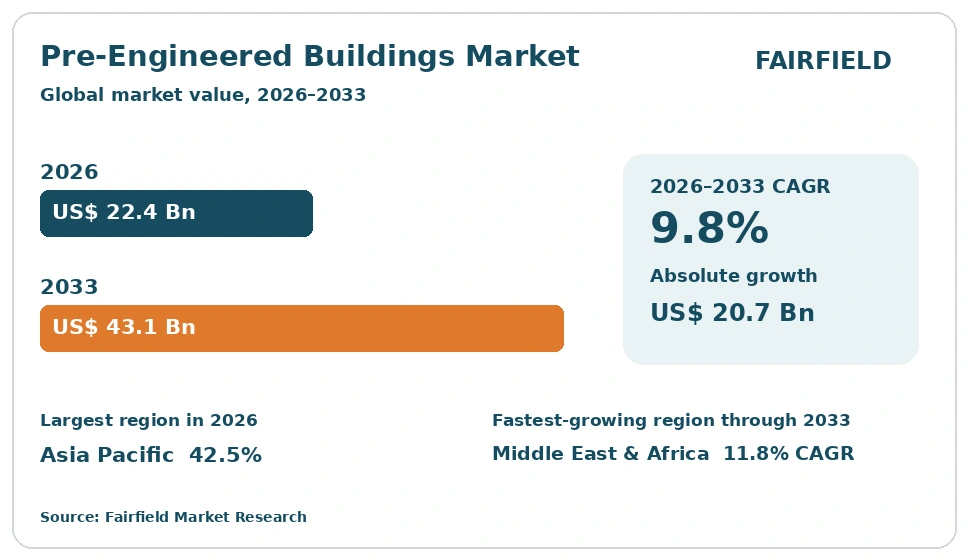
The global Pre-Engineered Buildings market size is expected to be valued at US$ 22.4 billion in 2026 and projected to reach US$ 43.1 billion by 2033, growing at a CAGR of 9.8% between 2026 and 2033. Factory fabrication, faster site erection and lower steel waste keep pulling warehouse, factory and logistics projects toward engineered steel building systems. Growth between 2020 and 2025 ran at a 6.9% CAGR, so the pace now steepens as e-commerce, cold chain and industrial capacity programmes expand. The absolute dollar opportunity over the forecast period stands at US$ 20.7 billion. Buyers now treat speed of occupancy as the main procurement test.
Key Report Takeaways
- By Structure Type: Primary framing systems led with 41.5% share in 2026, while roofing and cladding systems are projected to expand at a 10.9% CAGR through 2033, driven by demand for insulated sandwich panels that cut building energy loads.
- By Structural Design: Clear-span frames held 46.0% share in 2026, while multi-span frames should grow at a 10.6% CAGR through 2033, driven by taller multi-bay plants that need interior columns to carry heavier crane loads.
- By Application: Warehouses and logistics facilities led with 34.0% share in 2026, while institutional buildings are set to rise at an 11.6% CAGR through 2033, driven by school, hospital and sports hall programmes that favour short build cycles.
- By Construction Activity: New construction accounted for 68.0% share in 2026, while relocatable and modular steel buildings are projected to climb at a 12.3% CAGR through 2033, driven by mining camps, data halls and temporary production space.
- By Region: Asia Pacific led with 42.5% share in 2026, ahead of North America, Europe, Middle East & Africa and Latin America, while Middle East & Africa is projected to advance at an 11.8% CAGR through 2033 on Gulf industrial city build-outs.
Market Trends and Insights
Market Growth Drivers
E-commerce and cold chain warehousing pull demand for fast steel shells
Warehouse and cold storage construction is the single strongest pull on pre-engineered building demand. Retailers and third-party logistics operators need large, column-free floor plates close to cities, and they need them within months rather than years. Factory-fabricated steel frames meet that clock, because fabrication runs in parallel with site groundwork. The result is a steady pipeline of orders for clear-span frames, insulated panels and dock accessories.
The underlying trend is the reshaping of distribution networks around same-day delivery. Operators add regional hubs, sortation centres and temperature-controlled rooms near population clusters. Cold rooms suit engineered steel systems, since sandwich panels deliver insulation value and a vapour seal in one component. Hygiene rules for food and pharmaceutical storage favour washable steel liner surfaces, so grocery chains and drug distributors now specify these buildings as a default.
Speed and cost certainty beat conventional concrete construction
Project owners choose engineered steel systems because the total build cost and the handover date are both easier to fix. Shop fabrication removes most weather risk, cuts formwork and shortens the critical path by months on a typical industrial shed. Lighter frames also reduce foundation volume, which lowers civil spend on soft ground. For a manufacturer facing a production start date, that schedule certainty is worth more than the steel itself.
Behind this sits a long shift from site-based trades to controlled factory output. Fabricators run automated plate cutting, welding lines and robotic painting, so tolerances hold tight and rework falls. Three-dimensional modelling links the design office directly to the shop floor, which removes drawing errors before steel is cut. Digital models also feed erection sequencing, so crews know the exact bolt pattern for each frame. Contractors report fewer change orders.
Restraints Impact Analysis of Market
Steel price swings undermine fixed-price building contracts
Volatile steel prices are the sharpest brake on order conversion in this market. Hot-rolled coil and plate make up the bulk of a building’s cost, so a sudden rise can erase the margin on a contract signed months earlier. Suppliers respond with shorter quote validity, price escalation clauses or material surcharges, and buyers delay awards while they wait for calmer pricing. The effect is lumpy order books and postponed capital projects.
The force behind the swings is a mix of trade policy, energy cost and freight. Safeguard duties and anti-dumping measures in several economies shift regional price gaps quickly. Scrap and iron ore markets add further movement, while coating metals such as zinc and aluminium affect panel pricing. Smaller fabricators without hedging arrangements carry the most exposure. Many hold steel stock, which ties up working capital and limits how aggressively they bid.
Shortage of trained erectors and design engineers limits delivery
A thin pool of skilled labour caps how many buildings a supplier can put up each year. Erection is specialist work at height, involving crane handling, bolted moment connections and panel sealing. Crews take years to train, and the trade competes with better-paid infrastructure projects. Design capacity is equally tight, because every building is engineered for its own wind, seismic and snow conditions. Lead times stretch, and some orders move to local conventional builders.
Workforce age profiles make the gap wider in mature construction markets. Experienced detailers and erection supervisors retire faster than apprenticeships replace them, and remote industrial sites struggle to attract crews at all. Suppliers respond by pre-assembling more content in the shop, bolting rather than site-welding, and using self-drilling fasteners to cut skill demand. Training academies run by larger manufacturers help, but they take time to scale.
Market Opportunities
Solar-ready roofs turn building envelopes into revenue
Rooftop solar gives engineered buildings a second revenue role and opens a fresh product line. A large warehouse roof is an uninterrupted plane, and steel purlin systems carry panel loads with modest reinforcement. Suppliers that engineer the frame for photovoltaic loading at the design stage can sell mounting rails, standing-seam clamps and cable routing with the building. The attachment sits deeper in the project and lifts the value of every square metre of roof.
Corporate renewable targets and rising industrial power prices create the demand. Manufacturers and logistics operators want on-site generation to cut energy bills and reported emissions, and many lease roof space to independent power producers. Standing-seam roofs matter because clamps fix panels without piercing the sheet, which protects the warranty. Cool-roof coatings, daylight panels and added insulation sell alongside the same package.
Multi-storey and hybrid steel systems open urban sites
Multi-storey engineered steel buildings create a path into land-constrained city markets that single-storey products cannot reach. Rising urban land prices push logistics operators toward stacked warehouses with ramp access, and light industrial users want two or three working levels under one roof. Mezzanine systems, composite decks and heavier primary frames all come from the same fabrication base. Suppliers can carry existing design and erection capability into a higher-value segment.
Hybrid construction supports the shift, pairing steel frames with concrete cores, precast floors or timber decks. The combination handles fire and acoustic requirements in offices, schools and healthcare space while keeping the speed advantage. Data centre shells are another pull, since operators need tall, strong, fast buildings with heavy roof-mounted plant. Engineering teams are adding connection design, vibration analysis and fire protection detailing to serve these projects.
Category-wise Insights
Which Structure Type Holds the Largest Share?
Primary framing systems hold the largest share at 41.5% in 2026, because the rigid frame carries the building and sets its cost. Tapered built-up columns and rafters are engineered for each span and load case, so they absorb the most steel tonnage and the most design hours. Roofing and cladding systems are the growth leader, expanding at a 10.9% CAGR to 2033. Insulated sandwich panels, standing-seam profiles and higher-performance coatings are replacing plain single-skin sheets as energy codes tighten. Secondary framing and mezzanine accessories fill out the balance at 21.0% and 11.0% respectively. The split matters for suppliers, since envelope products carry better margins and shorter replacement cycles than structural steel. Firms that control panel lines as well as frame fabrication capture more value per building and gain repeat retrofit work.
Which Structural Design Do Buyers Specify Most?
Clear-span frames lead structural design with 46.0% share in 2026, because column-free interiors suit warehouses, aircraft hangars and sports halls. A single rigid frame spanning the full width gives racking and vehicle movement complete freedom, which is the main reason logistics tenants pay for it. Multi-span frames grow fastest at a 10.6% CAGR to 2033, as wider manufacturing plants add interior columns to carry crane runways and heavier roof plant economically. Single-slope and lean-to configurations serve extensions and retail formats. The design mix shapes steel consumption directly, since very wide clear spans demand deeper sections and more fabrication hours. Suppliers with strong analysis software can optimise sections across both design families, trimming tonnage without losing capacity, and that engineering edge increasingly decides which bid wins.
Warehousing anchors demand while institutional projects set the pace
Warehouses and logistics facilities account for 34.0% of application demand in 2026, the largest single block. Distribution hubs, parcel sortation centres and cold stores all favour large, quickly erected steel shells with clear floor area. Institutional buildings are the fastest-growing application at an 11.6% CAGR to 2033, covering schools, clinics, community halls and indoor sports facilities. Public budgets reward short build cycles and predictable costs, and steel systems deliver both. Manufacturing plants remain a steady 29.5% block, while commercial and agricultural buildings make up the rest. For suppliers, the institutional shift means more exposure to public procurement rules, fire and accessibility requirements, and finished interior specifications. That pushes product development toward better acoustics, daylighting and architectural facade options, and it widens the qualified bidder pool for public tenders.
New build dominates while relocatable systems scale quickest
New construction represents 68.0% of activity in 2026, since most engineered buildings are greenfield industrial, logistics or commercial projects. Expansion and extension work adds a further 17.0%, because bolted frames accept bay additions with limited disruption to running operations. Relocatable and modular steel buildings grow fastest at a 12.3% CAGR to 2033, serving mining camps, construction site offices, temporary production space and data hall shells. Re-cladding and roof replacement on ageing stock complete the mix. The pattern tells suppliers that aftermarket and reuse revenue is becoming material. Bolted connections, standard bay modules and documented as-built models make a building easier to extend or move, so manufacturers are designing for a second life rather than a single installation, which lengthens the revenue tail on every building sold.
Geography Analysis
North America runs on metal building systems and reshoring plants
North America holds 24.0% of the market in 2026 and grows at an 8.3% CAGR to 2033. The United States is the core, where metal building systems already cover a large share of low-rise non-residential floor area. Reshoring of semiconductor, battery and pharmaceutical production is adding large industrial shells, and parcel carriers keep building sortation capacity. Canada contributes agricultural, mining and cold-climate industrial work, while Mexico gains from nearshoring plants along its northern corridor. Wind and seismic provisions in regional building codes push buyers toward engineered systems with documented load calculations. Established fabricator networks and dealer channels keep lead times short across the region.
Europe grows on energy codes and industrial refurbishment
Europe accounts for 17.0% of the market in 2026 and advances at a 7.4% CAGR to 2033, the slowest of the five regions. Germany, France, Poland and the United Kingdom supply most demand, with logistics parks along the main freight corridors leading orders. Tight building energy rules favour thicker insulated panels, airtight detailing and low-carbon steel sourcing, which raises content value per square metre even where volumes grow slowly. Refurbishment is a large part of activity, since much of the existing industrial stock needs re-cladding to meet current thermal targets. Planning restrictions and high permitting costs hold back greenfield projects in the densest markets.
Which Region Is Leading the Pre-Engineered Buildings Market?
Asia Pacific leads the market with 42.5% share in 2026 and grows at an 11.1% CAGR to 2033. China and India supply the bulk, backed by deep domestic steel capacity and large fabrication bases that keep prices competitive. Industrial corridor programmes, dedicated freight routes and new logistics parks in India convert steadily into building orders, while Vietnam, Indonesia and Thailand gain electronics and textile plants from supply chain relocation. Australia adds mining, agricultural and warehouse work. Low fabrication cost, short shipping distances and a growing pool of trained erectors let regional suppliers serve both home demand and export projects, which reinforces the region’s lead.
Latin America builds out agriculture and logistics capacity
Latin America holds 6.0% of the market in 2026 and grows at a 9.2% CAGR to 2033. Brazil and Mexico account for most volume, with Chile, Peru and Colombia adding mining and agricultural projects. Grain storage, protein processing and cold chain facilities drive a large part of demand, since agricultural exports need handling capacity near ports and rail heads. Mexican nearshoring plants continue to pull industrial shells northward. Currency movement and import duties on steel shape sourcing decisions, so local fabrication is expanding. Financing cost remains the main constraint on project timing across much of the region, delaying awards even where demand is firm.
Which Region Is Growing Fastest in the Pre-Engineered Buildings Market?
Middle East & Africa is the fastest-growing region, advancing at an 11.8% CAGR to 2033 from a 10.5% share in 2026. Saudi Arabia and the United Arab Emirates lead, as economic diversification programmes build industrial cities, manufacturing zones and logistics hubs around deepwater ports. Engineered steel suits the climate and the schedule, since shop fabrication avoids extended outdoor work in extreme heat. Egypt, South Africa, Morocco and Nigeria add automotive, food processing and warehouse projects. A long-established regional fabrication base exports across the Gulf and into wider Africa. Local content rules increasingly require in-region manufacturing, which is drawing further plant investment.
Competitive Landscape
The market is moderately fragmented. A small group of international manufacturers with multi-plant capacity competes against a long tail of regional fabricators that win on price, proximity and local code knowledge. Share concentrates in Asia Pacific and the Gulf, where large dedicated plants serve both home and export demand. Consolidation is gradual, mostly steel producers and building product groups absorbing fabricators to secure downstream volume.
Competition runs on engineering depth rather than steel alone. Suppliers differentiate through optimisation software that trims tonnage, automated fabrication lines that hold tolerances, and envelope systems with better thermal and weather performance. Delivery certainty counts heavily, because buyers choose on handover dates. Sustainability credentials now enter tenders through recycled content, electric arc furnace steel and documented embodied carbon. Newer entrants from modular and data centre construction push faster, more repeatable building formats.
Strategic activity centres on capacity, geography and capability. Manufacturers add fabrication plants near growth corridors to cut freight cost and lead time, and extend panel and coating lines to capture envelope value. Partnerships with solar developers, insulation makers and design software providers broaden what a single contract can cover. Investment in digital modelling, project tracking and erection training protects margin where skilled labour is scarce.
Vendor strategy is moving toward whole-building responsibility. The direction is away from supplying steel kits and toward design, supply, erection and aftercare under one agreement. Companies are building service networks for re-cladding, roof upgrades and building extension, since existing stock is large. Low-carbon steel sourcing and solar-ready roofs are becoming standard parts of the offer rather than paid extras.
Industry Leaders
- BlueScope Steel Limited
- Nucor Corporation
- Cornerstone Building Brands, Inc.
- Zamil Steel Holding Company
- Kirby Building Systems
- Lindab International AB
Companies Covered in the Report
- BlueScope Steel Limited
- Nucor Corporation
- Cornerstone Building Brands, Inc.
- Zamil Steel Holding Company
- Kirby Building Systems
- Lindab International AB
- SSAB AB
- Tata BlueScope Steel Private Limited
- Interarch Building Products Limited
- Everest Industries Limited
- Pennar Industries Limited
- PEB Steel Buildings Co., Ltd.
- ATAD Steel Structure Corporation
- Mammut Building Systems LLC
- Behlen Mfg. Co.
Pre-Engineered Buildings Market Report Scope
The pre-engineered buildings market is segmented by structure type, structural design, application, construction activity and region.
| By Structure Type | Primary framing systems, Secondary framing systems, Roofing and cladding systems, Mezzanine and accessory systems |
| By Structural Design | Clear-span frames, Multi-span frames, Single-slope frames, Lean-to and open-sided frames |
| By Application | Warehouses and logistics facilities, Manufacturing and industrial plants, Commercial and retail buildings, Institutional buildings, Agricultural buildings |
| By Construction Activity | New construction, Expansion and extension, Retrofit and re-cladding, Relocatable and modular buildings |
| By Region | North America, Europe, Asia Pacific, Latin America, Middle East & Africa |
1. Executive Summary
1.1 Global Pre-Engineered Buildings Market Snapshot
1.2 Future Projections, 2026–2033
1.3 Key Industry Highlights
1.4 Regional Snapshot
2. Market Overview
2.1 Market Definition and Report Scope
2.2 Historical Market Trends
2.3 Market Dynamics
2.3.1 Drivers
2.3.1.1 E-commerce and cold chain warehousing pull demand for fast steel shells
2.3.1.2 Speed and cost certainty beat conventional concrete construction
2.3.2 Restraints
2.3.2.1 Steel price swings undermine fixed-price building contracts
2.3.2.2 Shortage of trained erectors and design engineers limits delivery
2.3.3 Market Opportunities
2.3.3.1 Solar-ready roofs turn building envelopes into revenue
2.3.3.2 Multi-storey and hybrid steel systems open urban sites
3. Global Pre-Engineered Buildings Market Outlook, 2026–2033
3.1 Global Pre-Engineered Buildings Market Outlook, by Structure Type, Value (US$ Billion), 2026–2033
3.1.1 Primary framing systems
3.1.2 Secondary framing systems
3.1.3 Roofing and cladding systems
3.1.4 Mezzanine and accessory systems
3.2 Global Pre-Engineered Buildings Market Outlook, by Structural Design, Value (US$ Billion), 2026–2033
3.2.1 Clear-span frames
3.2.2 Multi-span frames
3.2.3 Single-slope frames
3.2.4 Lean-to and open-sided frames
3.3 Global Pre-Engineered Buildings Market Outlook, by Application, Value (US$ Billion), 2026–2033
3.3.1 Warehouses and logistics facilities
3.3.2 Manufacturing and industrial plants
3.3.3 Commercial and retail buildings
3.3.4 Institutional buildings
3.3.5 Agricultural buildings
3.4 Global Pre-Engineered Buildings Market Outlook, by Construction Activity, Value (US$ Billion), 2026–2033
3.4.1 New construction
3.4.2 Expansion and extension
3.4.3 Retrofit and re-cladding
3.4.4 Relocatable and modular buildings
3.5 Global Pre-Engineered Buildings Market Outlook, by Region, Value (US$ Billion), 2026–2033
3.5.1 North America
3.5.2 Europe
3.5.3 Asia Pacific
3.5.4 Latin America
3.5.5 Middle East & Africa
4. North America Pre-Engineered Buildings Market Outlook, 2026–2033
4.1 North America Pre-Engineered Buildings Market Outlook, by Structure Type, Value (US$ Billion), 2026–2033
4.1.1 Primary framing systems
4.1.2 Secondary framing systems
4.1.3 Roofing and cladding systems
4.1.4 Mezzanine and accessory systems
4.2 North America Pre-Engineered Buildings Market Outlook, by Structural Design, Value (US$ Billion), 2026–2033
4.2.1 Clear-span frames
4.2.2 Multi-span frames
4.2.3 Single-slope frames
4.2.4 Lean-to and open-sided frames
4.3 North America Pre-Engineered Buildings Market Outlook, by Application, Value (US$ Billion), 2026–2033
4.3.1 Warehouses and logistics facilities
4.3.2 Manufacturing and industrial plants
4.3.3 Commercial and retail buildings
4.3.4 Institutional buildings
4.3.5 Agricultural buildings
4.4 North America Pre-Engineered Buildings Market Outlook, by Construction Activity, Value (US$ Billion), 2026–2033
4.4.1 New construction
4.4.2 Expansion and extension
4.4.3 Retrofit and re-cladding
4.4.4 Relocatable and modular buildings
4.5 North America Pre-Engineered Buildings Market Outlook, by Country, Value (US$ Billion), 2026–2033
4.5.1 United States Pre-Engineered Buildings Market Outlook, by Structure Type, 2026–2033
4.5.2 United States Pre-Engineered Buildings Market Outlook, by Structural Design, 2026–2033
4.5.3 United States Pre-Engineered Buildings Market Outlook, by Application, 2026–2033
4.5.4 United States Pre-Engineered Buildings Market Outlook, by Construction Activity, 2026–2033
4.5.5 Canada Pre-Engineered Buildings Market Outlook, by Structure Type, 2026–2033
4.5.6 Canada Pre-Engineered Buildings Market Outlook, by Structural Design, 2026–2033
4.5.7 Canada Pre-Engineered Buildings Market Outlook, by Application, 2026–2033
4.5.8 Canada Pre-Engineered Buildings Market Outlook, by Construction Activity, 2026–2033
4.5.9 Mexico Pre-Engineered Buildings Market Outlook, by Structure Type, 2026–2033
4.5.10 Mexico Pre-Engineered Buildings Market Outlook, by Structural Design, 2026–2033
4.5.11 Mexico Pre-Engineered Buildings Market Outlook, by Application, 2026–2033
4.5.12 Mexico Pre-Engineered Buildings Market Outlook, by Construction Activity, 2026–2033
5. Europe Pre-Engineered Buildings Market Outlook, 2026–2033
5.1 Europe Pre-Engineered Buildings Market Outlook, by Structure Type, Value (US$ Billion), 2026–2033
5.1.1 Primary framing systems
5.1.2 Secondary framing systems
5.1.3 Roofing and cladding systems
5.1.4 Mezzanine and accessory systems
5.2 Europe Pre-Engineered Buildings Market Outlook, by Structural Design, Value (US$ Billion), 2026–2033
5.2.1 Clear-span frames
5.2.2 Multi-span frames
5.2.3 Single-slope frames
5.2.4 Lean-to and open-sided frames
5.3 Europe Pre-Engineered Buildings Market Outlook, by Application, Value (US$ Billion), 2026–2033
5.3.1 Warehouses and logistics facilities
5.3.2 Manufacturing and industrial plants
5.3.3 Commercial and retail buildings
5.3.4 Institutional buildings
5.3.5 Agricultural buildings
5.4 Europe Pre-Engineered Buildings Market Outlook, by Construction Activity, Value (US$ Billion), 2026–2033
5.4.1 New construction
5.4.2 Expansion and extension
5.4.3 Retrofit and re-cladding
5.4.4 Relocatable and modular buildings
5.5 Europe Pre-Engineered Buildings Market Outlook, by Country, Value (US$ Billion), 2026–2033
5.5.1 Germany Pre-Engineered Buildings Market Outlook, by Structure Type, 2026–2033
5.5.2 Germany Pre-Engineered Buildings Market Outlook, by Structural Design, 2026–2033
5.5.3 Germany Pre-Engineered Buildings Market Outlook, by Application, 2026–2033
5.5.4 Germany Pre-Engineered Buildings Market Outlook, by Construction Activity, 2026–2033
5.5.5 France Pre-Engineered Buildings Market Outlook, by Structure Type, 2026–2033
5.5.6 France Pre-Engineered Buildings Market Outlook, by Structural Design, 2026–2033
5.5.7 France Pre-Engineered Buildings Market Outlook, by Application, 2026–2033
5.5.8 France Pre-Engineered Buildings Market Outlook, by Construction Activity, 2026–2033
5.5.9 Poland Pre-Engineered Buildings Market Outlook, by Structure Type, 2026–2033
5.5.10 Poland Pre-Engineered Buildings Market Outlook, by Structural Design, 2026–2033
5.5.11 Poland Pre-Engineered Buildings Market Outlook, by Application, 2026–2033
5.5.12 Poland Pre-Engineered Buildings Market Outlook, by Construction Activity, 2026–2033
5.5.13 United Kingdom Pre-Engineered Buildings Market Outlook, by Structure Type, 2026–2033
5.5.14 United Kingdom Pre-Engineered Buildings Market Outlook, by Structural Design, 2026–2033
5.5.15 United Kingdom Pre-Engineered Buildings Market Outlook, by Application, 2026–2033
5.5.16 United Kingdom Pre-Engineered Buildings Market Outlook, by Construction Activity, 2026–2033
6. Asia Pacific Pre-Engineered Buildings Market Outlook, 2026–2033
6.1 Asia Pacific Pre-Engineered Buildings Market Outlook, by Structure Type, Value (US$ Billion), 2026–2033
6.1.1 Primary framing systems
6.1.2 Secondary framing systems
6.1.3 Roofing and cladding systems
6.1.4 Mezzanine and accessory systems
6.2 Asia Pacific Pre-Engineered Buildings Market Outlook, by Structural Design, Value (US$ Billion), 2026–2033
6.2.1 Clear-span frames
6.2.2 Multi-span frames
6.2.3 Single-slope frames
6.2.4 Lean-to and open-sided frames
6.3 Asia Pacific Pre-Engineered Buildings Market Outlook, by Application, Value (US$ Billion), 2026–2033
6.3.1 Warehouses and logistics facilities
6.3.2 Manufacturing and industrial plants
6.3.3 Commercial and retail buildings
6.3.4 Institutional buildings
6.3.5 Agricultural buildings
6.4 Asia Pacific Pre-Engineered Buildings Market Outlook, by Construction Activity, Value (US$ Billion), 2026–2033
6.4.1 New construction
6.4.2 Expansion and extension
6.4.3 Retrofit and re-cladding
6.4.4 Relocatable and modular buildings
6.5 Asia Pacific Pre-Engineered Buildings Market Outlook, by Country, Value (US$ Billion), 2026–2033
6.5.1 China Pre-Engineered Buildings Market Outlook, by Structure Type, 2026–2033
6.5.2 China Pre-Engineered Buildings Market Outlook, by Structural Design, 2026–2033
6.5.3 China Pre-Engineered Buildings Market Outlook, by Application, 2026–2033
6.5.4 China Pre-Engineered Buildings Market Outlook, by Construction Activity, 2026–2033
6.5.5 India Pre-Engineered Buildings Market Outlook, by Structure Type, 2026–2033
6.5.6 India Pre-Engineered Buildings Market Outlook, by Structural Design, 2026–2033
6.5.7 India Pre-Engineered Buildings Market Outlook, by Application, 2026–2033
6.5.8 India Pre-Engineered Buildings Market Outlook, by Construction Activity, 2026–2033
6.5.9 Vietnam Pre-Engineered Buildings Market Outlook, by Structure Type, 2026–2033
6.5.10 Vietnam Pre-Engineered Buildings Market Outlook, by Structural Design, 2026–2033
6.5.11 Vietnam Pre-Engineered Buildings Market Outlook, by Application, 2026–2033
6.5.12 Vietnam Pre-Engineered Buildings Market Outlook, by Construction Activity, 2026–2033
6.5.13 Indonesia Pre-Engineered Buildings Market Outlook, by Structure Type, 2026–2033
6.5.14 Indonesia Pre-Engineered Buildings Market Outlook, by Structural Design, 2026–2033
6.5.15 Indonesia Pre-Engineered Buildings Market Outlook, by Application, 2026–2033
6.5.16 Indonesia Pre-Engineered Buildings Market Outlook, by Construction Activity, 2026–2033
6.5.17 Thailand Pre-Engineered Buildings Market Outlook, by Structure Type, 2026–2033
6.5.18 Thailand Pre-Engineered Buildings Market Outlook, by Structural Design, 2026–2033
6.5.19 Thailand Pre-Engineered Buildings Market Outlook, by Application, 2026–2033
6.5.20 Thailand Pre-Engineered Buildings Market Outlook, by Construction Activity, 2026–2033
6.5.21 Australia Pre-Engineered Buildings Market Outlook, by Structure Type, 2026–2033
6.5.22 Australia Pre-Engineered Buildings Market Outlook, by Structural Design, 2026–2033
6.5.23 Australia Pre-Engineered Buildings Market Outlook, by Application, 2026–2033
6.5.24 Australia Pre-Engineered Buildings Market Outlook, by Construction Activity, 2026–2033
7. Latin America Pre-Engineered Buildings Market Outlook, 2026–2033
7.1 Latin America Pre-Engineered Buildings Market Outlook, by Structure Type, Value (US$ Billion), 2026–2033
7.1.1 Primary framing systems
7.1.2 Secondary framing systems
7.1.3 Roofing and cladding systems
7.1.4 Mezzanine and accessory systems
7.2 Latin America Pre-Engineered Buildings Market Outlook, by Structural Design, Value (US$ Billion), 2026–2033
7.2.1 Clear-span frames
7.2.2 Multi-span frames
7.2.3 Single-slope frames
7.2.4 Lean-to and open-sided frames
7.3 Latin America Pre-Engineered Buildings Market Outlook, by Application, Value (US$ Billion), 2026–2033
7.3.1 Warehouses and logistics facilities
7.3.2 Manufacturing and industrial plants
7.3.3 Commercial and retail buildings
7.3.4 Institutional buildings
7.3.5 Agricultural buildings
7.4 Latin America Pre-Engineered Buildings Market Outlook, by Construction Activity, Value (US$ Billion), 2026–2033
7.4.1 New construction
7.4.2 Expansion and extension
7.4.3 Retrofit and re-cladding
7.4.4 Relocatable and modular buildings
7.5 Latin America Pre-Engineered Buildings Market Outlook, by Country, Value (US$ Billion), 2026–2033
7.5.1 Brazil Pre-Engineered Buildings Market Outlook, by Structure Type, 2026–2033
7.5.2 Brazil Pre-Engineered Buildings Market Outlook, by Structural Design, 2026–2033
7.5.3 Brazil Pre-Engineered Buildings Market Outlook, by Application, 2026–2033
7.5.4 Brazil Pre-Engineered Buildings Market Outlook, by Construction Activity, 2026–2033
7.5.5 Mexico Pre-Engineered Buildings Market Outlook, by Structure Type, 2026–2033
7.5.6 Mexico Pre-Engineered Buildings Market Outlook, by Structural Design, 2026–2033
7.5.7 Mexico Pre-Engineered Buildings Market Outlook, by Application, 2026–2033
7.5.8 Mexico Pre-Engineered Buildings Market Outlook, by Construction Activity, 2026–2033
7.5.9 Chile Pre-Engineered Buildings Market Outlook, by Structure Type, 2026–2033
7.5.10 Chile Pre-Engineered Buildings Market Outlook, by Structural Design, 2026–2033
7.5.11 Chile Pre-Engineered Buildings Market Outlook, by Application, 2026–2033
7.5.12 Chile Pre-Engineered Buildings Market Outlook, by Construction Activity, 2026–2033
7.5.13 Peru Pre-Engineered Buildings Market Outlook, by Structure Type, 2026–2033
7.5.14 Peru Pre-Engineered Buildings Market Outlook, by Structural Design, 2026–2033
7.5.15 Peru Pre-Engineered Buildings Market Outlook, by Application, 2026–2033
7.5.16 Peru Pre-Engineered Buildings Market Outlook, by Construction Activity, 2026–2033
7.5.17 Colombia Pre-Engineered Buildings Market Outlook, by Structure Type, 2026–2033
7.5.18 Colombia Pre-Engineered Buildings Market Outlook, by Structural Design, 2026–2033
7.5.19 Colombia Pre-Engineered Buildings Market Outlook, by Application, 2026–2033
7.5.20 Colombia Pre-Engineered Buildings Market Outlook, by Construction Activity, 2026–2033
8. Middle East & Africa Pre-Engineered Buildings Market Outlook, 2026–2033
8.1 Middle East & Africa Pre-Engineered Buildings Market Outlook, by Structure Type, Value (US$ Billion), 2026–2033
8.1.1 Primary framing systems
8.1.2 Secondary framing systems
8.1.3 Roofing and cladding systems
8.1.4 Mezzanine and accessory systems
8.2 Middle East & Africa Pre-Engineered Buildings Market Outlook, by Structural Design, Value (US$ Billion), 2026–2033
8.2.1 Clear-span frames
8.2.2 Multi-span frames
8.2.3 Single-slope frames
8.2.4 Lean-to and open-sided frames
8.3 Middle East & Africa Pre-Engineered Buildings Market Outlook, by Application, Value (US$ Billion), 2026–2033
8.3.1 Warehouses and logistics facilities
8.3.2 Manufacturing and industrial plants
8.3.3 Commercial and retail buildings
8.3.4 Institutional buildings
8.3.5 Agricultural buildings
8.4 Middle East & Africa Pre-Engineered Buildings Market Outlook, by Construction Activity, Value (US$ Billion), 2026–2033
8.4.1 New construction
8.4.2 Expansion and extension
8.4.3 Retrofit and re-cladding
8.4.4 Relocatable and modular buildings
8.5 Middle East & Africa Pre-Engineered Buildings Market Outlook, by Country and Subregion, Value (US$ Billion), 2026–2033
8.5.1 Saudi Arabia Pre-Engineered Buildings Market Outlook, by Structure Type, 2026–2033
8.5.2 Saudi Arabia Pre-Engineered Buildings Market Outlook, by Structural Design, 2026–2033
8.5.3 Saudi Arabia Pre-Engineered Buildings Market Outlook, by Application, 2026–2033
8.5.4 Saudi Arabia Pre-Engineered Buildings Market Outlook, by Construction Activity, 2026–2033
8.5.5 United Arab Emirates Pre-Engineered Buildings Market Outlook, by Structure Type, 2026–2033
8.5.6 United Arab Emirates Pre-Engineered Buildings Market Outlook, by Structural Design, 2026–2033
8.5.7 United Arab Emirates Pre-Engineered Buildings Market Outlook, by Application, 2026–2033
8.5.8 United Arab Emirates Pre-Engineered Buildings Market Outlook, by Construction Activity, 2026–2033
8.5.9 Egypt Pre-Engineered Buildings Market Outlook, by Structure Type, 2026–2033
8.5.10 Egypt Pre-Engineered Buildings Market Outlook, by Structural Design, 2026–2033
8.5.11 Egypt Pre-Engineered Buildings Market Outlook, by Application, 2026–2033
8.5.12 Egypt Pre-Engineered Buildings Market Outlook, by Construction Activity, 2026–2033
8.5.13 South Africa Pre-Engineered Buildings Market Outlook, by Structure Type, 2026–2033
8.5.14 South Africa Pre-Engineered Buildings Market Outlook, by Structural Design, 2026–2033
8.5.15 South Africa Pre-Engineered Buildings Market Outlook, by Application, 2026–2033
8.5.16 South Africa Pre-Engineered Buildings Market Outlook, by Construction Activity, 2026–2033
8.5.17 Morocco Pre-Engineered Buildings Market Outlook, by Structure Type, 2026–2033
8.5.18 Morocco Pre-Engineered Buildings Market Outlook, by Structural Design, 2026–2033
8.5.19 Morocco Pre-Engineered Buildings Market Outlook, by Application, 2026–2033
8.5.20 Morocco Pre-Engineered Buildings Market Outlook, by Construction Activity, 2026–2033
8.5.21 Nigeria Pre-Engineered Buildings Market Outlook, by Structure Type, 2026–2033
8.5.22 Nigeria Pre-Engineered Buildings Market Outlook, by Structural Design, 2026–2033
8.5.23 Nigeria Pre-Engineered Buildings Market Outlook, by Application, 2026–2033
8.5.24 Nigeria Pre-Engineered Buildings Market Outlook, by Construction Activity, 2026–2033
8.5.25 Gulf Pre-Engineered Buildings Market Outlook, by Structure Type, 2026–2033
8.5.26 Gulf Pre-Engineered Buildings Market Outlook, by Structural Design, 2026–2033
8.5.27 Gulf Pre-Engineered Buildings Market Outlook, by Application, 2026–2033
8.5.28 Gulf Pre-Engineered Buildings Market Outlook, by Construction Activity, 2026–2033
9. Competitive Landscape
9.1 Industry Leaders
9.2 Company Profiles
9.2.1 BlueScope Steel Limited
9.2.2 Nucor Corporation
9.2.3 Cornerstone Building Brands, Inc.
9.2.4 Zamil Steel Holding Company
9.2.5 Kirby Building Systems
9.2.6 Lindab International AB
9.2.7 SSAB AB
9.2.8 Tata BlueScope Steel Private Limited
9.2.9 Interarch Building Products Limited
9.2.10 Everest Industries Limited
9.2.11 Pennar Industries Limited
9.2.12 PEB Steel Buildings Co., Ltd.
9.2.13 ATAD Steel Structure Corporation
9.2.14 Mammut Building Systems LLC
9.2.15 Behlen Mfg. Co.
10. Appendix
10.1 Research Methodology
10.2 Report Assumptions
10.3 Acronyms and Abbreviations
| By Structure Type | Primary framing systems, Secondary framing systems, Roofing and cladding systems, Mezzanine and accessory systems |
| By Structural Design | Clear-span frames, Multi-span frames, Single-slope frames, Lean-to and open-sided frames |
| By Application | Warehouses and logistics facilities, Manufacturing and industrial plants, Commercial and retail buildings, Institutional buildings, Agricultural buildings |
| By Construction Activity | New construction, Expansion and extension, Retrofit and re-cladding, Relocatable and modular buildings |
| By Region | North America, Europe, Asia Pacific, Latin America, Middle East & Africa |
Our Research Methodology
Considering the volatility of business today, traditional approaches to strategizing a game plan can be unfruitful if not detrimental. True ambiguity is no way to determine a forecast. A myriad of predetermined factors must be accounted for such as the degree of risk involved, the magnitude of circumstances, as well as conditions or consequences that are not known or unpredictable. To circumvent binary views that cast uncertainty, the application of market research intelligence to strategically posture, move, and enable actionable outcomes is necessary.
View Methodology
Quality Assured
Rigorous Validation Process

Confidentiality Assured
End-to-end Data Security

Custom Research Services
Tailored To Your Objectives
FAQs
The global pre-engineered buildings market is valued at US$ 22.4 billion in 2026, supported by warehouse, factory and logistics construction across major economies.
The market is projected to grow at a 9.8% CAGR between 2026 and 2033, reaching US$ 43.1 billion and adding US$ 20.7 billion.
Warehouses and logistics facilities lead with 34.0% share in 2026, while institutional buildings grow fastest at an 11.6% CAGR through 2033.
Asia Pacific holds 42.5% share in 2026, while Middle East & Africa is the fastest-growing region at an 11.8% CAGR through 2033.
The market is moderately fragmented, with international manufacturers competing against many regional fabricators that win work on price, proximity and local code knowledge.
Related Reports
Precision Reduction Gears Market Size, Share, Insights, Competitive Landscape, and Forecast 2026 to 2033
The precision reduction gears market is projected to grow from US$3.4 billion in 2026 to US$6.46 billion by 2033 at a 9.6% CAGR.
Pleated Filters Market Size, Share, Insights, Competitive Landscape, and Forecast 2026 to 2033
The pleated filters market is projected to grow from US$4.8 billion in 2026 to US$7.6 billion by 2033 at a 6.8% CAGR.
Machine Automation Controller Market Size, Share, Insights, Competitive Landscape, and Forecast 2026 to 2033
The global machine automation controller market is valued at US$2.4 billion in 2026, reaching US$4.5 billion by 2033, growing at a 9.4% CAGR
Lined Valve Market Size, Share, Insights, Competitive Landscape, and Forecast 2026 to 2033
The global lined valve market is valued at US$2.8 billion in 2026, reaching US$4.1 billion by 2033, growing at a 5.6% CAGR
Hydraulic Intensifiers Market Size, Share, Insights, Competitive Landscape, and Forecast 2026 to 2033
The global hydraulic intensifiers market is valued at US$1.28 billion in 2026, reaching US$1.92 billion by 2033, growing at a 6.0% CAGR
Dual Chamber Syringe Filling Machine Market Size, Share, Insights, Competitive Landscape, and Forecast 2026 to 2033
The dual chamber syringe filling machine market is projected to grow from US$430 million in 2026 to US$771 million by 2033 at an 8.7% CAGR.