



Precision Reduction Gears Market
Precision Reduction Gears Market Size, Share, Insights, Competitive Landscape, and Forecast 2026 to 2033
Report Overview
Precision Reduction Gears Market Size and Trend Analysis
How Fast Will Precision Reduction Gear Demand Grow?
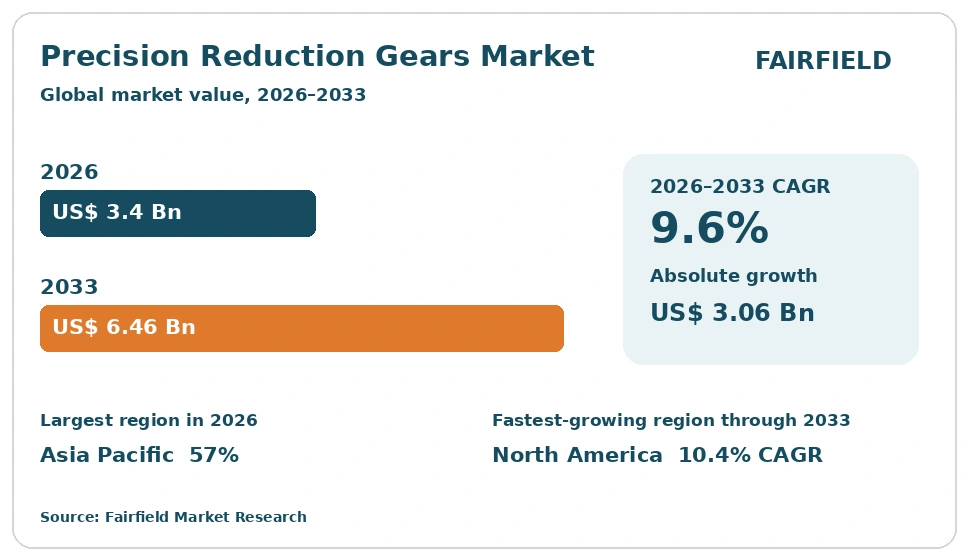
The global Precision Reduction Gears market size is expected to be valued at US$ 3.4 billion in 2026 and projected to reach US$ 6.46 billion by 2033, growing at a CAGR of 9.6% between 2026 and 2033. That path adds an absolute dollar opportunity of US$ 3.06 billion, against a slower historical CAGR of 7.8% over 2020–2025. Growth rests on rising robot installations, wider use of collaborative arms, and tighter accuracy limits in machine tools and wafer handling. Buyers want lower backlash, higher torsional stiffness and longer rebuild intervals. Suppliers are adding gear-grinding capacity and sensor-ready designs to meet that demand.
Key Report Takeaways
- By Product Type: RV and cycloidal reducers led with 44% share in 2026, while strain wave reducers are projected to expand at an 11.2% CAGR through 2033, driven by lightweight collaborative arms that need compact, zero-backlash joints.
- By Application: Industrial robots led with 51% share in 2026, while collaborative robots are projected to expand at a 13.0% CAGR through 2033, driven by small-batch electronics assembly work that larger caged robot cells handle poorly.
- By End-use Industry: Automotive led with 34% share in 2026, while logistics and warehousing is projected to expand at a 12.4% CAGR through 2033, driven by mobile manipulators used for piece picking inside distribution centres.
- By Region: Across North America, Europe, Asia Pacific, Latin America and Middle East & Africa, Asia Pacific led with 57% share in 2026, while North America is projected to expand at a 10.4% CAGR through 2033, driven by new semiconductor fabrication plants.
Market Trends and Insights
Market Growth Drivers
Rising Robot Installations and Joint Rebuild Programmes Lift Unit Demand
Growing industrial robot output is the largest single source of precision reducer demand. A standard articulated arm carries four to seven reducers, so component volume scales with robot shipments rather than with factory count. Automotive body shops, electronics assembly lines and general machining cells keep replacing fixed automation with reprogrammable arms. Rebuild work adds volume, because ageing fleets need fresh joints to hold positioning accuracy.
Behind this sits a steady shift from manual assembly to sensor-guided automation in both mature and emerging economies. Rising wages, tighter quality limits and shorter product cycles push plants toward arms that can be moved between models. Robot builders in Japan, China, Germany and South Korea continue to expand assembly capacity, and each new line locks in multi-year component supply agreements. Reducer makers answer by adding grinding and heat-treatment capacity near those customers.
Collaborative and Mobile Robots Widen the Addressable Base
Collaborative arms and mobile manipulators pull reducer demand beyond the traditional caged robot cell. These machines are lighter, run at lower payloads and are bought by smaller manufacturers that never owned automation before. Each unit still needs compact, zero-backlash gearing with high torque density, so the value per joint stays meaningful even as payloads fall. Mobile bases add further wheel-drive and arm-joint content.
Demand is spreading because safety-rated force limiting now lets arms work beside people without fencing. That removes a large share of integration cost and shortens payback periods for small workshops. Electronics assembly, laboratory automation, food handling and warehouse order picking are the clearest adopters. Component suppliers are responding with hollow-shaft strain wave units, integrated encoders and pre-assembled actuator modules that cut build time for machine makers and lower their qualification burden.
Restraints Impact Analysis of Market
High Unit Cost and Capital-Intensive Manufacturing Limit Price-Sensitive Adoption
Precision reducers carry high unit cost, which keeps them out of many price-sensitive automation projects. Arc-second accuracy demands ground gear profiles, matched bearings, controlled heat treatment and extended run-in testing. Scrap rates stay high, and finished units must be measured individually. For low-duty handling tasks, buyers often choose simpler worm or belt drives, or direct-drive motors, and accept weaker positioning performance in exchange for lower cost.
The constraint is structural rather than temporary. Gear-grinding machines, metrology equipment and clean heat-treatment lines all require heavy capital outlay, and payback depends on steady volume. Skilled grinding and inspection staff are scarce in most regions, which slows capacity additions. Smaller machine builders also lack the volume to negotiate favourable pricing, so component cost can account for a large share of a finished joint, which caps penetration in light assembly equipment.
Concentrated Input Supply and Long Lead Times Restrict Output
Supply concentration restricts how quickly reducer output can rise when robot demand jumps. Cross-roller bearings, flexible spline steels, clean alloy bar stock and precision grinding machines come from a narrow group of qualified suppliers. When robot builders raise schedules together, lead times stretch and allocation follows. Machine makers then redesign around whatever is available, which delays launches and pushes some projects to later budget cycles.
Qualification rules make substitution slow. A reducer change usually forces fresh accuracy testing, life testing and sometimes customer re-approval, so buyers hold on to proven part numbers through shortages. Alloy steel quality, carburising consistency and lubricant specification all affect rated life, which limits how freely a second source can be added. Capacity expansion also runs on long timelines, since grinding machines and metrology rooms take many months to install and validate.
Market Opportunities
Humanoid and General-Purpose Robots Open a New Volume Channel
Humanoid and general-purpose robots represent the clearest new revenue pool for precision gearing. These machines use far more actuated joints than a conventional arm, with counts commonly running into the twenties and thirties. Each joint needs compact, high-stiffness, back-drivable gearing within tight mass limits. If even modest build volumes are reached, unit demand per machine would exceed anything in classic industrial robotics.
Development activity is concentrated among robot start-ups, automotive groups and electronics manufacturers that already understand high-volume assembly. Their requirements differ from factory robots: lighter housings, quieter operation, integrated torque sensing and far lower target cost per joint. That pushes suppliers toward design-to-cost programmes, aluminium and composite housings, and simplified assembly. Firms that reach automotive-style cost curves without losing accuracy stand to convert a development niche into sustained series production over the forecast period.
Localised Manufacturing and Sensor-Integrated Units Create New Value
Localised production and smarter reducers create a second growth route for suppliers. Machine builders in North America, Europe, India and Southeast Asia want shorter supply chains after repeated shortages, and they will pay for nearby capacity and faster engineering support. Local assembly, regional spares stock and rebuild services turn a component sale into a longer revenue relationship with service margins attached.
Sensor integration adds further value. Embedded temperature, vibration and torque sensing lets an operator track wear, lubricant condition and backlash growth instead of replacing joints on a fixed calendar. That supports predictive maintenance programmes in fabs, machine shops and warehouses where unplanned downtime is expensive. Suppliers shipping pre-aligned actuator modules with built-in diagnostics also cut integration labour. The result is higher content per joint and stronger switching costs once a platform is designed in.
Category-wise Insights
Which Product Type Dominates Precision Reduction Gear Demand?
RV and cycloidal reducers dominate, holding 44% share in 2026. Their rolling-element design carries shock loads and high torque at the base and shoulder joints of articulated robots, where stiffness matters most. Long rebuild intervals and proven life data keep them specified across automotive welding and heavy handling cells. Precision planetary gearboxes hold 20% share, mostly in machine tool axes and rotary tables, while other types account for 5%.
Strain wave reducers lead on growth, with an 11.2% CAGR through 2033, and hold 31% share in 2026. Their single-stage, zero-backlash design suits wrist joints, collaborative arms and surgical instruments where mass is restricted. The practical result is a market split by duty: cycloidal gearing holds the heavy end, while strain wave units capture the lighter, faster-growing platforms.
Mid-Range Torque Classes Anchor the Bulk of Shipments
The 50–500 Nm class leads rated output torque with 48% share in 2026. It matches the payload band of six-axis robots used for machine tending, palletising and general assembly, which is where most installed units sit. Standardised mounting interfaces also let machine builders reuse joint designs across model families, which lowers engineering cost.
Units rated up to 50 Nm grow fastest at an 11.5% CAGR through 2033 from 22% share, pulled by collaborative wrists, laboratory automation and medical instruments. Above 500 Nm, holding 30% share, demand tracks heavy spot welding, press tending and large gantry systems, and depends on automotive capital spending cycles. The spread matters commercially: suppliers now need both a high-volume light range and a low-volume heavy range to hold full platform positions with major robot builders.
Which Application Generates the Most Precision Reducer Demand?
Industrial robots generate the most demand, with 51% share in 2026. Articulated arms consume several reducers each, and installed fleets need periodic joint rebuilds that keep aftermarket volume steady. Machine tools follow at 17%, where reducers drive rotary tables, tool changers and swivel heads. Semiconductor equipment holds 10%, with cleanroom wafer handlers demanding low particle generation and very repeatable positioning.
Collaborative robots grow fastest at a 13.0% CAGR through 2033 from 14% share. Safety-rated force limiting lets them work beside operators without fencing, which opens small and mid-sized workshops that could not justify caged cells. Medical devices account for 5%, and other uses, including mobile robots and aerospace actuation, make up 3%. For suppliers, the message is that aftermarket strength sits with industrial arms while design wins increasingly come from lighter platforms.
Automotive Spending Still Sets the Pace for End-Use Demand
Automotive remains the largest end-use industry with 34% share in 2026. Body-in-white welding, powertrain machining and battery module assembly all use dense robot populations, and electric vehicle programmes have added fresh lines rather than replacing old ones. Electronics and semiconductor follows at 26%, supported by fab construction, display handling and surface-mount assembly where repeatability targets are strictest.
Logistics and warehousing grows fastest at a 12.4% CAGR through 2033 from 10% share, as mobile manipulators take on piece picking, depalletising and parcel induction. Metal and machinery holds 17%, healthcare 8%, and other industries 5%. The practical implication is a widening customer base: automotive still sets volume and pricing benchmarks, while warehouse and healthcare buyers reward compact, quiet units with predictable service intervals over outright torque capacity.
Geography Analysis
Which Region Is Growing Fastest in the Precision Reduction Gears Market?
North America grows fastest, at a 10.4% CAGR through 2033, from 16% share in 2026. New semiconductor fabrication plants across Arizona, Texas, Ohio and New York need wafer handling robots and cleanroom-grade reducers with very low particle generation. Reshoring of electronics, medical device and defence production is adding further automation spending. The United States supplies most of the volume, with Canada contributing aerospace and Mexico contributing automotive assembly. Federal manufacturing incentives and tight labour availability both push plants toward robots rather than extra shifts. Warehouse operators are a second engine, since parcel and grocery networks keep buying mobile manipulators. Local machine builders and humanoid robot developers are also designing in regionally sourced actuator modules.
Europe Leans on Machine Tools and Premium Robotics Supply
Europe holds 19% share in 2026 and grows at an 8.4% CAGR through 2033. Germany, Italy, Switzerland and Sweden anchor demand through machine tool building, automotive assembly and a deep base of specialist machine makers. European buyers favour high-accuracy planetary and strain wave units for rotary tables, swivel heads and laboratory automation, where quiet running and long service life matter. Several precision gear manufacturers are headquartered in the region, so local design support and rebuild services are readily available. Energy costs and slower automotive capital spending restrain growth relative to Asia. Machinery safety and ecodesign rules encourage efficient drivetrains and documented service life, which suits precision gearing. Assembly plants in Poland, Czechia and Hungary add steady retrofit volume.
Which Region Is Leading the Precision Reduction Gears Market?
Asia Pacific leads the market with 57% share in 2026 and grows at a 9.9% CAGR through 2033. China installs more industrial robots than any other country and now hosts a large domestic reducer industry supplying local arm builders. Japan remains the technology base for cycloidal and strain wave designs, with deep gear-grinding and heat-treatment expertise. South Korea contributes semiconductor, display and battery equipment demand, while Taiwan supplies machine tools and electronics assembly. India is building robot adoption from a small base in automotive and electronics plants. Government industrial upgrading programmes, dense electronics supply chains and rising wages all favour automation. Local component capacity has also cut lead times and pricing for smaller manufacturers.
Latin America Builds Automation Around Automotive and Food Plants
Latin America holds 5% share in 2026 and grows at an 8.0% CAGR through 2033. Mexico leads, as nearshoring has filled its northern states with automotive, appliance and electronics plants that run robot-based welding and handling cells. Brazil follows, with demand concentrated in vehicle assembly, agricultural machinery and food processing. Growth depends on export orders and currency stability, so capital spending moves in cycles. Most reducers are imported, which lengthens lead times and raises landed cost for local integrators. Automation suppliers are building regional service and spares coverage to shorten repair turnaround, since downtime costs are high in continuous food plants. Technical institutes are slowly widening the pool of trained robot maintenance staff.
Middle East & Africa Automation Follows Industrial Diversification
Middle East & Africa holds 3% share in 2026 and grows at a 7.8% CAGR through 2033. Industrial diversification programmes in Saudi Arabia and the United Arab Emirates are funding new manufacturing zones, logistics hubs and pharmaceutical plants that specify automated handling. Türkiye adds steady demand through automotive and appliance production, while South Africa contributes vehicle assembly and mining equipment work. Warehouse automation in regional distribution hubs is an early adopter of mobile manipulators. The base remains small, because most heavy industry centres on oil, gas and primary materials rather than discrete assembly. Limited local service coverage and a shortage of trained robot technicians slow fleet expansion. Supplier partnerships with regional system integrators are the main adoption route.
Competitive Landscape
The precision reduction gear market is moderately concentrated. A small group of Japanese manufacturers established the cycloidal and strain wave designs that most robot builders still specify, and their long life-test records keep them embedded in qualified platforms. European specialists hold strong positions in precision planetary units for machine tools and laboratory equipment. The most visible structural change is the rise of Chinese suppliers serving domestic arm builders, which has lifted available capacity and narrowed price gaps. Qualification requirements still slow switching, so share moves gradually rather than in sudden shifts.
Competition runs on measurable engineering outcomes rather than marketing claims. Buyers compare transmission accuracy, torsional stiffness, backlash retention over life, efficiency, noise and rated service hours under their own duty cycles. Mass and envelope matter more each year, because collaborative and mobile platforms budget weight joint by joint. Suppliers also compete on how much integration work they absorb, offering pre-assembled actuator modules with motors, brakes, encoders and wiring already aligned. New entrants from the motor and automation sectors matter because they bring volume manufacturing methods to a traditionally craft-based process.
Strategic activity centres on capacity, localisation and design-to-cost engineering. Adding gear-grinding and heat-treatment capacity protects delivery performance when robot schedules rise together, which is a direct competitive advantage during shortages. Placing assembly, spares and rebuild operations near customer clusters shortens lead times and builds service revenue that outlasts the original sale. Research spending is directed at lighter housings, improved lubricants, sensor integration and simplified assembly for high-volume platforms. Partnerships with robot and humanoid developers give suppliers early visibility of joint specifications, which is how long-term platform positions are won.
Industry Leaders
- Nabtesco Corporation
- Harmonic Drive Systems Inc.
- Sumitomo Heavy Industries, Ltd.
- Nidec Corporation
- SEW-EURODRIVE GmbH & Co KG
- WITTENSTEIN SE
- Neugart GmbH
- SPINEA, s.r.o.
Companies Covered in the Report
- Nabtesco Corporation
- Harmonic Drive Systems Inc.
- Harmonic Drive SE
- Sumitomo Heavy Industries, Ltd.
- Nidec Corporation
- SEW-EURODRIVE GmbH & Co KG
- WITTENSTEIN SE
- Neugart GmbH
- SPINEA, s.r.o.
- STOBER Antriebstechnik GmbH & Co. KG
- Apex Dynamics, Inc.
- Framo Morat GmbH & Co. KG
- Cone Drive
- Zhejiang Shuanghuan Driveline Co., Ltd.
- Leaderdrive Co., Ltd.
Precision Reduction Gears Market Report Scope
The market is segmented by product type, rated output torque, application, end-use industry and region.
| By Product Type | RV and Cycloidal Reducers, Strain Wave (Harmonic) Reducers, Precision Planetary Gearboxes, Others |
| By Rated Output Torque | Up to 50 Nm, 50–500 Nm, Above 500 Nm |
| By Application | Industrial Robots, Collaborative Robots, Machine Tools, Semiconductor Equipment, Medical Devices, Others |
| By End-use Industry | Automotive, Electronics and Semiconductor, Metal and Machinery, Logistics and Warehousing, Healthcare, Others |
| By Region | North America, Europe, Asia Pacific, Latin America, Middle East & Africa |
1. Executive Summary
1.1 Global Precision Reduction Gears Market Snapshot
1.2 Future Projections, 2026–2033
1.3 Key Industry Highlights
1.4 Regional Snapshot
2. Market Overview
2.1 Market Definition and Report Scope
2.2 Historical Market Trends
2.3 Market Dynamics
2.3.1 Drivers
2.3.2 Restraints
2.3.3 Market Opportunities
3. Global Precision Reduction Gears Market Outlook, 2026–2033
3.1 Global Precision Reduction Gears Market Outlook, by Product Type, Value (US$ Billion), 2026–2033
3.1.1 RV and Cycloidal Reducers
3.1.2 Strain Wave (Harmonic) Reducers
3.1.3 Precision Planetary Gearboxes
3.1.4 Others
3.2 Global Precision Reduction Gears Market Outlook, by Rated Output Torque, Value (US$ Billion), 2026–2033
3.2.1 Up to 50 Nm
3.2.2 50–500 Nm
3.2.3 Above 500 Nm
3.3 Global Precision Reduction Gears Market Outlook, by Application, Value (US$ Billion), 2026–2033
3.3.1 Industrial Robots
3.3.2 Collaborative Robots
3.3.3 Machine Tools
3.3.4 Semiconductor Equipment
3.3.5 Medical Devices
3.3.6 Others
3.4 Global Precision Reduction Gears Market Outlook, by End-use Industry, Value (US$ Billion), 2026–2033
3.4.1 Automotive
3.4.2 Electronics and Semiconductor
3.4.3 Metal and Machinery
3.4.4 Logistics and Warehousing
3.4.5 Healthcare
3.4.6 Others
3.5 Global Precision Reduction Gears Market Outlook, by Region, Value (US$ Billion), 2026–2033
3.5.1 North America
3.5.2 Europe
3.5.3 Asia Pacific
3.5.4 Latin America
3.5.5 Middle East & Africa
4. North America Precision Reduction Gears Market Outlook, 2026–2033
4.1 North America Precision Reduction Gears Market Outlook, by Product Type, Value (US$ Billion), 2026–2033
4.1.1 RV and Cycloidal Reducers
4.1.2 Strain Wave (Harmonic) Reducers
4.1.3 Precision Planetary Gearboxes
4.1.4 Others
4.2 North America Precision Reduction Gears Market Outlook, by Rated Output Torque, Value (US$ Billion), 2026–2033
4.2.1 Up to 50 Nm
4.2.2 50–500 Nm
4.2.3 Above 500 Nm
4.3 North America Precision Reduction Gears Market Outlook, by Application, Value (US$ Billion), 2026–2033
4.3.1 Industrial Robots
4.3.2 Collaborative Robots
4.3.3 Machine Tools
4.3.4 Semiconductor Equipment
4.3.5 Medical Devices
4.3.6 Others
4.4 North America Precision Reduction Gears Market Outlook, by End-use Industry, Value (US$ Billion), 2026–2033
4.4.1 Automotive
4.4.2 Electronics and Semiconductor
4.4.3 Metal and Machinery
4.4.4 Logistics and Warehousing
4.4.5 Healthcare
4.4.6 Others
4.5 North America Precision Reduction Gears Market Outlook, by Country, Value (US$ Billion), 2026–2033
4.5.1 United States Precision Reduction Gears Market Outlook, by Product Type, 2026–2033
4.5.2 United States Precision Reduction Gears Market Outlook, by Rated Output Torque, 2026–2033
4.5.3 United States Precision Reduction Gears Market Outlook, by Application, 2026–2033
4.5.4 United States Precision Reduction Gears Market Outlook, by End-use Industry, 2026–2033
4.5.5 Canada Precision Reduction Gears Market Outlook, by Product Type, 2026–2033
4.5.6 Canada Precision Reduction Gears Market Outlook, by Rated Output Torque, 2026–2033
4.5.7 Canada Precision Reduction Gears Market Outlook, by Application, 2026–2033
4.5.8 Canada Precision Reduction Gears Market Outlook, by End-use Industry, 2026–2033
4.5.9 Mexico Precision Reduction Gears Market Outlook, by Product Type, 2026–2033
4.5.10 Mexico Precision Reduction Gears Market Outlook, by Rated Output Torque, 2026–2033
4.5.11 Mexico Precision Reduction Gears Market Outlook, by Application, 2026–2033
4.5.12 Mexico Precision Reduction Gears Market Outlook, by End-use Industry, 2026–2033
5. Europe Precision Reduction Gears Market Outlook, 2026–2033
5.1 Europe Precision Reduction Gears Market Outlook, by Product Type, Value (US$ Billion), 2026–2033
5.1.1 RV and Cycloidal Reducers
5.1.2 Strain Wave (Harmonic) Reducers
5.1.3 Precision Planetary Gearboxes
5.1.4 Others
5.2 Europe Precision Reduction Gears Market Outlook, by Rated Output Torque, Value (US$ Billion), 2026–2033
5.2.1 Up to 50 Nm
5.2.2 50–500 Nm
5.2.3 Above 500 Nm
5.3 Europe Precision Reduction Gears Market Outlook, by Application, Value (US$ Billion), 2026–2033
5.3.1 Industrial Robots
5.3.2 Collaborative Robots
5.3.3 Machine Tools
5.3.4 Semiconductor Equipment
5.3.5 Medical Devices
5.3.6 Others
5.4 Europe Precision Reduction Gears Market Outlook, by End-use Industry, Value (US$ Billion), 2026–2033
5.4.1 Automotive
5.4.2 Electronics and Semiconductor
5.4.3 Metal and Machinery
5.4.4 Logistics and Warehousing
5.4.5 Healthcare
5.4.6 Others
5.5 Europe Precision Reduction Gears Market Outlook, by Country, Value (US$ Billion), 2026–2033
5.5.1 Germany Precision Reduction Gears Market Outlook, by Product Type, 2026–2033
5.5.2 Germany Precision Reduction Gears Market Outlook, by Rated Output Torque, 2026–2033
5.5.3 Germany Precision Reduction Gears Market Outlook, by Application, 2026–2033
5.5.4 Germany Precision Reduction Gears Market Outlook, by End-use Industry, 2026–2033
5.5.5 Italy Precision Reduction Gears Market Outlook, by Product Type, 2026–2033
5.5.6 Italy Precision Reduction Gears Market Outlook, by Rated Output Torque, 2026–2033
5.5.7 Italy Precision Reduction Gears Market Outlook, by Application, 2026–2033
5.5.8 Italy Precision Reduction Gears Market Outlook, by End-use Industry, 2026–2033
5.5.9 Switzerland Precision Reduction Gears Market Outlook, by Product Type, 2026–2033
5.5.10 Switzerland Precision Reduction Gears Market Outlook, by Rated Output Torque, 2026–2033
5.5.11 Switzerland Precision Reduction Gears Market Outlook, by Application, 2026–2033
5.5.12 Switzerland Precision Reduction Gears Market Outlook, by End-use Industry, 2026–2033
5.5.13 Sweden Precision Reduction Gears Market Outlook, by Product Type, 2026–2033
5.5.14 Sweden Precision Reduction Gears Market Outlook, by Rated Output Torque, 2026–2033
5.5.15 Sweden Precision Reduction Gears Market Outlook, by Application, 2026–2033
5.5.16 Sweden Precision Reduction Gears Market Outlook, by End-use Industry, 2026–2033
5.5.17 Poland Precision Reduction Gears Market Outlook, by Product Type, 2026–2033
5.5.18 Poland Precision Reduction Gears Market Outlook, by Rated Output Torque, 2026–2033
5.5.19 Poland Precision Reduction Gears Market Outlook, by Application, 2026–2033
5.5.20 Poland Precision Reduction Gears Market Outlook, by End-use Industry, 2026–2033
5.5.21 Czechia Precision Reduction Gears Market Outlook, by Product Type, 2026–2033
5.5.22 Czechia Precision Reduction Gears Market Outlook, by Rated Output Torque, 2026–2033
5.5.23 Czechia Precision Reduction Gears Market Outlook, by Application, 2026–2033
5.5.24 Czechia Precision Reduction Gears Market Outlook, by End-use Industry, 2026–2033
5.5.25 Hungary Precision Reduction Gears Market Outlook, by Product Type, 2026–2033
5.5.26 Hungary Precision Reduction Gears Market Outlook, by Rated Output Torque, 2026–2033
5.5.27 Hungary Precision Reduction Gears Market Outlook, by Application, 2026–2033
5.5.28 Hungary Precision Reduction Gears Market Outlook, by End-use Industry, 2026–2033
6. Asia Pacific Precision Reduction Gears Market Outlook, 2026–2033
6.1 Asia Pacific Precision Reduction Gears Market Outlook, by Product Type, Value (US$ Billion), 2026–2033
6.1.1 RV and Cycloidal Reducers
6.1.2 Strain Wave (Harmonic) Reducers
6.1.3 Precision Planetary Gearboxes
6.1.4 Others
6.2 Asia Pacific Precision Reduction Gears Market Outlook, by Rated Output Torque, Value (US$ Billion), 2026–2033
6.2.1 Up to 50 Nm
6.2.2 50–500 Nm
6.2.3 Above 500 Nm
6.3 Asia Pacific Precision Reduction Gears Market Outlook, by Application, Value (US$ Billion), 2026–2033
6.3.1 Industrial Robots
6.3.2 Collaborative Robots
6.3.3 Machine Tools
6.3.4 Semiconductor Equipment
6.3.5 Medical Devices
6.3.6 Others
6.4 Asia Pacific Precision Reduction Gears Market Outlook, by End-use Industry, Value (US$ Billion), 2026–2033
6.4.1 Automotive
6.4.2 Electronics and Semiconductor
6.4.3 Metal and Machinery
6.4.4 Logistics and Warehousing
6.4.5 Healthcare
6.4.6 Others
6.5 Asia Pacific Precision Reduction Gears Market Outlook, by Country, Value (US$ Billion), 2026–2033
6.5.1 China Precision Reduction Gears Market Outlook, by Product Type, 2026–2033
6.5.2 China Precision Reduction Gears Market Outlook, by Rated Output Torque, 2026–2033
6.5.3 China Precision Reduction Gears Market Outlook, by Application, 2026–2033
6.5.4 China Precision Reduction Gears Market Outlook, by End-use Industry, 2026–2033
6.5.5 Japan Precision Reduction Gears Market Outlook, by Product Type, 2026–2033
6.5.6 Japan Precision Reduction Gears Market Outlook, by Rated Output Torque, 2026–2033
6.5.7 Japan Precision Reduction Gears Market Outlook, by Application, 2026–2033
6.5.8 Japan Precision Reduction Gears Market Outlook, by End-use Industry, 2026–2033
6.5.9 South Korea Precision Reduction Gears Market Outlook, by Product Type, 2026–2033
6.5.10 South Korea Precision Reduction Gears Market Outlook, by Rated Output Torque, 2026–2033
6.5.11 South Korea Precision Reduction Gears Market Outlook, by Application, 2026–2033
6.5.12 South Korea Precision Reduction Gears Market Outlook, by End-use Industry, 2026–2033
6.5.13 Taiwan Precision Reduction Gears Market Outlook, by Product Type, 2026–2033
6.5.14 Taiwan Precision Reduction Gears Market Outlook, by Rated Output Torque, 2026–2033
6.5.15 Taiwan Precision Reduction Gears Market Outlook, by Application, 2026–2033
6.5.16 Taiwan Precision Reduction Gears Market Outlook, by End-use Industry, 2026–2033
6.5.17 India Precision Reduction Gears Market Outlook, by Product Type, 2026–2033
6.5.18 India Precision Reduction Gears Market Outlook, by Rated Output Torque, 2026–2033
6.5.19 India Precision Reduction Gears Market Outlook, by Application, 2026–2033
6.5.20 India Precision Reduction Gears Market Outlook, by End-use Industry, 2026–2033
7. Latin America Precision Reduction Gears Market Outlook, 2026–2033
7.1 Latin America Precision Reduction Gears Market Outlook, by Product Type, Value (US$ Billion), 2026–2033
7.1.1 RV and Cycloidal Reducers
7.1.2 Strain Wave (Harmonic) Reducers
7.1.3 Precision Planetary Gearboxes
7.1.4 Others
7.2 Latin America Precision Reduction Gears Market Outlook, by Rated Output Torque, Value (US$ Billion), 2026–2033
7.2.1 Up to 50 Nm
7.2.2 50–500 Nm
7.2.3 Above 500 Nm
7.3 Latin America Precision Reduction Gears Market Outlook, by Application, Value (US$ Billion), 2026–2033
7.3.1 Industrial Robots
7.3.2 Collaborative Robots
7.3.3 Machine Tools
7.3.4 Semiconductor Equipment
7.3.5 Medical Devices
7.3.6 Others
7.4 Latin America Precision Reduction Gears Market Outlook, by End-use Industry, Value (US$ Billion), 2026–2033
7.4.1 Automotive
7.4.2 Electronics and Semiconductor
7.4.3 Metal and Machinery
7.4.4 Logistics and Warehousing
7.4.5 Healthcare
7.4.6 Others
7.5 Latin America Precision Reduction Gears Market Outlook, by Country, Value (US$ Billion), 2026–2033
7.5.1 Mexico Precision Reduction Gears Market Outlook, by Product Type, 2026–2033
7.5.2 Mexico Precision Reduction Gears Market Outlook, by Rated Output Torque, 2026–2033
7.5.3 Mexico Precision Reduction Gears Market Outlook, by Application, 2026–2033
7.5.4 Mexico Precision Reduction Gears Market Outlook, by End-use Industry, 2026–2033
7.5.5 Brazil Precision Reduction Gears Market Outlook, by Product Type, 2026–2033
7.5.6 Brazil Precision Reduction Gears Market Outlook, by Rated Output Torque, 2026–2033
7.5.7 Brazil Precision Reduction Gears Market Outlook, by Application, 2026–2033
7.5.8 Brazil Precision Reduction Gears Market Outlook, by End-use Industry, 2026–2033
8. Middle East & Africa Precision Reduction Gears Market Outlook, 2026–2033
8.1 Middle East & Africa Precision Reduction Gears Market Outlook, by Product Type, Value (US$ Billion), 2026–2033
8.1.1 RV and Cycloidal Reducers
8.1.2 Strain Wave (Harmonic) Reducers
8.1.3 Precision Planetary Gearboxes
8.1.4 Others
8.2 Middle East & Africa Precision Reduction Gears Market Outlook, by Rated Output Torque, Value (US$ Billion), 2026–2033
8.2.1 Up to 50 Nm
8.2.2 50–500 Nm
8.2.3 Above 500 Nm
8.3 Middle East & Africa Precision Reduction Gears Market Outlook, by Application, Value (US$ Billion), 2026–2033
8.3.1 Industrial Robots
8.3.2 Collaborative Robots
8.3.3 Machine Tools
8.3.4 Semiconductor Equipment
8.3.5 Medical Devices
8.3.6 Others
8.4 Middle East & Africa Precision Reduction Gears Market Outlook, by End-use Industry, Value (US$ Billion), 2026–2033
8.4.1 Automotive
8.4.2 Electronics and Semiconductor
8.4.3 Metal and Machinery
8.4.4 Logistics and Warehousing
8.4.5 Healthcare
8.4.6 Others
8.5 Middle East & Africa Precision Reduction Gears Market Outlook, by Country, Value (US$ Billion), 2026–2033
8.5.1 Saudi Arabia Precision Reduction Gears Market Outlook, by Product Type, 2026–2033
8.5.2 Saudi Arabia Precision Reduction Gears Market Outlook, by Rated Output Torque, 2026–2033
8.5.3 Saudi Arabia Precision Reduction Gears Market Outlook, by Application, 2026–2033
8.5.4 Saudi Arabia Precision Reduction Gears Market Outlook, by End-use Industry, 2026–2033
8.5.5 United Arab Emirates Precision Reduction Gears Market Outlook, by Product Type, 2026–2033
8.5.6 United Arab Emirates Precision Reduction Gears Market Outlook, by Rated Output Torque, 2026–2033
8.5.7 United Arab Emirates Precision Reduction Gears Market Outlook, by Application, 2026–2033
8.5.8 United Arab Emirates Precision Reduction Gears Market Outlook, by End-use Industry, 2026–2033
8.5.9 Türkiye Precision Reduction Gears Market Outlook, by Product Type, 2026–2033
8.5.10 Türkiye Precision Reduction Gears Market Outlook, by Rated Output Torque, 2026–2033
8.5.11 Türkiye Precision Reduction Gears Market Outlook, by Application, 2026–2033
8.5.12 Türkiye Precision Reduction Gears Market Outlook, by End-use Industry, 2026–2033
8.5.13 South Africa Precision Reduction Gears Market Outlook, by Product Type, 2026–2033
8.5.14 South Africa Precision Reduction Gears Market Outlook, by Rated Output Torque, 2026–2033
8.5.15 South Africa Precision Reduction Gears Market Outlook, by Application, 2026–2033
8.5.16 South Africa Precision Reduction Gears Market Outlook, by End-use Industry, 2026–2033
9. Competitive Landscape
9.1 Industry Leaders
9.2 Company Profiles
9.2.1 Nabtesco Corporation
9.2.2 Harmonic Drive Systems Inc.
9.2.3 Harmonic Drive SE
9.2.4 Sumitomo Heavy Industries, Ltd.
9.2.5 Nidec Corporation
9.2.6 SEW-EURODRIVE GmbH & Co KG
9.2.7 WITTENSTEIN SE
9.2.8 Neugart GmbH
9.2.9 SPINEA, s.r.o.
9.2.10 STOBER Antriebstechnik GmbH & Co. KG
9.2.11 Apex Dynamics, Inc.
9.2.12 Framo Morat GmbH & Co. KG
9.2.13 Cone Drive
9.2.14 Zhejiang Shuanghuan Driveline Co., Ltd.
9.2.15 Leaderdrive Co., Ltd.
10. Appendix
10.1 Research Methodology
10.2 Report Assumptions
10.3 Acronyms and Abbreviations
| By Product Type | RV and Cycloidal Reducers, Strain Wave (Harmonic) Reducers, Precision Planetary Gearboxes, Others |
| By Rated Output Torque | Up to 50 Nm, 50–500 Nm, Above 500 Nm |
| By Application | Industrial Robots, Collaborative Robots, Machine Tools, Semiconductor Equipment, Medical Devices, Others |
| By End-use Industry | Automotive, Electronics and Semiconductor, Metal and Machinery, Logistics and Warehousing, Healthcare, Others |
| By Region | North America, Europe, Asia Pacific, Latin America, Middle East & Africa |
Our Research Methodology
Considering the volatility of business today, traditional approaches to strategizing a game plan can be unfruitful if not detrimental. True ambiguity is no way to determine a forecast. A myriad of predetermined factors must be accounted for such as the degree of risk involved, the magnitude of circumstances, as well as conditions or consequences that are not known or unpredictable. To circumvent binary views that cast uncertainty, the application of market research intelligence to strategically posture, move, and enable actionable outcomes is necessary.
View Methodology
Quality Assured
Rigorous Validation Process

Confidentiality Assured
End-to-end Data Security

Custom Research Services
Tailored To Your Objectives
FAQs
The market is valued at US$ 3.4 billion in 2026 and is projected to reach US$ 6.46 billion by 2033, adding US$ 3.06 billion.
The market is projected to grow at a 9.6% CAGR between 2026 and 2033, supported by robot installations, collaborative arms and semiconductor equipment demand.
RV and cycloidal reducers hold 44% share in 2026, because their stiffness and shock tolerance suit the base joints of articulated industrial robots.
Asia Pacific leads with 57% share in 2026, driven by robot installations in China, component expertise in Japan and equipment demand in South Korea.
Related Reports
Pre-Engineered Buildings Market Size, Share, Insights, Competitive Landscape, and Forecast 2026 to 2033
The pre-engineered buildings market is projected to grow from US$22.4 billion in 2026 to US$43.1 billion by 2033 at a 9.8% CAGR.
Pleated Filters Market Size, Share, Insights, Competitive Landscape, and Forecast 2026 to 2033
The pleated filters market is projected to grow from US$4.8 billion in 2026 to US$7.6 billion by 2033 at a 6.8% CAGR.
Machine Automation Controller Market Size, Share, Insights, Competitive Landscape, and Forecast 2026 to 2033
The global machine automation controller market is valued at US$2.4 billion in 2026, reaching US$4.5 billion by 2033, growing at a 9.4% CAGR
Lined Valve Market Size, Share, Insights, Competitive Landscape, and Forecast 2026 to 2033
The global lined valve market is valued at US$2.8 billion in 2026, reaching US$4.1 billion by 2033, growing at a 5.6% CAGR
Hydraulic Intensifiers Market Size, Share, Insights, Competitive Landscape, and Forecast 2026 to 2033
The global hydraulic intensifiers market is valued at US$1.28 billion in 2026, reaching US$1.92 billion by 2033, growing at a 6.0% CAGR
Dual Chamber Syringe Filling Machine Market Size, Share, Insights, Competitive Landscape, and Forecast 2026 to 2033
The dual chamber syringe filling machine market is projected to grow from US$430 million in 2026 to US$771 million by 2033 at an 8.7% CAGR.