



Precision Medicine Software Market
Precision Medicine Software Market Size, Share, Insights, Competitive Landscape, and Forecast 2026 to 2033
What Is Driving Growth in Precision Medicine Software?
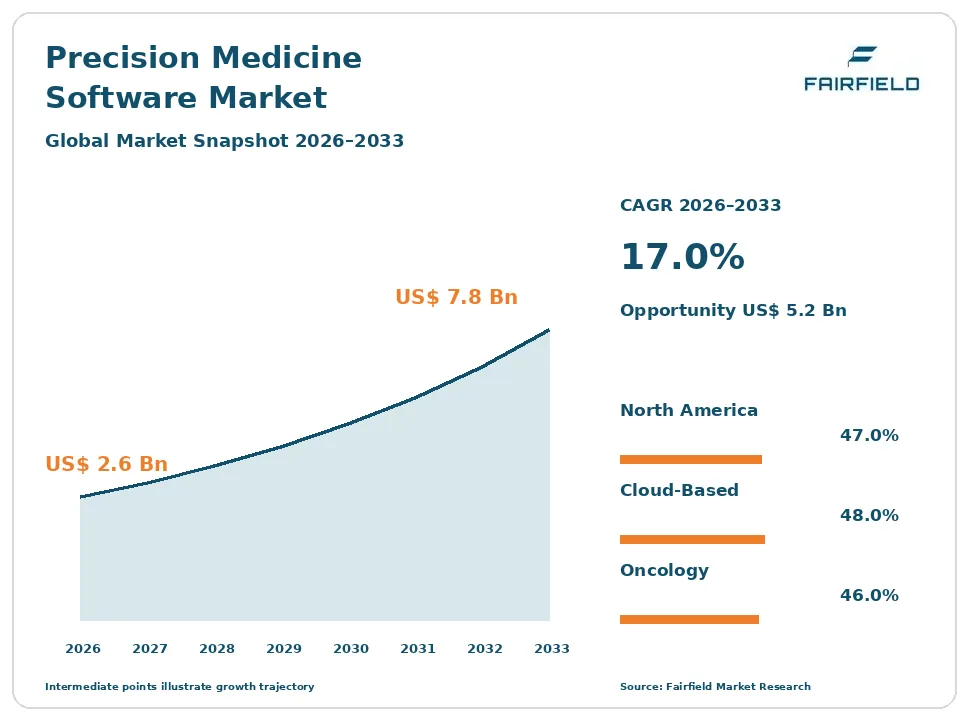
The global Precision Medicine Software market size is expected to be valued at US$ 2.6 billion in 2026 and projected to reach US$ 7.8 billion by 2033, growing at a CAGR of 17.0% between 2026 and 2033.
The market grew at an estimated 16.4% CAGR between 2020 and 2025 as sequencing moved from research into routine clinical laboratories. Growth now rests on a single structural fact: sequencing cost has fallen far faster than the cost of deciding what a variant means. Three factors follow from that. Comprehensive genomic profiling in oncology keeps raising the volume of variants needing classification. Hereditary and carrier testing has broadened the germline caseload. National genomic medicine programmes have committed public budgets to clinical-grade interpretation infrastructure. The direction of the market is toward consolidated platforms that carry secondary analysis, curated evidence, interpretation and reporting in one validated chain, because laboratories can no longer assemble that chain from scripts.
Key Report Takeaways
- By Software Type: Tertiary Analysis and Interpretation held 34% share in 2026, while Multi-Omic Data Management is projected to expand at a 20.1% CAGR through 2033, as laboratories combine genomic, transcriptomic and proteomic evidence in one case record.
- By Delivery Model: Cloud-Based held 48% share in 2026, while Hybrid is projected to expand at a 19.4% CAGR through 2033, because data residency rules force some institutions to keep raw sequence files inside national borders.
- By Application: Oncology held 46% share in 2026, while Pharmacogenomics is projected to expand at a 20.8% CAGR through 2033, as prescribing systems begin carrying drug-gene alerts for whole patient populations.
- By End User: Clinical Laboratories and Pathology Services held 38% share in 2026, while Biopharmaceutical and Translational Research is projected to expand at a 19.2% CAGR through 2033, driven by demand for structured molecular evidence from trials.
- By Geography: North America held 47% share in 2026, while Asia Pacific is projected to expand at a 20.6% CAGR through 2033, supported by national population genomics programmes and new clinical sequencing capacity.
Global Precision Medicine Software Market Trends and Insights
Drivers Impact Analysis
| Driver | Impact on CAGR Forecast | Geographic Relevance | Impact Timeline |
| Growth of comprehensive genomic profiling in oncology | High | North America, Europe, Asia Pacific | Short term ≤2 years |
| National genomic medicine programmes and wider hereditary testing | High | Europe, Asia Pacific, North America | Medium term 2–4 years |
Both principal drivers increase the number of variants that must be classified and reported to a clinical standard.
Comprehensive Genomic Profiling in Oncology Multiplies the Interpretation Workload in Precision Medicine Software
Comprehensive genomic profiling is the largest single source of demand, because each case produces thousands of candidate variants that a laboratory must filter, classify and report. Tumour testing has moved from single-gene assays to large panels, exomes and whole genomes, and increasingly to paired tumour-normal designs that add germline findings. Every expansion of panel content multiplies the interpretation workload without adding analyst headcount, which is precisely the gap this software fills.
The mechanism is evidence curation. A reportable result requires matching a variant to published functional studies, population frequency databases, guideline statements and open trials, then documenting the reasoning. The American College of Medical Genetics and Genomics and the Association for Molecular Pathology variant classification framework defines how that reasoning must be structured, and software exists largely to execute it reproducibly across thousands of cases.
National Genomic Medicine Programmes and Broader Hereditary Testing Industrialise Germline Interpretation
Publicly funded genomic medicine programmes have converted interpretation from a research activity into a procured service. When a national health system commits to sequencing defined patient groups, it must also commit to classifying findings consistently, storing them durably and re-evaluating them as evidence changes. That recurring reanalysis obligation is a software requirement rather than a staffing one, and it creates multi-year contracts rather than one-off licences.
Germline volumes reinforce this. Hereditary cancer, cardiac and rare disease panels have widened, carrier screening has expanded in reproductive care, and newborn sequencing pilots are running in several systems. The Global Alliance for Genomics and Health standards and HL7 FHIR Genomics profiles give these programmes a way to exchange results between institutions, which makes centralised knowledge bases usable far beyond the laboratory that generated the data.
Restraints Impact Analysis
| Restraint | Impact on CAGR Forecast | Geographic Relevance | Impact Timeline |
| Variants of uncertain significance and the cost of evidence curation | High | Global | Long term ≥4 years |
| Uneven reimbursement and fragmented knowledge bases | Medium | North America, Europe, Latin America | Medium term 2–4 years |
The binding constraints are interpretive and economic, not computational.
Variants of Uncertain Significance Remain the Central Bottleneck for Precision Medicine Software
Variants of uncertain significance are the defining problem of this market, and they limit what any software can deliver. A large share of findings in broad panels cannot be classified as pathogenic or benign with the available evidence, so they are reported as uncertain, cannot guide care, and often trigger further testing of family members. Software can standardise and speed the classification process, but it cannot create evidence that does not exist.
The cost sits in curation labour. Keeping a knowledge base current means reading new functional studies, tracking population frequency updates, following guideline revisions and re-scoring affected variants, all performed by scientists qualified to the standard that accreditation requires. Revision of the American College of Medical Genetics and Genomics and Association for Molecular Pathology framework forces periodic reclassification across the whole historical case archive, which is expensive and unavoidable.
Uneven Reimbursement and Fragmented Knowledge Bases Constrain Precision Medicine Software Budgets
Reimbursement for comprehensive genomic profiling varies sharply by payer, indication and country, and that variability caps what laboratories can spend on interpretation software. Where a broad panel is reimbursed only for selected advanced cancers, test volumes stay low and the fixed cost of a validated software stack is hard to recover. Laboratories respond by building partial solutions in house, which slows commercial adoption and fragments the installed base.
Knowledge fragmentation adds a second cost. Evidence sits across public variant databases, commercial knowledge bases, guideline bodies and institutional archives, each with different curation rules and update cycles. Reconciling conflicting classifications requires manual review. Sharing case-level molecular data between institutions is further constrained by consent terms and privacy law, so the aggregated evidence that would resolve uncertain variants accumulates slowly.
Market Opportunities
Liquid Biopsy and Minimal Residual Disease Monitoring Create Longitudinal Revenue in Precision Medicine Software
Liquid biopsy converts molecular testing from a single event into a repeated one, and that is the most attractive new revenue pool in this market. Monitoring circulating tumour DNA for minimal residual disease means serial samples from the same patient over months or years, each requiring ultra-sensitive variant detection, background noise modelling, tumour-informed assay design and trend reporting rather than a static classification. Recurring testing supports recurring software revenue.
Capture requires capabilities most tertiary analysis tools lack: patient-level longitudinal data models, personalised assay tracking, quantitative reporting of variant allele fractions and integration with oncology records so clinicians see change over time. Cancer centres and reference laboratories generate the demand, and biopharmaceutical sponsors using molecular response as a trial endpoint reinforce it. Vendors with validated secondary analysis pipelines and clinical reporting are best positioned.
Real-World Molecular Evidence and Multi-Omic Integration Open a Biopharmaceutical Revenue Pool
Structured molecular data from routine care has become a saleable asset, and the software that organises it captures part of that value. Biopharmaceutical companies need cohorts defined by genotype to size indications, select trial sites, support regulatory submissions and monitor post-approval performance. Laboratories and health systems hold that data but cannot deliver it in analysable form, so platforms that harmonise variants, clinical outcomes and treatment histories open a second revenue stream alongside licences.
Translational research groups inside biopharmaceutical companies are the buyer, and companion diagnostic development is the clearest use case. Multi-omic integration extends the pool further, since transcriptomic, proteomic and methylation data increasingly accompany sequence data in both trials and advanced diagnostics. Global Alliance for Genomics and Health data-exchange standards and federated analysis models make cross-institution cohorts feasible without moving raw files.
Segment Analysis
By Software Type: Tertiary Analysis and Interpretation Leads While Multi-Omic Data Management Accelerates
Tertiary Analysis and Interpretation held 34% of revenue in 2026, the largest share because this is where the scarce resource sits: translating a filtered variant list into a classified, evidence-backed, reportable result. Secondary Analysis and Variant Calling is increasingly commoditised and often bundled with sequencing instruments, while Clinical Reporting and Knowledge Bases and Laboratory Information Management carry steady accreditation-driven demand. Multi-Omic Data Management is the fastest-expanding type at a 20.1% CAGR through 2033. Laboratories and cancer centres now attach transcriptomic, proteomic and methylation data to genomic cases, and storage, harmonisation and query across those layers is a separate engineering problem. For vendors, the implication is that defensibility is moving from pipeline speed toward curated evidence depth and the ability to hold heterogeneous molecular data in one auditable record.
By Delivery Model: Cloud-Based Deployment Dominates as Hybrid Architectures Gain Ground
Cloud-Based delivery accounted for 48% of the market in 2026, because sequence files are large, compute demand is bursty, and laboratories prefer not to maintain high-performance infrastructure or validate every pipeline update themselves. On-Premise remains substantial in national reference laboratories and in institutions with strict internal controls. Hybrid is the fastest-growing model at a 19.4% CAGR to 2033. Data residency rules, hospital security policy and public-sector procurement terms increasingly require raw sequence data to stay inside a national or institutional boundary while permitting curated knowledge bases and software updates to be consumed as a service. Vendors that can split a validated pipeline across local and hosted components without revalidating the whole chain win tenders that pure cloud suppliers cannot bid for, which is reshaping product architecture across the market.
By Application: Oncology Holds the Largest Share While Pharmacogenomics Expands Quickest
Oncology represented 46% of application demand in 2026, reflecting the scale of tumour profiling, the number of genotype-linked therapies and the complexity of somatic interpretation, which is harder to automate than germline work. Hereditary and Rare Disease follows, supported by diagnostic odyssey programmes and family cascade testing, with Reproductive and Carrier Screening and Infectious Disease applications adding further volume. Pharmacogenomics is the fastest-growing application at a 20.8% CAGR through 2033. Several health systems are moving from reactive single-gene testing toward pre-emptive panels whose results sit in the record and trigger drug-gene alerts at prescribing. That shift turns pharmacogenomics into an enterprise software requirement rather than a laboratory one, and it broadens the buyer base well beyond molecular pathology departments.
By End User: Clinical Laboratories Lead While Biopharmaceutical and Translational Research Grows Fastest
Clinical Laboratories and Pathology Services accounted for 38% of demand in 2026, because accreditation obliges them to run validated, documented and traceable interpretation processes for every reported result. Hospitals and Cancer Centres follow, buying molecular tumour board software and reporting tools that connect laboratory output to treatment decisions, while Academic and Government Research supports discovery-stage work and national programmes. Biopharmaceutical and Translational Research is the fastest-expanding end user at a 19.2% CAGR to 2033. Sponsors need structured molecular data for biomarker strategy, companion diagnostic development, trial enrichment and regulatory evidence, and they pay for curation quality rather than throughput. For vendors this creates a higher-margin segment whose procurement cycles, contract sizes and validation expectations differ markedly from routine laboratory sales, and it rewards suppliers able to serve both audiences from one evidence base.
Geography Analysis
Which Region Is Leading the Precision Medicine Software Market?
North America leads the precision medicine software market with 47% share in 2026, because the United States has the largest installed base of clinical sequencing capacity and the deepest commercial molecular laboratory sector. Laboratory accreditation sets the operating frame: CLIA certification and College of American Pathologists accreditation require documented analytical validation, version control and reproducible interpretation, which pushes laboratories toward commercial software rather than internal scripts. The regulatory position of laboratory developed tests remains contested after litigation, and that uncertainty has made auditable workflows a priority regardless of the outcome. Large cancer centre networks, well-funded academic programmes and private payer coverage for selected profiling indications sustain volume. Canada adds provincial genomic programmes. The main change ahead is consolidation of fragmented regional laboratories into networks that standardise on a single interpretation platform.
Europe Links Precision Medicine Software Demand to Diagnostic Regulation and National Genome Programmes
Europe holds 25% of the market in 2026, led by the United Kingdom, Germany, France, the Netherlands, Spain and the Nordic countries. The distinctive driver is regulatory. The In Vitro Diagnostic Regulation reclassified most molecular diagnostics into higher risk classes and set conditions on in-house devices used by health institutions, which obliges laboratories to document performance and justify assays far more rigorously than before. That documentation burden converts directly into software demand. National genome initiatives and rare disease programmes supply steady public funding, and several countries have built centralised interpretation infrastructure shared across hospitals. Constraints are real: notified body capacity is limited, procurement is slow, and the General Data Protection Regulation restricts cross-border sharing of case-level molecular data without careful legal structuring.
Which Region Is Growing Fastest in the Precision Medicine Software Market?
Asia Pacific is the fastest-growing geography at a 20.6% CAGR between 2026 and 2033, from a 20% share in 2026. China, Japan, India, Australia, Singapore and the Republic of Korea drive the expansion. Three conditions explain it. Sequencing capacity has been built quickly and recently, so laboratories are selecting interpretation platforms for the first time rather than replacing legacy systems. Population genomics initiatives in several countries fund reference data that improves classification for ancestries historically under-represented in public variant databases. Cancer incidence is rising with ageing populations, which lifts tumour profiling volumes. Local data residency requirements favour vendors offering in-country hosting, and domestic suppliers have gained share by curating evidence relevant to regional populations and prescribing practice.
Latin America Builds Molecular Capacity Through Private Laboratory Networks
Latin America represents 5% of the market in 2026, with Brazil, Mexico, Argentina, Chile and Colombia accounting for most activity. Growth is led by private laboratory groups and private oncology networks that have invested in sequencing to compete on turnaround time, while public systems rely heavily on send-out testing to reference laboratories abroad. Barriers are concentrated in funding and workforce: reimbursement for comprehensive profiling is limited, foreign-currency software contracts are difficult to approve, and trained clinical bioinformaticians and variant scientists are scarce. Regional ancestry is also under-represented in public frequency databases, which raises uncertain-variant rates. The clearest opportunity is shared regional interpretation infrastructure, which lets smaller laboratories access curated evidence without building their own scientific curation teams.
Middle East & Africa Growth Concentrates in Gulf Population Genomics Investment
Middle East & Africa holds 3% of the market in 2026, and demand is unusually concentrated in a few national programmes. Saudi Arabia, the United Arab Emirates, Qatar and Israel fund population genomics and newborn screening initiatives as state infrastructure, which creates large, centrally procured contracts rather than many small laboratory sales. High rates of consanguinity in parts of the region make rare recessive disease a public health priority and give hereditary interpretation particular value. Elsewhere on the continent, sequencing capacity is thin, clinical genetics workforces are very small, and public budgets constrain adoption, though South Africa, Egypt and Nigeria have active academic programmes. Data sovereignty rules requiring national hosting are the main architectural constraint shaping vendor selection.
Competitive Landscape
The precision medicine software market is moderately concentrated and unusually layered. Sequencing instrument suppliers hold strong positions in secondary analysis because pipelines ship with the platform, while a separate group of specialists competes in tertiary interpretation, curated knowledge bases and clinical reporting, where the differentiator is scientific content rather than code. Laboratory information management is a third layer with its own established suppliers. Consolidation has been steady, with interpretation specialists absorbed into larger diagnostics and informatics groups seeking to own the chain from raw reads to signed report, and a long tail of regional vendors persists because curation relevant to local populations and reimbursement rules is hard to centralise.
Competition turns on evidence depth, auditability and workflow fit rather than algorithmic novelty. Buyers evaluate how many variants a knowledge base classifies, how transparently each classification is supported, how quickly guideline revisions propagate, and whether the system produces a report that satisfies accreditation review without manual rework. Validation effort is a real switching cost, so incumbency is durable once a laboratory has qualified a pipeline. New entrants attack narrow positions, typically automated evidence extraction from literature, pharmacogenomics alerting inside prescribing systems, or molecular tumour board collaboration tools, where they can demonstrate value without displacing the core pipeline.
Strategic activity concentrates on assembling complete chains. Suppliers are combining secondary analysis, curated content, reporting and data management, adding pharmacogenomics modules, and building federated architectures that allow cohort analysis without moving raw sequence files between institutions.
Vendor direction is converging on four themes: deeper curated evidence as the primary asset, regulatory-grade documentation built into the product, deployment flexibility for data residency, and monetising aggregated molecular data for biopharmaceutical customers.
Precision Medicine Software Industry Leaders
- Illumina
- QIAGEN
- Thermo Fisher Scientific
- F. Hoffmann-La Roche
- SOPHiA GENETICS
Recent Industry Developments
- May 2024: The United States Food and Drug Administration published a final rule bringing laboratory developed tests within its device framework through a phased withdrawal of enforcement discretion – it pushed molecular laboratories toward documented, auditable interpretation workflows.
- July 2024: The European Union adopted an amending regulation extending the transitional periods of the In Vitro Diagnostic Regulation and introducing notification duties for in-house devices – it gave laboratories more time while confirming that in-house assays must be formally justified and documented.
- March 2025: A United States federal district court vacated the Food and Drug Administration final rule on laboratory developed tests, leaving the regulatory position contested – it restored short-term flexibility but left laboratories planning for eventual tightening.
Companies Covered in the Report
- Illumina
- QIAGEN
- Thermo Fisher Scientific
- F. Hoffmann-La Roche
- SOPHiA GENETICS
- Velsera
- Fabric Genomics
- Congenica
- Genoox
- DNAnexus
- Clinisys
- LabVantage Solutions
Precision Medicine Software Market Report Scope
This study covers the molecular data layer: secondary and tertiary genomic analysis, variant annotation and classification, clinical interpretation and reporting, knowledge bases, molecular tumour board tools, biomarker and companion diagnostic workflow, pharmacogenomics decision support, genomics laboratory information management and multi-omic data management. Enterprise clinical and administrative artificial intelligence is covered separately in the healthcare cognitive computing study. The base year is 2025, the forecast period is 2026 to 2033, and values are in US$ Billion.
Software Type
- Secondary Analysis and Variant Calling
- Tertiary Analysis and Interpretation
- Clinical Reporting and Knowledge Bases
- Laboratory Information Management
- Multi-Omic Data Management
Delivery Model
- Cloud-Based
- On-Premise
- Hybrid
Application
- Oncology
- Hereditary and Rare Disease
- Pharmacogenomics
- Reproductive and Carrier Screening
- Infectious Disease
End User
- Clinical Laboratories and Pathology Services
- Hospitals and Cancer Centres
- Biopharmaceutical and Translational Research
- Academic and Government Research
Regions
- North America
- Europe
- Asia Pacific
- Latin America
- Middle East & Africa
Key Questions Answered in the Report
How big is the precision medicine software market in 2026?
The market is valued at US$ 2.6 billion in 2026, covering genomic analysis, interpretation, reporting, knowledge bases and molecular data management software sold to laboratories and research groups.
What is the forecast size and growth rate to 2033?
The market is projected to reach US$ 7.8 billion by 2033 at a 17.0% CAGR, representing an absolute dollar opportunity of US$ 5.2 billion over the forecast period.
Which software type leads the precision medicine software market?
Tertiary Analysis and Interpretation leads with 34% share in 2026, because classifying variants against curated evidence is the scarcest and most valuable step.
Which application and region are growing fastest?
Pharmacogenomics is the fastest-growing application at a 20.8% CAGR, while Asia Pacific is the fastest-expanding geography at a 20.6% CAGR through 2033.
Which region leads and how concentrated is the market?
North America leads with 47% share in 2026, and concentration is medium, with instrument suppliers, interpretation specialists and laboratory informatics vendors occupying distinct layers.
1. Executive Summary
1.1. Global Precision Medicine Software Market Snapshot
1.2. Future Projections
1.3. Key Report Takeaways
1.4. Regional Snapshot
2. Market Overview
2.1. Market Definition and Report Scope
2.2. Historical Trends 2020–2025
2.3. Market Dynamics
2.3.1. Drivers
2.3.1.1. Comprehensive Genomic Profiling in Oncology Multiplies the Interpretation Workload in Precision Medicine Software
2.3.1.2. National Genomic Medicine Programmes and Broader Hereditary Testing Industrialise Germline Interpretation
2.3.2. Restraints
2.3.2.1. Variants of Uncertain Significance Remain the Central Bottleneck for Precision Medicine Software
2.3.2.2. Uneven Reimbursement and Fragmented Knowledge Bases Constrain Precision Medicine Software Budgets
2.3.3. Market Opportunities
2.3.3.1. Liquid Biopsy and Minimal Residual Disease Monitoring Create Longitudinal Revenue in Precision Medicine Software
2.3.3.2. Real-World Molecular Evidence and Multi-Omic Integration Open a Biopharmaceutical Revenue Pool
3. Global Precision Medicine Software Market Outlook, 2020–2033
3.1. Global Precision Medicine Software Market Outlook, by Software Type, Value (US$ Billion), 2020–2033
3.1.1. Secondary Analysis and Variant Calling
3.1.2. Tertiary Analysis and Interpretation
3.1.3. Clinical Reporting and Knowledge Bases
3.1.4. Laboratory Information Management
3.1.5. Multi-Omic Data Management
3.2. Global Precision Medicine Software Market Outlook, by Delivery Model, Value (US$ Billion), 2020–2033
3.2.1. Cloud-Based
3.2.2. On-Premise
3.2.3. Hybrid
3.3. Global Precision Medicine Software Market Outlook, by Application, Value (US$ Billion), 2020–2033
3.3.1. Oncology
3.3.2. Hereditary and Rare Disease
3.3.3. Pharmacogenomics
3.3.4. Reproductive and Carrier Screening
3.3.5. Infectious Disease
3.4. Global Precision Medicine Software Market Outlook, by End User, Value (US$ Billion), 2020–2033
3.4.1. Clinical Laboratories and Pathology Services
3.4.2. Hospitals and Cancer Centres
3.4.3. Biopharmaceutical and Translational Research
3.4.4. Academic and Government Research
3.5. Global Precision Medicine Software Market Outlook, by Region, Value (US$ Billion), 2020–2033
3.5.1. North America
3.5.2. Europe
3.5.3. Asia Pacific
3.5.4. Latin America
3.5.5. Middle East & Africa
4. North America Precision Medicine Software Market Outlook, 2020–2033
4.1. North America Precision Medicine Software Market Outlook, by Software Type, Value (US$ Billion), 2020–2033
4.1.1. Secondary Analysis and Variant Calling
4.1.2. Tertiary Analysis and Interpretation
4.1.3. Clinical Reporting and Knowledge Bases
4.1.4. Laboratory Information Management
4.1.5. Multi-Omic Data Management
4.2. North America Precision Medicine Software Market Outlook, by Delivery Model, Value (US$ Billion), 2020–2033
4.2.1. Cloud-Based
4.2.2. On-Premise
4.2.3. Hybrid
4.3. North America Precision Medicine Software Market Outlook, by Application, Value (US$ Billion), 2020–2033
4.3.1. Oncology
4.3.2. Hereditary and Rare Disease
4.3.3. Pharmacogenomics
4.3.4. Reproductive and Carrier Screening
4.3.5. Infectious Disease
4.4. North America Precision Medicine Software Market Outlook, by End User, Value (US$ Billion), 2020–2033
4.4.1. Clinical Laboratories and Pathology Services
4.4.2. Hospitals and Cancer Centres
4.4.3. Biopharmaceutical and Translational Research
4.4.4. Academic and Government Research
4.5. North America Precision Medicine Software Market Outlook, by Country, Value (US$ Billion), 2020–2033
4.5.1. United States Precision Medicine Software Market Outlook, by Software Type, 2020–2033
4.5.2. United States Precision Medicine Software Market Outlook, by Delivery Model, 2020–2033
4.5.3. United States Precision Medicine Software Market Outlook, by Application, 2020–2033
4.5.4. United States Precision Medicine Software Market Outlook, by End User, 2020–2033
4.5.5. Canada Precision Medicine Software Market Outlook, by Software Type, 2020–2033
4.5.6. Canada Precision Medicine Software Market Outlook, by Delivery Model, 2020–2033
4.5.7. Canada Precision Medicine Software Market Outlook, by Application, 2020–2033
4.5.8. Canada Precision Medicine Software Market Outlook, by End User, 2020–2033
5. Europe Precision Medicine Software Market Outlook, 2020–2033
5.1. Europe Precision Medicine Software Market Outlook, by Software Type, Value (US$ Billion), 2020–2033
5.1.1. Secondary Analysis and Variant Calling
5.1.2. Tertiary Analysis and Interpretation
5.1.3. Clinical Reporting and Knowledge Bases
5.1.4. Laboratory Information Management
5.1.5. Multi-Omic Data Management
5.2. Europe Precision Medicine Software Market Outlook, by Delivery Model, Value (US$ Billion), 2020–2033
5.2.1. Cloud-Based
5.2.2. On-Premise
5.2.3. Hybrid
5.3. Europe Precision Medicine Software Market Outlook, by Application, Value (US$ Billion), 2020–2033
5.3.1. Oncology
5.3.2. Hereditary and Rare Disease
5.3.3. Pharmacogenomics
5.3.4. Reproductive and Carrier Screening
5.3.5. Infectious Disease
5.4. Europe Precision Medicine Software Market Outlook, by End User, Value (US$ Billion), 2020–2033
5.4.1. Clinical Laboratories and Pathology Services
5.4.2. Hospitals and Cancer Centres
5.4.3. Biopharmaceutical and Translational Research
5.4.4. Academic and Government Research
5.5. Europe Precision Medicine Software Market Outlook, by Country, Value (US$ Billion), 2020–2033
5.5.1. United Kingdom Precision Medicine Software Market Outlook, by Software Type, 2020–2033
5.5.2. United Kingdom Precision Medicine Software Market Outlook, by Delivery Model, 2020–2033
5.5.3. United Kingdom Precision Medicine Software Market Outlook, by Application, 2020–2033
5.5.4. United Kingdom Precision Medicine Software Market Outlook, by End User, 2020–2033
5.5.5. Germany Precision Medicine Software Market Outlook, by Software Type, 2020–2033
5.5.6. Germany Precision Medicine Software Market Outlook, by Delivery Model, 2020–2033
5.5.7. Germany Precision Medicine Software Market Outlook, by Application, 2020–2033
5.5.8. Germany Precision Medicine Software Market Outlook, by End User, 2020–2033
5.5.9. France Precision Medicine Software Market Outlook, by Software Type, 2020–2033
5.5.10. France Precision Medicine Software Market Outlook, by Delivery Model, 2020–2033
5.5.11. France Precision Medicine Software Market Outlook, by Application, 2020–2033
5.5.12. France Precision Medicine Software Market Outlook, by End User, 2020–2033
5.5.13. Netherlands Precision Medicine Software Market Outlook, by Software Type, 2020–2033
5.5.14. Netherlands Precision Medicine Software Market Outlook, by Delivery Model, 2020–2033
5.5.15. Netherlands Precision Medicine Software Market Outlook, by Application, 2020–2033
5.5.16. Netherlands Precision Medicine Software Market Outlook, by End User, 2020–2033
5.5.17. Spain Precision Medicine Software Market Outlook, by Software Type, 2020–2033
5.5.18. Spain Precision Medicine Software Market Outlook, by Delivery Model, 2020–2033
5.5.19. Spain Precision Medicine Software Market Outlook, by Application, 2020–2033
5.5.20. Spain Precision Medicine Software Market Outlook, by End User, 2020–2033
6. Asia Pacific Precision Medicine Software Market Outlook, 2020–2033
6.1. Asia Pacific Precision Medicine Software Market Outlook, by Software Type, Value (US$ Billion), 2020–2033
6.1.1. Secondary Analysis and Variant Calling
6.1.2. Tertiary Analysis and Interpretation
6.1.3. Clinical Reporting and Knowledge Bases
6.1.4. Laboratory Information Management
6.1.5. Multi-Omic Data Management
6.2. Asia Pacific Precision Medicine Software Market Outlook, by Delivery Model, Value (US$ Billion), 2020–2033
6.2.1. Cloud-Based
6.2.2. On-Premise
6.2.3. Hybrid
6.3. Asia Pacific Precision Medicine Software Market Outlook, by Application, Value (US$ Billion), 2020–2033
6.3.1. Oncology
6.3.2. Hereditary and Rare Disease
6.3.3. Pharmacogenomics
6.3.4. Reproductive and Carrier Screening
6.3.5. Infectious Disease
6.4. Asia Pacific Precision Medicine Software Market Outlook, by End User, Value (US$ Billion), 2020–2033
6.4.1. Clinical Laboratories and Pathology Services
6.4.2. Hospitals and Cancer Centres
6.4.3. Biopharmaceutical and Translational Research
6.4.4. Academic and Government Research
6.5. Asia Pacific Precision Medicine Software Market Outlook, by Country, Value (US$ Billion), 2020–2033
6.5.1. China Precision Medicine Software Market Outlook, by Software Type, 2020–2033
6.5.2. China Precision Medicine Software Market Outlook, by Delivery Model, 2020–2033
6.5.3. China Precision Medicine Software Market Outlook, by Application, 2020–2033
6.5.4. China Precision Medicine Software Market Outlook, by End User, 2020–2033
6.5.5. Japan Precision Medicine Software Market Outlook, by Software Type, 2020–2033
6.5.6. Japan Precision Medicine Software Market Outlook, by Delivery Model, 2020–2033
6.5.7. Japan Precision Medicine Software Market Outlook, by Application, 2020–2033
6.5.8. Japan Precision Medicine Software Market Outlook, by End User, 2020–2033
6.5.9. India Precision Medicine Software Market Outlook, by Software Type, 2020–2033
6.5.10. India Precision Medicine Software Market Outlook, by Delivery Model, 2020–2033
6.5.11. India Precision Medicine Software Market Outlook, by Application, 2020–2033
6.5.12. India Precision Medicine Software Market Outlook, by End User, 2020–2033
6.5.13. Australia Precision Medicine Software Market Outlook, by Software Type, 2020–2033
6.5.14. Australia Precision Medicine Software Market Outlook, by Delivery Model, 2020–2033
6.5.15. Australia Precision Medicine Software Market Outlook, by Application, 2020–2033
6.5.16. Australia Precision Medicine Software Market Outlook, by End User, 2020–2033
6.5.17. Singapore Precision Medicine Software Market Outlook, by Software Type, 2020–2033
6.5.18. Singapore Precision Medicine Software Market Outlook, by Delivery Model, 2020–2033
6.5.19. Singapore Precision Medicine Software Market Outlook, by Application, 2020–2033
6.5.20. Singapore Precision Medicine Software Market Outlook, by End User, 2020–2033
6.5.21. Republic of Korea Precision Medicine Software Market Outlook, by Software Type, 2020–2033
6.5.22. Republic of Korea Precision Medicine Software Market Outlook, by Delivery Model, 2020–2033
6.5.23. Republic of Korea Precision Medicine Software Market Outlook, by Application, 2020–2033
6.5.24. Republic of Korea Precision Medicine Software Market Outlook, by End User, 2020–2033
7. Latin America Precision Medicine Software Market Outlook, 2020–2033
7.1. Latin America Precision Medicine Software Market Outlook, by Software Type, Value (US$ Billion), 2020–2033
7.1.1. Secondary Analysis and Variant Calling
7.1.2. Tertiary Analysis and Interpretation
7.1.3. Clinical Reporting and Knowledge Bases
7.1.4. Laboratory Information Management
7.1.5. Multi-Omic Data Management
7.2. Latin America Precision Medicine Software Market Outlook, by Delivery Model, Value (US$ Billion), 2020–2033
7.2.1. Cloud-Based
7.2.2. On-Premise
7.2.3. Hybrid
7.3. Latin America Precision Medicine Software Market Outlook, by Application, Value (US$ Billion), 2020–2033
7.3.1. Oncology
7.3.2. Hereditary and Rare Disease
7.3.3. Pharmacogenomics
7.3.4. Reproductive and Carrier Screening
7.3.5. Infectious Disease
7.4. Latin America Precision Medicine Software Market Outlook, by End User, Value (US$ Billion), 2020–2033
7.4.1. Clinical Laboratories and Pathology Services
7.4.2. Hospitals and Cancer Centres
7.4.3. Biopharmaceutical and Translational Research
7.4.4. Academic and Government Research
7.5. Latin America Precision Medicine Software Market Outlook, by Country, Value (US$ Billion), 2020–2033
7.5.1. Brazil Precision Medicine Software Market Outlook, by Software Type, 2020–2033
7.5.2. Brazil Precision Medicine Software Market Outlook, by Delivery Model, 2020–2033
7.5.3. Brazil Precision Medicine Software Market Outlook, by Application, 2020–2033
7.5.4. Brazil Precision Medicine Software Market Outlook, by End User, 2020–2033
7.5.5. Mexico Precision Medicine Software Market Outlook, by Software Type, 2020–2033
7.5.6. Mexico Precision Medicine Software Market Outlook, by Delivery Model, 2020–2033
7.5.7. Mexico Precision Medicine Software Market Outlook, by Application, 2020–2033
7.5.8. Mexico Precision Medicine Software Market Outlook, by End User, 2020–2033
7.5.9. Argentina Precision Medicine Software Market Outlook, by Software Type, 2020–2033
7.5.10. Argentina Precision Medicine Software Market Outlook, by Delivery Model, 2020–2033
7.5.11. Argentina Precision Medicine Software Market Outlook, by Application, 2020–2033
7.5.12. Argentina Precision Medicine Software Market Outlook, by End User, 2020–2033
7.5.13. Chile Precision Medicine Software Market Outlook, by Software Type, 2020–2033
7.5.14. Chile Precision Medicine Software Market Outlook, by Delivery Model, 2020–2033
7.5.15. Chile Precision Medicine Software Market Outlook, by Application, 2020–2033
7.5.16. Chile Precision Medicine Software Market Outlook, by End User, 2020–2033
7.5.17. Colombia Precision Medicine Software Market Outlook, by Software Type, 2020–2033
7.5.18. Colombia Precision Medicine Software Market Outlook, by Delivery Model, 2020–2033
7.5.19. Colombia Precision Medicine Software Market Outlook, by Application, 2020–2033
7.5.20. Colombia Precision Medicine Software Market Outlook, by End User, 2020–2033
8. Middle East & Africa Precision Medicine Software Market Outlook, 2020–2033
8.1. Middle East & Africa Precision Medicine Software Market Outlook, by Software Type, Value (US$ Billion), 2020–2033
8.1.1. Secondary Analysis and Variant Calling
8.1.2. Tertiary Analysis and Interpretation
8.1.3. Clinical Reporting and Knowledge Bases
8.1.4. Laboratory Information Management
8.1.5. Multi-Omic Data Management
8.2. Middle East & Africa Precision Medicine Software Market Outlook, by Delivery Model, Value (US$ Billion), 2020–2033
8.2.1. Cloud-Based
8.2.2. On-Premise
8.2.3. Hybrid
8.3. Middle East & Africa Precision Medicine Software Market Outlook, by Application, Value (US$ Billion), 2020–2033
8.3.1. Oncology
8.3.2. Hereditary and Rare Disease
8.3.3. Pharmacogenomics
8.3.4. Reproductive and Carrier Screening
8.3.5. Infectious Disease
8.4. Middle East & Africa Precision Medicine Software Market Outlook, by End User, Value (US$ Billion), 2020–2033
8.4.1. Clinical Laboratories and Pathology Services
8.4.2. Hospitals and Cancer Centres
8.4.3. Biopharmaceutical and Translational Research
8.4.4. Academic and Government Research
8.5. Middle East & Africa Precision Medicine Software Market Outlook, by Country, Value (US$ Billion), 2020–2033
8.5.1. Saudi Arabia Precision Medicine Software Market Outlook, by Software Type, 2020–2033
8.5.2. Saudi Arabia Precision Medicine Software Market Outlook, by Delivery Model, 2020–2033
8.5.3. Saudi Arabia Precision Medicine Software Market Outlook, by Application, 2020–2033
8.5.4. Saudi Arabia Precision Medicine Software Market Outlook, by End User, 2020–2033
8.5.5. United Arab Emirates Precision Medicine Software Market Outlook, by Software Type, 2020–2033
8.5.6. United Arab Emirates Precision Medicine Software Market Outlook, by Delivery Model, 2020–2033
8.5.7. United Arab Emirates Precision Medicine Software Market Outlook, by Application, 2020–2033
8.5.8. United Arab Emirates Precision Medicine Software Market Outlook, by End User, 2020–2033
8.5.9. Qatar Precision Medicine Software Market Outlook, by Software Type, 2020–2033
8.5.10. Qatar Precision Medicine Software Market Outlook, by Delivery Model, 2020–2033
8.5.11. Qatar Precision Medicine Software Market Outlook, by Application, 2020–2033
8.5.12. Qatar Precision Medicine Software Market Outlook, by End User, 2020–2033
8.5.13. Israel Precision Medicine Software Market Outlook, by Software Type, 2020–2033
8.5.14. Israel Precision Medicine Software Market Outlook, by Delivery Model, 2020–2033
8.5.15. Israel Precision Medicine Software Market Outlook, by Application, 2020–2033
8.5.16. Israel Precision Medicine Software Market Outlook, by End User, 2020–2033
8.5.17. South Africa Precision Medicine Software Market Outlook, by Software Type, 2020–2033
8.5.18. South Africa Precision Medicine Software Market Outlook, by Delivery Model, 2020–2033
8.5.19. South Africa Precision Medicine Software Market Outlook, by Application, 2020–2033
8.5.20. South Africa Precision Medicine Software Market Outlook, by End User, 2020–2033
8.5.21. Egypt Precision Medicine Software Market Outlook, by Software Type, 2020–2033
8.5.22. Egypt Precision Medicine Software Market Outlook, by Delivery Model, 2020–2033
8.5.23. Egypt Precision Medicine Software Market Outlook, by Application, 2020–2033
8.5.24. Egypt Precision Medicine Software Market Outlook, by End User, 2020–2033
8.5.25. Nigeria Precision Medicine Software Market Outlook, by Software Type, 2020–2033
8.5.26. Nigeria Precision Medicine Software Market Outlook, by Delivery Model, 2020–2033
8.5.27. Nigeria Precision Medicine Software Market Outlook, by Application, 2020–2033
8.5.28. Nigeria Precision Medicine Software Market Outlook, by End User, 2020–2033
9. Competitive Landscape
9.1. Market Concentration and Industry Leaders
9.2. Competitive Differentiation
9.3. Strategic Moves and Market Direction
9.4. Recent Industry Developments
9.5. Company Profiles
9.5.1. Illumina
9.5.2. QIAGEN
9.5.3. Thermo Fisher Scientific
9.5.4. F. Hoffmann-La Roche
9.5.5. SOPHiA GENETICS
9.5.6. Velsera
9.5.7. Fabric Genomics
9.5.8. Congenica
9.5.9. Genoox
9.5.10. DNAnexus
9.5.11. Clinisys
9.5.12. LabVantage Solutions
10. Appendix
10.1. Research Methodology
10.2. Report Assumptions
10.3. Acronyms and Abbreviations
| Software Type | Secondary Analysis and Variant Calling, Tertiary Analysis and Interpretation, Clinical Reporting and Knowledge Bases, Laboratory Information Management, Multi-Omic Data Management |
| Delivery Model | Cloud-Based, On-Premise, Hybrid |
| Application | Oncology, Hereditary and Rare Disease, Pharmacogenomics, Reproductive and Carrier Screening, Infectious Disease |
| End User | Clinical Laboratories and Pathology Services, Hospitals and Cancer Centres, Biopharmaceutical and Translational Research, Academic and Government Research |
| Regions | North America, Europe, Asia Pacific, Latin America, Middle East & Africa |
Our Research Methodology
Considering the volatility of business today, traditional approaches to strategizing a game plan can be unfruitful if not detrimental. True ambiguity is no way to determine a forecast. A myriad of predetermined factors must be accounted for such as the degree of risk involved, the magnitude of circumstances, as well as conditions or consequences that are not known or unpredictable. To circumvent binary views that cast uncertainty, the application of market research intelligence to strategically posture, move, and enable actionable outcomes is necessary.
View Methodology
Quality Assured
Rigorous Validation Process

Confidentiality Assured
End-to-end Data Security

Custom Research Services
Tailored To Your Objectives
FAQs
The market is valued at US$ 2.6 billion in 2026, covering genomic analysis, interpretation, reporting, knowledge bases and molecular data management software sold to laboratories and research groups.
The market is projected to reach US$ 7.8 billion by 2033 at a 17.0% CAGR, representing an absolute dollar opportunity of US$ 5.2 billion over the forecast period.
Tertiary Analysis and Interpretation leads with 34% share in 2026, because classifying variants against curated evidence is the scarcest and most valuable step.
Pharmacogenomics is the fastest-growing application at a 20.8% CAGR, while Asia Pacific is the fastest-expanding geography at a 20.6% CAGR through 2033.
North America leads with 47% share in 2026, and concentration is medium, with instrument suppliers, interpretation specialists and laboratory informatics vendors occupying distinct layers.
Related Reports
Smart Home Health Market Size, Share, Insights, Competitive Landscape, and Forecast 2026 to 2033
The smart home health market is projected to grow from US$5.80 billion in 2026 to US$9.90 billion by 2033, at a 7.9% CAGR, driven by aging and home monitoring.
Population Health Management Market Size, Share, Insights, Competitive Landscape, and Forecast 2026 to 2033
The population health management market is projected to grow from US$46.93 billion in 2026 to US$132.63 billion by 2033, at a 16.0% CAGR, led by value-based care.
Medical Second Opinion Market Size, Share, Insights, Competitive Landscape, and Forecast 2026 to 2033
The medical second opinion market is projected to grow from US$9.69 billion in 2026 to US$28.55 billion by 2033, at a 16.7% CAGR, led by virtual care.
Patient Blood Management Market Size, Share, Insights, Competitive Landscape, and Forecast 2026 to 2033
Explore the patient blood management market, reaching US$ 25.61 billion by 2033 at 6.4% CAGR, with product and regional insights.
Medical Fraud Detection Management Market Size, Share, Insights, Competitive Landscape, and Forecast 2026 to 2033
Explore medical fraud detection management, reaching US$ 11.47 billion by 2033 at 17.4% CAGR, with deployment and regional insights.
Bioinformatics Market Size, Share, Insights, Competitive Landscape, and Forecast 2026 to 2033
Explore the bioinformatics market, reaching US$ 44.10 billion by 2033 at 13.1% CAGR, with offering, technology and regional insights.