



Product-as-a-Service Market
Product-as-a-Service Market Size, Share, Insights, Competitive Landscape, and Forecast 2026 to 2033
Product-as-a-Service Market Size and Trend Analysis
How Large Is the Product-as-a-Service Market Today?
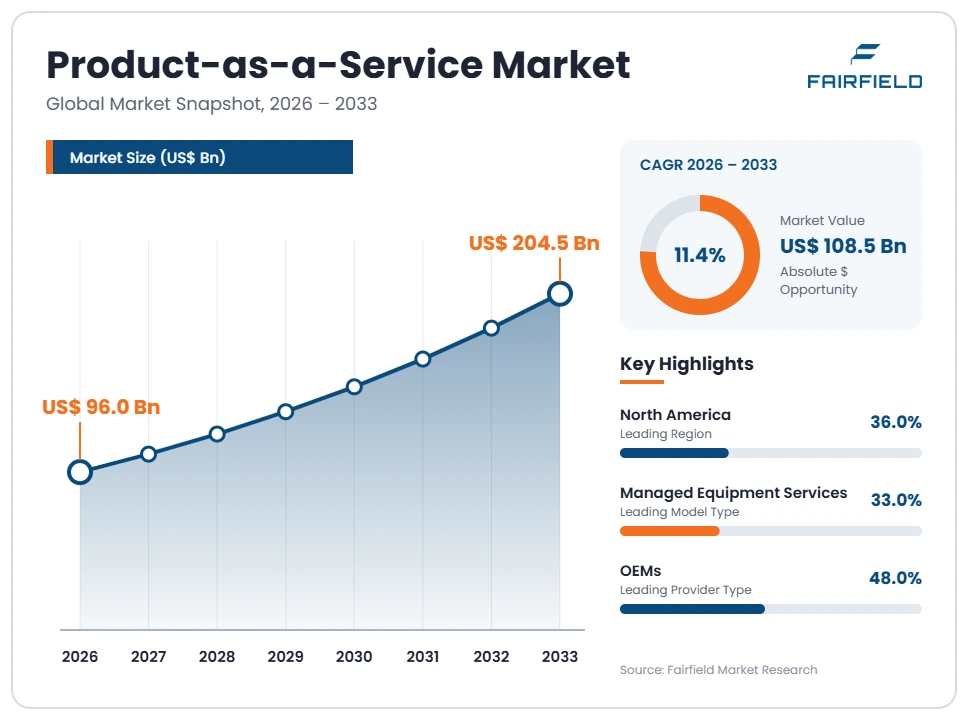
The global Product-as-a-Service market size is expected to be valued at US$ 96.0 billion in 2026 and projected to reach US$ 204.5 billion by 2033, growing at a CAGR of 11.4% between 2026 and 2033.
Contract value grew at about 12.5% a year between 2020 and 2025, reaching roughly US$ 86.0 billion in the base year. The figure counts arrangements where a provider retains ownership of physical equipment and bills for its use, output or availability, and it deliberately excludes pure software subscription and conventional equipment leasing without bundled service. Adoption remains uneven. It is established in aero engines, medical equipment, compressed air, lighting and information technology hardware, and marginal in sectors where usage is difficult to meter. Growth therefore reflects deeper penetration of a few proven asset classes rather than a general shift away from selling equipment outright.
Key Report Takeaways
- By Model Type: Managed equipment services held 33.0% of contract value in 2026, while pay-per-outcome agreements are projected to expand at a 14.2% CAGR through 2033, as buyers in regulated settings contract for availability rather than for hardware.
- By Asset Category: Industrial equipment and machinery held 25.5% share in 2026, while mobility and vehicles are projected to expand at a 14.1% CAGR through 2033, helped by fleet telematics that already measure distance, load and driver behaviour.
- By Provider Type: Original equipment manufacturers held 48.0% of contract value in 2026, while financing and leasing partners are projected to expand at a 13.4% CAGR through 2033, because manufacturers increasingly place the asset with a third party.
- By End Use Industry: Manufacturing held 28.0% share in 2026, while healthcare is projected to expand at a 13.5% CAGR through 2033, as hospitals contract for imaging and laboratory capacity instead of purchasing equipment outright.
- By Geography: North America held 36.0% of contract value in 2026, while Asia Pacific is projected to expand at a 13.8% CAGR through 2033, supported by industrial equipment demand and limited capital availability among smaller manufacturers.
Global Product-as-a-Service Market Trends and Insights
Drivers Impact Analysis
Two conditions decide whether a usage contract can be written at all: the customer’s reluctance to spend capital, and the provider’s ability to measure what it bills.
| Driver | Impact on CAGR Forecast | Geographic Relevance | Impact Timeline |
| Customers preferring operating expenditure over capital purchases of equipment | High | Global, strongest in North America and Europe | Medium term (2–4 years) |
| Falling cost of telemetry, connectivity and metering on industrial assets | High | North America, Europe, Asia Pacific | Long term (≥4 years) |
Customers Avoiding Capital Expenditure Pull Equipment Into Usage Contracts
Demand for usage-based equipment contracts comes mainly from buyers who cannot or will not raise capital. Hospitals with constrained budgets, smaller manufacturers without borrowing headroom and public bodies with annual spending limits all find it easier to approve a recurring operating charge than a large purchase. For the provider, the same contract converts a one-off sale into several years of predictable revenue and secures the consumables and service attached to the machine.
The mechanism is the approval process rather than the arithmetic. Capital requests face committee review, depreciation schedules and competing projects, while operating costs tied to measurable output can often be approved by a plant or department manager. Higher interest rates have widened the gap, since the cost of financing a purchase now visibly exceeds the premium embedded in a service charge. Providers reinforce this by bundling maintenance, spare parts, software and uptime commitments into a single invoice.
Cheap Telemetry Makes Usage and Outcome Billing Administrable
The model only works where usage can be measured reliably and cheaply, and falling sensor and connectivity costs have expanded the set of assets that qualify. Metering hardware, cellular modules and cloud data handling now cost a fraction of what they did a decade ago, which makes it practical to bill by running hour, by part produced, by kilometre or by cubic metre of compressed air. That is why these contracts spread first in equipment that was already instrumented.
Measurement also underpins the provider’s own economics. Usage data allows condition-based maintenance, which lowers the service cost the provider has absorbed, and it supports residual value estimates when equipment is returned. Where personal data is involved, as with vehicles or consumer durables, telemetry triggers data protection obligations that must be handled in the contract. Dispute resolution depends on both parties trusting the meter, so audit rights are now standard.
Restraints Impact Analysis
Adoption has lagged the promotion of this model for structural reasons, and both of the following act on the provider’s finances rather than on customer interest.
| Restraint | Impact on CAGR Forecast | Geographic Relevance | Impact Timeline |
| Balance sheet transfer, credit exposure and residual value risk for providers | High | Global | Long term (≥4 years) |
| Lease and revenue accounting treatment limiting the promised customer benefit | Medium | North America and Europe | Medium term (2–4 years) |
Balance Sheet Transfer Creates a Revenue Trough Providers Must Fund
The provider keeps the asset on its own balance sheet, and that single fact explains most of the slow adoption. A manufacturer that stops selling machines and starts renting them collects a fraction of the former price in year one while still paying the full cost of building the equipment. The resulting revenue trough can last several years, consumes working capital, depresses reported margins and unsettles investors, which makes the transition difficult for any listed company to fund from operations.
Two further exposures move with the asset. The provider now underwrites customer credit, because an unpaid monthly charge cannot be recovered from equipment already installed in a factory. It must also predict residual value, since contract pricing assumes the machine can be refurbished and redeployed at the end of the term. Both are financing disciplines rather than engineering ones, and most manufacturers lack the data history to price them accurately.
Lease and Revenue Accounting Rules Limit the Promised Customer Benefit
Accounting treatment frequently removes the benefit the model is sold on. Customers are often told that a usage contract keeps equipment off their balance sheet, but under IFRS 16 and ASC 842 an arrangement conveying the right to control an identified asset is recognised as a lease, with a right-of-use asset and a liability. Finance teams discover this during review, and deals stall while the structure is renegotiated or abandoned.
Revenue recognition creates a parallel problem for the provider. Under IFRS 15 and ASC 606, bundled hardware, consumables, software and maintenance must be separated into performance obligations and recognised across different periods, which complicates reporting and sales compensation. Contracts that genuinely avoid lease treatment usually require the provider to retain substantive substitution rights or to sell an outcome rather than a machine, and that is only possible where output can be measured independently of the specific unit installed.
Market Opportunities
Two revenue pools favour providers that retain ownership, and both are strengthened by policy rather than by customer preference alone.
Circular Economy Rules Reward Providers Who Retain Equipment Ownership
Policy direction in Europe is creating a commercial advantage for retained ownership. Rules on ecodesign, product lifetime, reuse and repair push manufacturers toward durable, serviceable designs, and extended producer responsibility already makes producers accountable for equipment at end of life. A provider that never transfers title is positioned to meet these obligations as a matter of course, because it already controls maintenance, parts supply and recovery of the asset.
Manufacturers with established service networks can capture this most easily, since collection and refurbishment depend on field logistics that are expensive to build from scratch. Demand comes from corporate and public buyers who must report on resource use and waste, and who increasingly write recovery obligations into tenders. Digital product passport requirements add a further advantage, as a provider holding the full service history of each unit can supply that documentation without reconstructing it from customer records.
Refurbishment and Second-Life Resale Add a Margin Pool to Usage Contracts
Second-life revenue is the least exploited pool in the industry. Equipment returned at the end of a contract can be refurbished and placed with a second customer at a lower rate, sold into a secondary market, or stripped for spare parts that support the installed base. Each cycle earns revenue on an asset already paid for, and a provider that can count on two or three lives per machine can price the first contract more competitively than a rival who cannot.
Capturing this requires refurbishment capacity, parts availability and accurate records of how each unit was used. Specialist service providers and financing partners are building this capability alongside manufacturers, sometimes taking the asset onto their own books so the manufacturer avoids the revenue trough. Information technology hardware, medical devices and construction equipment show the clearest second-life markets, because buyers in those categories readily accept certified refurbished units.
Segment Analysis
- By Model Type: Managed Equipment Services Lead While Outcome Contracts Grow Fastest
Managed equipment services accounted for 33.0% of contract value in 2026, the largest model type. These agreements bundle hardware, consumables, maintenance and software into a single periodic charge, and they dominate because they are the easiest structure for both parties to administer and audit. Equipment subscription and rental-as-a-service, pay-per-use contracts and platform and asset management software make up the balance, with the platform layer small in revenue but necessary to everything else.
Pay-per-outcome contracts are expanding fastest at a 14.2% CAGR to 2033. Here the customer buys availability or a unit of output, such as an engine flying hour, a lumen of light or a produced part, and the provider carries the performance risk. Growth is concentrated in regulated or critical equipment where uptime is contractually valuable. The structure also reduces the chance of lease recognition for the customer, which removes one of the main obstacles to signing.
- By Asset Category: Industrial Machinery Holds the Base as Mobility Assets Accelerate
Industrial equipment and machinery represented 25.5% of contract value in 2026. Compressors, machine tools, pumps and material handling equipment suit usage billing because their output is already instrumented and their service requirements are well understood. Information technology hardware and medical devices follow closely, both supported by long-established managed service and consumable-attached arrangements. Lighting and building systems, agricultural equipment and consumer durables divide the remainder.
Mobility and vehicles form the fastest-growing asset category at a 14.1% CAGR through 2033. Fleet telematics already record distance, load, fuel and driver behaviour, so the metering problem is solved before the contract begins, and tyres, trucks and specialist vehicles are increasingly supplied on distance or availability terms. Consumer durables remain the weakest category, because servicing scattered individual units is costly and consumer credit regulation applies to the contract in most jurisdictions.
- By Provider Type: Equipment Manufacturers Dominate While Financing Partners Gain Share
Original equipment manufacturers held 48.0% of contract value in 2026. They control the engineering data, spare parts and service network that make a usage contract profitable, and they have the strongest commercial reason to defend the installed base against independent service providers. Specialist service providers, financing and leasing partners and platform providers share the rest, each supplying a capability that manufacturers often lack internally.
Financing and leasing partners are growing fastest at a 13.4% CAGR to 2033. Their role is to take the asset onto a balance sheet built for it, which lets a manufacturer offer usage terms without funding a multi-year revenue trough or underwriting customer credit itself. These partners also price residual value professionally, drawing on portfolios across many asset types. The practical result is a three-party structure in which the manufacturer keeps the customer relationship while a specialist carries the capital.
- By End Use Industry: Manufacturing Leads Adoption While Healthcare Expands Quickest
Manufacturing generated 28.0% of contract value in 2026, the largest end use. Factories run equipment with measurable output, value uptime highly and are accustomed to buying compressed air, machine time and material handling capacity as a service. Information technology and telecom, construction and infrastructure, transport and logistics, agriculture, and retail and consumer applications account for the remainder, with agriculture limited by seasonality and residual value uncertainty.
Healthcare is the fastest-growing end use at a 13.5% CAGR through 2033. Hospitals face constrained capital budgets but must keep imaging, diagnostic and laboratory capacity current, and managed equipment contracts tied to test volumes or scan counts fit that position well. Procurement rules in public health systems increasingly permit multi-year service agreements where outright purchase would be difficult to fund. Equipment makers, in turn, secure consumable and reagent revenue for the life of the contract.
Geography Analysis
- Which Region Is Leading the Product-as-a-Service Market?
North America is leading the product-as-a-service market with 36.0% of contract value in 2026, because its customers and providers are both comfortable with service-based procurement. The United States supplies most of this through managed print, device-as-a-service, medical equipment agreements, compressed air contracts and aviation service arrangements, with Canada adding industrial and mining equipment programmes. Established financing markets make it straightforward to place assets with a third party.
Three conditions support the position. Operating expenditure approval is routine in corporate procurement, specialist asset finance providers compete actively for this business, and service networks are dense enough to make uptime commitments credible. ASC 842 shapes how customers evaluate the contracts, so structuring work is done early in the sales cycle. The main brake is caution among manufacturers, many of whom pilot usage contracts in a single product line rather than reorganise a profitable equipment sales business.
- Europe Ties Usage Contracts to Circular Economy Policy
Europe accounted for 30.0% of contract value in 2026, led by Germany, France, the Netherlands, the Nordic countries and the United Kingdom. The region hosts several of the earliest commercial examples of the model, including lighting supplied as a service and compressed air billed by volume, and its industrial base contains many mid-sized manufacturers willing to experiment with new commercial structures on established machinery.
Policy is the regional differentiator. Ecodesign requirements covering durability, reparability and reuse, together with extended producer responsibility obligations, reward providers that keep ownership and recover equipment. Corporate sustainability reporting pushes large buyers to account for resource use, which favours contracts that include refurbishment. IFRS 16 continues to limit the off-balance-sheet argument for customers. Fragmented national tax and leasing rules also add structuring cost for providers operating across several member states.
- Which Region Is Growing Fastest in the Product-as-a-Service Market?
Asia Pacific is growing fastest in the product-as-a-service market, at a 13.8% CAGR between 2026 and 2033, from a 24.0% share in 2026. China, Japan, India, Australia and Korea drive this, with demand concentrated among smaller manufacturers who need modern equipment but cannot access affordable capital. Machine tool, compressor, agricultural equipment and construction machinery providers have built usage programmes aimed directly at that constraint.
Connectivity makes the model workable at scale. Industrial equipment sold in the region is increasingly shipped with telemetry as standard, and mobile network coverage supports metering even at remote sites. Equipment makers in China and Japan use usage contracts to defend market share against lower-priced hardware rivals. The constraints are credit assessment of small customers, enforcement of recovery rights across jurisdictions, and thin secondary markets for returned equipment in several countries.
- Latin America Adopts Usage Contracts Where Capital Is Scarce
Latin America held 5.5% of contract value in 2026, with Brazil, Mexico, Chile and Colombia accounting for most activity. Adoption is concentrated in mining equipment, agricultural machinery, medical devices and information technology hardware, where the alternative is financing a purchase at high local interest rates. For many operators the usage contract is simply the cheapest way to obtain modern equipment.
The constraints are financial and legal rather than technical. Currency volatility complicates multi-year contracts priced in local terms, while repossession and recovery of assets can be slow where enforcement is uncertain, which raises the risk premium providers build into pricing. Import duties on equipment add further cost. The clearest opportunity is agricultural machinery, where seasonal cash flows align well with usage billing and where telemetry is already fitted to most new tractors and harvesters.
- Middle East & Africa Uses Managed Equipment Contracts to Close Capability Gaps
Middle East & Africa represented 4.5% of contract value in 2026, the smallest regional share. Gulf states account for the majority, using managed equipment arrangements in healthcare, aviation services, data centre hardware and building systems to obtain capability quickly without building internal maintenance organisations. National infrastructure programmes often specify availability-based contracts so that performance risk sits with the supplier.
Elsewhere in the region, adoption centres on medical devices supplied with reagents and on power and cooling equipment billed by output. Barriers are substantial: credit assessment is difficult without established business credit data, service networks are thin outside major cities, and foreign exchange availability can interrupt payment streams. The opportunity lies in contracts underwritten by development finance institutions, which reduce the credit exposure that otherwise prevents providers from entering these markets.
Competitive Landscape
The product-as-a-service market is fragmented and has low concentration, because it is not a single industry. It is a commercial model applied inside many separate equipment sectors, and the leading provider of aero engine availability contracts has no overlap with the leading provider of managed print or hospital imaging agreements. Within each asset class, concentration follows the underlying equipment industry, so a few manufacturers dominate their own installed bases while remaining irrelevant outside them. Consolidation has been limited and has mostly involved manufacturers acquiring service, software or refurbishment capability rather than buying competitors.
Competition is fought on capabilities that traditional equipment sellers often lack. Providers must offer credible uptime commitments backed by field service, transparent metering that customers will accept in a dispute, billing systems able to invoice variable usage accurately, and a balance sheet or financing partner willing to hold the asset. Contract structuring skill matters as much as engineering, since the accounting outcome frequently determines whether a deal closes. New entrants come from three directions: specialist asset finance firms extending into equipment services, software vendors supplying the telemetry and billing layer, and independent service companies that already maintain other manufacturers’ machines.
Strategic activity concentrates on partnership rather than ownership. Manufacturers increasingly place assets with financing specialists, buy or license billing and asset management platforms, and build refurbishment centres that make second-life economics work. Several have created separate business units so the transition does not distort reported equipment sales.
Strategic direction is cautious and selective. Most providers are extending usage models into specific product lines where metering is reliable and uptime is valuable, while continuing to sell the rest of the range outright.
Recent Industry Developments
- July 2024: The European Union ecodesign for sustainable products regulation entered into force, extending ecodesign rules to durability, reparability, reuse and a digital product passport – it strengthens the commercial position of providers that retain ownership, maintain equipment and recover it at end of contract.
- July 2024: The European Union directive on common rules promoting the repair of goods entered into force, with member states required to transpose it into national law – it supports the parts availability and repair economics that usage-based contracts depend on across consumer and commercial equipment.
- April 2025: The European Union adopted a directive postponing sustainability reporting obligations for later company waves by two years – it slowed the disclosure timetable that had been pushing large asset owners to report resource use and product lifetime, delaying one source of demand for retained-ownership models.
Companies Covered in the Report
- Signify N.V.
- Atlas Copco AB
- Rolls-Royce Holdings plc
- Siemens AG
- Koninklijke Philips N.V.
- Hewlett Packard Enterprise Company
- Dell Technologies Inc.
- HP Inc.
- Xerox Holdings Corporation
- Caterpillar Inc.
- Deere & Company
- Schneider Electric SE
- Compagnie Générale des Établissements Michelin
- Kaeser Kompressoren SE
Product-as-a-Service Market Report Scope
| Metric | Value |
| Study Period | 2020–2033 |
| Market Size 2026 | US$ 96.0 Billion |
| Market Size 2033 | US$ 204.5 Billion |
| CAGR 2026–2033 | 11.4% |
| Absolute Dollar Opportunity | US$ 108.5 Billion |
| Largest Market | North America |
| Fastest-Growing Market | Asia Pacific |
| Market Concentration | Low |
| Major Players | Signify N.V., Atlas Copco AB, Rolls-Royce Holdings plc, Koninklijke Philips N.V., Hewlett Packard Enterprise Company |
Product-as-a-Service Market Segmentation
Model Type
- Equipment Subscription and Rental-as-a-Service
- Pay-Per-Use Contracts
- Pay-Per-Outcome Contracts
- Managed Equipment Services
- Platform and Asset Management Software
Asset Category
- Industrial Equipment and Machinery
- Medical Devices
- Information Technology Hardware
- Lighting and Building Systems
- Mobility and Vehicles
- Agricultural Equipment
- Consumer Durables
Provider Type
- Original Equipment Manufacturers
- Specialist Service Providers
- Financing and Leasing Partners
- Platform Providers
End Use Industry
- Manufacturing
- Healthcare
- Information Technology and Telecom
- Construction and Infrastructure
- Transport and Logistics
- Agriculture
- Retail and Consumer
Regions
- North America
- Europe
- Asia Pacific
- Latin America
- Middle East & Africa
- Executive Summary
- Global Product-as-a-Service Market Snapshot
- Future Projections, 2026-2033
- Key Market Trends
- Regional Snapshot
- Market Overview
- Market Definition and Report Scope
- Historical Market Trends, 2020-2025
- Market Dynamics
- Drivers Impact Analysis
- Customers Avoiding Capital Expenditure Pull Equipment Into Usage Contracts
- Cheap Telemetry Makes Usage and Outcome Billing Administrable
- Restraints Impact Analysis
- Balance Sheet Transfer Creates a Revenue Trough Providers Must Fund
- Lease and Revenue Accounting Rules Limit the Promised Customer Benefit
- Market Opportunities
- Circular Economy Rules Reward Providers Who Retain Equipment Ownership
- Refurbishment and Second-Life Resale Add a Margin Pool to Usage Contracts
- Drivers Impact Analysis
- Global Product-as-a-Service Market Outlook, 2020-2033
- Global Product-as-a-Service Market Outlook, by Model Type, Value (US$ Billion), 2020-2033
- Equipment Subscription and Rental-as-a-Service
- Pay-Per-Use Contracts
- Pay-Per-Outcome Contracts
- Managed Equipment Services
- Platform and Asset Management Software
- Global Product-as-a-Service Market Outlook, by Asset Category, Value (US$ Billion), 2020-2033
- Industrial Equipment and Machinery
- Medical Devices
- Information Technology Hardware
- Lighting and Building Systems
- Mobility and Vehicles
- Agricultural Equipment
- Consumer Durables
- Global Product-as-a-Service Market Outlook, by Provider Type, Value (US$ Billion), 2020-2033
- Original Equipment Manufacturers
- Specialist Service Providers
- Financing and Leasing Partners
- Platform Providers
- Global Product-as-a-Service Market Outlook, by End Use Industry, Value (US$ Billion), 2020-2033
- Manufacturing
- Healthcare
- Information Technology and Telecom
- Construction and Infrastructure
- Transport and Logistics
- Agriculture
- Retail and Consumer
- Global Product-as-a-Service Market Outlook, by Region, Value (US$ Billion), 2020-2033
- North America
- Europe
- Asia Pacific
- Latin America
- Middle East & Africa
- Global Product-as-a-Service Market Outlook, by Model Type, Value (US$ Billion), 2020-2033
- North America Product-as-a-Service Market Outlook, 2020-2033
- North America Product-as-a-Service Market Outlook, by Model Type, Value (US$ Billion), 2020-2033
- Equipment Subscription and Rental-as-a-Service
- Pay-Per-Use Contracts
- Pay-Per-Outcome Contracts
- Managed Equipment Services
- Platform and Asset Management Software
- North America Product-as-a-Service Market Outlook, by Asset Category, Value (US$ Billion), 2020-2033
- Industrial Equipment and Machinery
- Medical Devices
- Information Technology Hardware
- Lighting and Building Systems
- Mobility and Vehicles
- Agricultural Equipment
- Consumer Durables
- North America Product-as-a-Service Market Outlook, by Provider Type, Value (US$ Billion), 2020-2033
- Original Equipment Manufacturers
- Specialist Service Providers
- Financing and Leasing Partners
- Platform Providers
- North America Product-as-a-Service Market Outlook, by End Use Industry, Value (US$ Billion), 2020-2033
- Manufacturing
- Healthcare
- Information Technology and Telecom
- Construction and Infrastructure
- Transport and Logistics
- Agriculture
- Retail and Consumer
- North America Product-as-a-Service Market Outlook, by Country, Value (US$ Billion), 2020-2033
- United States Product-as-a-Service Market Outlook, by Model Type, 2020-2033
- United States Product-as-a-Service Market Outlook, by Asset Category, 2020-2033
- United States Product-as-a-Service Market Outlook, by Provider Type, 2020-2033
- United States Product-as-a-Service Market Outlook, by End Use Industry, 2020-2033
- Canada Product-as-a-Service Market Outlook, by Model Type, 2020-2033
- Canada Product-as-a-Service Market Outlook, by Asset Category, 2020-2033
- Canada Product-as-a-Service Market Outlook, by Provider Type, 2020-2033
- Canada Product-as-a-Service Market Outlook, by End Use Industry, 2020-2033
- North America Product-as-a-Service Market Outlook, by Model Type, Value (US$ Billion), 2020-2033
- Europe Product-as-a-Service Market Outlook, 2020-2033
- Europe Product-as-a-Service Market Outlook, by Model Type, Value (US$ Billion), 2020-2033
- Equipment Subscription and Rental-as-a-Service
- Pay-Per-Use Contracts
- Pay-Per-Outcome Contracts
- Managed Equipment Services
- Platform and Asset Management Software
- Europe Product-as-a-Service Market Outlook, by Asset Category, Value (US$ Billion), 2020-2033
- Industrial Equipment and Machinery
- Medical Devices
- Information Technology Hardware
- Lighting and Building Systems
- Mobility and Vehicles
- Agricultural Equipment
- Consumer Durables
- Europe Product-as-a-Service Market Outlook, by Provider Type, Value (US$ Billion), 2020-2033
- Original Equipment Manufacturers
- Specialist Service Providers
- Financing and Leasing Partners
- Platform Providers
- Europe Product-as-a-Service Market Outlook, by End Use Industry, Value (US$ Billion), 2020-2033
- Manufacturing
- Healthcare
- Information Technology and Telecom
- Construction and Infrastructure
- Transport and Logistics
- Agriculture
- Retail and Consumer
- Europe Product-as-a-Service Market Outlook, by Country and Subregion, Value (US$ Billion), 2020-2033
- Germany Product-as-a-Service Market Outlook, by Model Type, 2020-2033
- Germany Product-as-a-Service Market Outlook, by Asset Category, 2020-2033
- Germany Product-as-a-Service Market Outlook, by Provider Type, 2020-2033
- Germany Product-as-a-Service Market Outlook, by End Use Industry, 2020-2033
- France Product-as-a-Service Market Outlook, by Model Type, 2020-2033
- France Product-as-a-Service Market Outlook, by Asset Category, 2020-2033
- France Product-as-a-Service Market Outlook, by Provider Type, 2020-2033
- France Product-as-a-Service Market Outlook, by End Use Industry, 2020-2033
- Netherlands Product-as-a-Service Market Outlook, by Model Type, 2020-2033
- Netherlands Product-as-a-Service Market Outlook, by Asset Category, 2020-2033
- Netherlands Product-as-a-Service Market Outlook, by Provider Type, 2020-2033
- Netherlands Product-as-a-Service Market Outlook, by End Use Industry, 2020-2033
- Nordic countries Product-as-a-Service Market Outlook, by Model Type, 2020-2033
- Nordic countries Product-as-a-Service Market Outlook, by Asset Category, 2020-2033
- Nordic countries Product-as-a-Service Market Outlook, by Provider Type, 2020-2033
- Nordic countries Product-as-a-Service Market Outlook, by End Use Industry, 2020-2033
- United Kingdom Product-as-a-Service Market Outlook, by Model Type, 2020-2033
- United Kingdom Product-as-a-Service Market Outlook, by Asset Category, 2020-2033
- United Kingdom Product-as-a-Service Market Outlook, by Provider Type, 2020-2033
- United Kingdom Product-as-a-Service Market Outlook, by End Use Industry, 2020-2033
- Europe Product-as-a-Service Market Outlook, by Model Type, Value (US$ Billion), 2020-2033
- Asia Pacific Product-as-a-Service Market Outlook, 2020-2033
- Asia Pacific Product-as-a-Service Market Outlook, by Model Type, Value (US$ Billion), 2020-2033
- Equipment Subscription and Rental-as-a-Service
- Pay-Per-Use Contracts
- Pay-Per-Outcome Contracts
- Managed Equipment Services
- Platform and Asset Management Software
- Asia Pacific Product-as-a-Service Market Outlook, by Asset Category, Value (US$ Billion), 2020-2033
- Industrial Equipment and Machinery
- Medical Devices
- Information Technology Hardware
- Lighting and Building Systems
- Mobility and Vehicles
- Agricultural Equipment
- Consumer Durables
- Asia Pacific Product-as-a-Service Market Outlook, by Provider Type, Value (US$ Billion), 2020-2033
- Original Equipment Manufacturers
- Specialist Service Providers
- Financing and Leasing Partners
- Platform Providers
- Asia Pacific Product-as-a-Service Market Outlook, by End Use Industry, Value (US$ Billion), 2020-2033
- Manufacturing
- Healthcare
- Information Technology and Telecom
- Construction and Infrastructure
- Transport and Logistics
- Agriculture
- Retail and Consumer
- Asia Pacific Product-as-a-Service Market Outlook, by Country, Value (US$ Billion), 2020-2033
- China Product-as-a-Service Market Outlook, by Model Type, 2020-2033
- China Product-as-a-Service Market Outlook, by Asset Category, 2020-2033
- China Product-as-a-Service Market Outlook, by Provider Type, 2020-2033
- China Product-as-a-Service Market Outlook, by End Use Industry, 2020-2033
- Japan Product-as-a-Service Market Outlook, by Model Type, 2020-2033
- Japan Product-as-a-Service Market Outlook, by Asset Category, 2020-2033
- Japan Product-as-a-Service Market Outlook, by Provider Type, 2020-2033
- Japan Product-as-a-Service Market Outlook, by End Use Industry, 2020-2033
- India Product-as-a-Service Market Outlook, by Model Type, 2020-2033
- India Product-as-a-Service Market Outlook, by Asset Category, 2020-2033
- India Product-as-a-Service Market Outlook, by Provider Type, 2020-2033
- India Product-as-a-Service Market Outlook, by End Use Industry, 2020-2033
- Australia Product-as-a-Service Market Outlook, by Model Type, 2020-2033
- Australia Product-as-a-Service Market Outlook, by Asset Category, 2020-2033
- Australia Product-as-a-Service Market Outlook, by Provider Type, 2020-2033
- Australia Product-as-a-Service Market Outlook, by End Use Industry, 2020-2033
- Korea Product-as-a-Service Market Outlook, by Model Type, 2020-2033
- Korea Product-as-a-Service Market Outlook, by Asset Category, 2020-2033
- Korea Product-as-a-Service Market Outlook, by Provider Type, 2020-2033
- Korea Product-as-a-Service Market Outlook, by End Use Industry, 2020-2033
- Asia Pacific Product-as-a-Service Market Outlook, by Model Type, Value (US$ Billion), 2020-2033
- Latin America Product-as-a-Service Market Outlook, 2020-2033
- Latin America Product-as-a-Service Market Outlook, by Model Type, Value (US$ Billion), 2020-2033
- Equipment Subscription and Rental-as-a-Service
- Pay-Per-Use Contracts
- Pay-Per-Outcome Contracts
- Managed Equipment Services
- Platform and Asset Management Software
- Latin America Product-as-a-Service Market Outlook, by Asset Category, Value (US$ Billion), 2020-2033
- Industrial Equipment and Machinery
- Medical Devices
- Information Technology Hardware
- Lighting and Building Systems
- Mobility and Vehicles
- Agricultural Equipment
- Consumer Durables
- Latin America Product-as-a-Service Market Outlook, by Provider Type, Value (US$ Billion), 2020-2033
- Original Equipment Manufacturers
- Specialist Service Providers
- Financing and Leasing Partners
- Platform Providers
- Latin America Product-as-a-Service Market Outlook, by End Use Industry, Value (US$ Billion), 2020-2033
- Manufacturing
- Healthcare
- Information Technology and Telecom
- Construction and Infrastructure
- Transport and Logistics
- Agriculture
- Retail and Consumer
- Latin America Product-as-a-Service Market Outlook, by Country, Value (US$ Billion), 2020-2033
- Brazil Product-as-a-Service Market Outlook, by Model Type, 2020-2033
- Brazil Product-as-a-Service Market Outlook, by Asset Category, 2020-2033
- Brazil Product-as-a-Service Market Outlook, by Provider Type, 2020-2033
- Brazil Product-as-a-Service Market Outlook, by End Use Industry, 2020-2033
- Mexico Product-as-a-Service Market Outlook, by Model Type, 2020-2033
- Mexico Product-as-a-Service Market Outlook, by Asset Category, 2020-2033
- Mexico Product-as-a-Service Market Outlook, by Provider Type, 2020-2033
- Mexico Product-as-a-Service Market Outlook, by End Use Industry, 2020-2033
- Chile Product-as-a-Service Market Outlook, by Model Type, 2020-2033
- Chile Product-as-a-Service Market Outlook, by Asset Category, 2020-2033
- Chile Product-as-a-Service Market Outlook, by Provider Type, 2020-2033
- Chile Product-as-a-Service Market Outlook, by End Use Industry, 2020-2033
- Colombia Product-as-a-Service Market Outlook, by Model Type, 2020-2033
- Colombia Product-as-a-Service Market Outlook, by Asset Category, 2020-2033
- Colombia Product-as-a-Service Market Outlook, by Provider Type, 2020-2033
- Colombia Product-as-a-Service Market Outlook, by End Use Industry, 2020-2033
- Latin America Product-as-a-Service Market Outlook, by Model Type, Value (US$ Billion), 2020-2033
- Middle East & Africa Product-as-a-Service Market Outlook, 2020-2033
- Middle East & Africa Product-as-a-Service Market Outlook, by Model Type, Value (US$ Billion), 2020-2033
- Equipment Subscription and Rental-as-a-Service
- Pay-Per-Use Contracts
- Pay-Per-Outcome Contracts
- Managed Equipment Services
- Platform and Asset Management Software
- Middle East & Africa Product-as-a-Service Market Outlook, by Asset Category, Value (US$ Billion), 2020-2033
- Industrial Equipment and Machinery
- Medical Devices
- Information Technology Hardware
- Lighting and Building Systems
- Mobility and Vehicles
- Agricultural Equipment
- Consumer Durables
- Middle East & Africa Product-as-a-Service Market Outlook, by Provider Type, Value (US$ Billion), 2020-2033
- Original Equipment Manufacturers
- Specialist Service Providers
- Financing and Leasing Partners
- Platform Providers
- Middle East & Africa Product-as-a-Service Market Outlook, by End Use Industry, Value (US$ Billion), 2020-2033
- Manufacturing
- Healthcare
- Information Technology and Telecom
- Construction and Infrastructure
- Transport and Logistics
- Agriculture
- Retail and Consumer
- Middle East & Africa Product-as-a-Service Market Outlook, by Country and Subregion, Value (US$ Billion), 2020-2033
- Gulf states Product-as-a-Service Market Outlook, by Model Type, 2020-2033
- Gulf states Product-as-a-Service Market Outlook, by Asset Category, 2020-2033
- Gulf states Product-as-a-Service Market Outlook, by Provider Type, 2020-2033
- Gulf states Product-as-a-Service Market Outlook, by End Use Industry, 2020-2033
- Middle East & Africa Product-as-a-Service Market Outlook, by Model Type, Value (US$ Billion), 2020-2033
- Competitive Landscape
- Market Concentration and Industry Leaders
- Competitive Differentiation
- Strategic Initiatives
- Recent Industry Developments
- Company Profiles
- Signify N.V.
- Atlas Copco AB
- Rolls-Royce Holdings plc
- Siemens AG
- Koninklijke Philips N.V.
- Hewlett Packard Enterprise Company
- Dell Technologies Inc.
- HP Inc.
- Xerox Holdings Corporation
- Caterpillar Inc.
- Deere & Company
- Schneider Electric SE
- Compagnie Générale des Établissements Michelin
- Kaeser Kompressoren SE
- Appendix
- Research Methodology
- Report Assumptions
- Acronyms and Abbreviations
Model Type
- Equipment Subscription and Rental-as-a-Service
- Pay-Per-Use Contracts
- Pay-Per-Outcome Contracts
- Managed Equipment Services
- Platform and Asset Management Software
Asset Category
- Industrial Equipment and Machinery
- Medical Devices
- Information Technology Hardware
- Lighting and Building Systems
- Mobility and Vehicles
- Agricultural Equipment
- Consumer Durables
Provider Type
- Original Equipment Manufacturers
- Specialist Service Providers
- Financing and Leasing Partners
- Platform Providers
End Use Industry
- Manufacturing
- Healthcare
- Information Technology and Telecom
- Construction and Infrastructure
- Transport and Logistics
- Agriculture
- Retail and Consumer
Regions
- North America
- Europe
- Asia Pacific
- Latin America
- Middle East & Africa
Our Research Methodology
Considering the volatility of business today, traditional approaches to strategizing a game plan can be unfruitful if not detrimental. True ambiguity is no way to determine a forecast. A myriad of predetermined factors must be accounted for such as the degree of risk involved, the magnitude of circumstances, as well as conditions or consequences that are not known or unpredictable. To circumvent binary views that cast uncertainty, the application of market research intelligence to strategically posture, move, and enable actionable outcomes is necessary.
View Methodology
Quality Assured
Rigorous Validation Process

Confidentiality Assured
End-to-end Data Security

Custom Research Services
Tailored To Your Objectives
FAQs
Contract value reaches US$ 96.0 billion in 2026, covering physical-asset usage, output and availability agreements and excluding pure software subscription worldwide.
Contract value is projected to reach US$ 204.5 billion by 2033, an 11.4% CAGR that adds US$ 108.5 billion over the period.
Managed equipment services lead with 33.0% of contract value in 2026, because bundled hardware, consumables and maintenance are simplest for both parties to administer.
Mobility and vehicles grow fastest at a 14.1% CAGR to 2033, since fleet telematics already measure distance, load and driver behaviour accurately.
North America holds 36.0% of contract value in 2026, supported by routine operating expenditure procurement, deep asset finance markets and dense equipment service networks.
Related Reports
Rigid Mine Dumper Market Size, Share, Insights, Competitive Landscape, and Forecast 2026 to 2033
The global rigid mine dumper market is valued at US$9.8 billion in 2026, reaching US$14.6 billion by 2033, growing at a 5.9% CAGR
Precision Hand Tools Market Size, Share, Insights, Competitive Landscape, and Forecast 2026 to 2033
The global precision hand tools market is valued at US$9.8 billion in 2026, reaching US$14.2 billion by 2033, growing at a 5.4% CAGR
Weather RADAR Market Size, Share, Insights, Competitive Landscape, and Forecast 2026 to 2033
The Weather RADAR Market is projected to rise from US$ 297.2 million in 2026 to US$ 401.8 million by 2033 at a 4.4% CAGR. Explore key segments.
Scroll and Absorption Chillers Market Size, Share, Insights, Competitive Landscape, and Forecast 2026 to 2033
Scroll and Absorption Chillers Market grows from US$ 14.27 billion in 2026 to US$ 19.31 billion by 2033 at a 4.4% CAGR. Explore key segments and trends.
Laser Technologies in Manufacturing Market Size, Share, Insights, Competitive Landscape, and Forecast 2026 to 2033
Explore the laser technologies in manufacturing market, valued at US$ 23.6 billion in 2026 and forecast to reach US$ 38.4 billion by 2033 at 7.2% CAGR.
High Torque Stepper Motor Market Size, Share, Insights, Competitive Landscape, and Forecast 2026 to 2033
Explore the high torque stepper motor market, projected to reach US$ 3.6 billion by 2033 at a 6.6% CAGR, with product and regional insights.