



Tray Dispenser Market
Tray Dispenser Market Size, Share, Insights, Competitive Landscape, and Forecast 2026 to 2033
Report Overview
Tray Dispenser Market Size and Trend Analysis
What Is Driving Tray Dispenser Demand Through 2033?
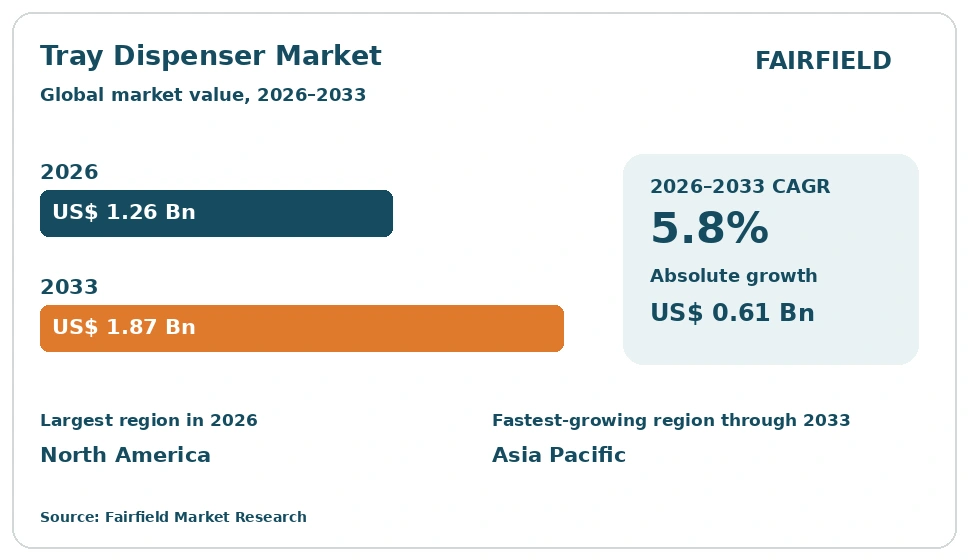
The global Tray Dispenser market size is expected to be valued at US$ 1.26 billion in 2026 and projected to reach US$ 1.87 billion by 2033, growing at a CAGR of 5.8% between 2026 and 2033. That path adds an absolute dollar opportunity of US$ 610 million over the forecast period, against a slower historical CAGR of 4.6% during 2020–2025. Growth is tied to steady meal volumes in hospitals, schools and military dining halls, where trays remain the standard serving unit. Kitchen labor shortages are pushing operators toward self-leveling, castered units that cut lifting and speed up line setup. Stainless construction and easier cleaning also support replacement of older carts.
Key Report Takeaways
- By Product Type: Mobile tray dispensers led with 41% share in 2026, while drop-in tray dispensers are projected to expand at a 6.8% CAGR through 2033, driven by new serving-counter construction in purpose-built institutional kitchens.
- By Mobility: Mobile units led with 63% share in 2026, while stationary installations are projected to expand at a 6.0% CAGR through 2033, driven by fixed buffet lines in newly built hotel and campus dining halls.
- By Capacity: The 100–200 tray range led with 45% share in 2026, while units holding above 200 trays are projected to expand at a 6.6% CAGR through 2033, driven by centralized cook-chill kitchens that serve several sites.
- By End User: Hospitals and healthcare facilities led with 33% share in 2026, while schools and universities are projected to expand at a 6.7% CAGR through 2033, driven by publicly funded meal programs and cafeteria refurbishment cycles.
- By Region: North America led with 36% share in 2026, ahead of Europe, Asia Pacific, Latin America and Middle East & Africa, while Asia Pacific is projected to expand at a 7.4% CAGR through 2033 on hospital bed additions.
Market Trends and Insights
Market Growth Drivers
Rising Institutional Meal Volumes Lift Tray Handling Equipment Demand
Hospitals, senior living homes, school districts and military bases serve meals on fixed daily cycles. Each cycle needs trays staged, dispensed and returned within a narrow service window. That repetition makes dispensers a basic line asset rather than an optional accessory. Operators buying serving counters now specify dispenser positions at the design stage, which lifts attachment rates on every new tray line. Replacement demand follows the same meal volumes, because heavy daily cycling wears springs, castors and tube guides.
Patient meal services and publicly funded school feeding programs continue to expand in most large economies. Aging populations raise inpatient days and long-term care admissions, both of which run tray-based service. Central production kitchens supplying several satellite sites multiply tray throughput per facility. Equipment distributors report consistent pull from these institutional channels, which behave less cyclically than restaurant demand and support steady order books.
Kitchen Labor Shortages Push Operators Toward Ergonomic Dispensing Units
Foodservice operators across developed markets struggle to fill kitchen and service roles. Equipment that reduces manual handling now earns clear budget priority. Self-leveling tray dispensers hold the top tray at a constant working height, so staff avoid repeated bending and lifting of heavy stacks. That lowers strain injuries and the lost time that follows them. Mobile units also let one worker move a full tray load between dish room, staging area and serving line without a second pair of hands.
Occupational safety rules in several countries set manual handling limits that make stack lifting hard to justify. Insurers and facility managers increasingly treat ergonomic equipment as a risk control, not a comfort item. Manufacturers have responded with adjustable spring sets, soft-close tubes and lighter aluminum frames. These features convert a labor problem into a specification requirement that supports steady upgrade spending.
Restraints Impact Analysis of Market
High Upfront Cost of Heated Stainless Units Limits Small Operators
Heated and insulated tray dispensers carry prices well above ambient models. Stainless steel bodies, thermostatic controls and insulated tubes all add cost, and independent restaurants rarely justify that outlay for modest covers. Many small operators keep older carts running or move to open tray shelving instead. That caps unit volumes at the lower end of the market and concentrates revenue in institutional buyers with capital budgets and multi-year replacement plans.
Stainless steel and electrical component prices have remained volatile, which keeps quoted equipment prices high and lengthens approval cycles. Public buyers often run competitive tenders that stretch purchase decisions across budget years. Smaller kitchens also lack the floor space that cabinet-style units require. Manufacturers address this with lighter ambient ranges and modular options, yet the price gap still slows adoption among independent foodservice sites.
Shift to Disposable Servingware and Grab-and-Go Formats Curbs Tray Use
Many operators have moved part of their service to disposable containers, clamshells and grab-and-go displays. Those formats remove the tray from the meal flow altogether, so no dispenser is needed at that station. Campus retail outlets, hospital cafes and corporate micro-markets have adopted the model fastest. Trayless dining programs in universities, introduced to cut food waste and dishwashing water, have also reduced tray counts per site and softened replacement demand.
Waste rules in several regions now restrict single-use plastics, which pushes some sites back toward reusable trays and warewashing. The direction is uneven, and operators often run mixed service models in the same building. Where trayless policies hold, dispenser purchases shift from fleet expansion to narrow one-for-one replacement. That dampens unit volume growth in retail dining even as the wider installed base stays broadly stable.
Market Opportunities
Retrofit Cycles in Aging Institutional Kitchens Create Replacement Revenue
A large share of hospital and school kitchens in mature markets runs equipment installed decades ago. Those sites are now scheduling serving-line refurbishment, and dispensers are replaced alongside counters, wells and warewashing lines. Retrofit projects favor suppliers who can match existing counter cut-outs and cart footprints. That gives established manufacturers a repeatable revenue stream with lower selling cost than greenfield work, since the specification is already set by the installed asset.
Public infrastructure funding for healthcare and education facilities supports this renewal activity in several countries. Hygiene expectations have tightened since recent public health events, which makes sealed, easily cleaned stainless designs an upgrade argument rather than a cost. Bodies such as NSF International and EHEDG publish hygienic design criteria that specifiers increasingly cite. Suppliers offering compliant, drop-in replacement units capture most of this refurbishment spending.
Central Production Kitchens in Emerging Markets Open New Volume Demand
Cook-chill and central production kitchens are spreading across Asia Pacific, the Middle East and parts of Latin America. One central facility plates meals for many hospitals or schools, so tray throughput per site rises sharply. These kitchens need high-capacity dispensers, insulated transport carts and matched tray formats. The result is a larger order per project and a bias toward units holding above 200 trays, which carry higher selling prices than small mobile models.
Hospital construction programs and nationwide school meal schemes anchor this build-out. Government procurement in these projects usually specifies stainless equipment and documented cleaning procedures, which favors established manufacturers over local fabricators. Local assembly partnerships and regional distribution agreements help suppliers meet lead-time and service expectations. Vendors that combine dispensers with full tray-line systems are best placed to win these multi-unit contracts.
Category-wise Insights
Which Tray Dispenser Type Leads Global Installations?
Mobile tray dispensers lead global installations with 41% share in 2026, because they suit the widest range of kitchen layouts. Castered frames let staff load trays near the dish room and roll them to any serving point, which matters in older buildings with fixed counters. Drop-in tray dispensers are the fastest-growing type at a 6.8% CAGR through 2033, as new serving counters are specified with integrated dispenser wells from the design stage. Cabinet-style units hold a steady position where heated or enclosed storage is required, particularly in patient tray assembly. Countertop and wall-mounted models stay a small niche tied to compact cafes. The split shows that market leadership rests on flexibility in existing kitchens, while growth leadership follows new construction and planned serving-line renewal.
Mobile Platforms Hold the Floor as Fixed Installations Gain Ground
Mobile dispensers account for 63% share in 2026, confirming that most buyers still want equipment they can reposition. Flexible service patterns, catered events and temporary dining setups all reward units on castors. Stationary installations are growing faster at a 6.0% CAGR through 2033, carried by purpose-built hotel buffets, campus dining halls and hospital serveries where the tray station is permanent. Fixed units allow cleaner sightlines, sealed counter joints and simpler cleaning around the dispenser base. Buyers also value the reduced floor clutter in high-traffic lines. For manufacturers, the implication is that mobile ranges protect volume while fixed and drop-in ranges capture the margin attached to new-build projects. Product portfolios that cover both formats avoid losing a specification at the design stage.
Mid-Capacity Units Match Real Serving-Line Throughput
Dispensers holding 100 to 200 trays lead with 45% share in 2026, because that range matches a typical single-service meal period in a school or ward kitchen. Operators size equipment to one service, not to the full day, so mid-capacity units balance footprint against refill frequency. Units above 200 trays are expanding fastest at a 6.6% CAGR through 2033, as centralized production kitchens plate for multiple sites in one run. Smaller units holding up to 100 trays serve cafes and satellite pantries where space is tight. The pattern tells suppliers that standard mid-range models carry volume, while high-capacity variants deliver growth and higher unit value. Capacity choice is increasingly set by the production model behind the kitchen rather than by the dining room size.
Healthcare Anchors Demand While Education Scales Faster
Hospitals and healthcare facilities hold the largest end-user share at 33% in 2026, because patient meal service is tray-based by design and runs every day of the year. Infection control rules reinforce the use of sealed stainless equipment in these sites. Schools and universities are the fastest-growing end user at a 6.7% CAGR through 2033, supported by publicly funded meal programs and steady cafeteria refurbishment. Commercial restaurants and hotels contribute a solid block of buffet-driven demand. Military and government dining remains stable, with specification-led purchasing and long replacement cycles. Corporate and industrial catering is a smaller block, renewing equipment as workplace dining volumes return. For suppliers, the healthcare channel secures the baseline order book, while education demand determines how fast the overall market expands.
Geography Analysis
Which Region Is Leading the Tray Dispenser Market?
North America leads the market with 36% share in 2026 and a forecast CAGR of 5.4% through 2033. The United States and Canada operate large hospital networks, school districts and military dining facilities that all run tray-based service. Dense distributor coverage and a mature rental and refurbishment channel shorten replacement cycles. Facility operators follow hygiene guidance aligned with NSF International standards, which pushes buyers toward certified stainless equipment rather than improvised storage. Federal and state school meal funding sustains cafeteria upgrades across public districts. Several leading manufacturers also build in the region, so lead times and spare part support are shorter than for imported units. These conditions keep the installed base large and renewal spending predictable.
Europe Replaces Aging Equipment Under Stricter Hygiene Rules
Europe holds 27% share in 2026 and is set to grow at a 5.1% CAGR through 2033, the slowest regional rate in the market. Germany, France, the United Kingdom and the Nordic countries carry most installed capacity through public hospitals and municipal school catering. Growth is renewal-led rather than expansion-led, since kitchen counts are broadly stable. Hygienic design criteria promoted by EHEDG and national food safety authorities encourage replacement of older carts with sealed, easily cleaned units. Energy efficiency rules also influence choices on heated models, nudging buyers toward better insulated cabinets. Public procurement frameworks favor suppliers who can document materials, cleaning procedures and service support across multiple sites and several budget years.
Which Region Is Growing Fastest in the Tray Dispenser Market?
Asia Pacific is the fastest-growing region, expanding at a 7.4% CAGR through 2033 from 24% share in 2026. China, India, Japan, Australia and Southeast Asian markets are adding hospital beds and building new university campuses at pace. Central production kitchens supplying several institutions are becoming common, which raises tray throughput per project and favors high-capacity dispensers. Rising organized foodservice, hotel construction and industrial canteen catering widen the buyer base beyond public institutions. Local manufacturing and regional distribution agreements have improved pricing and lead times against imported equipment. Government food safety enforcement is tightening in several markets, which shifts buyers from open tray shelving toward enclosed, cleanable dispensing units in both new and existing kitchens.
Latin America Builds Out Hospital and School Catering Capacity
Latin America accounts for 7% share in 2026 with a forecast CAGR of 5.6% through 2033. Brazil and Mexico supply most demand through public hospital systems, national school feeding programs and a growing contract catering sector. Mining and industrial site canteens add a steady specialist requirement in Chile and Peru. Purchasing decisions are price sensitive, so ambient mobile units outsell heated cabinets by a wide margin. Currency movement and import duties influence whether buyers choose imported stainless equipment or local fabrication. Regional distributors increasingly stock standard models to shorten delivery times, which helps convert tenders that previously stalled on lead times. Refurbishment of aging public kitchens is the main source of incremental orders.
Middle East & Africa Demand Follows Healthcare and Hospitality Projects
Middle East & Africa holds 6% share in 2026 and is forecast to grow at a 6.0% CAGR through 2033. Saudi Arabia, the United Arab Emirates and Qatar drive most spending through hospital construction, large hotel openings and labor accommodation catering. Project-based procurement dominates, so orders arrive in large packages tied to building completion schedules. Specifications usually follow international hygiene standards, which favors established exporters with documentation and local service partners. South Africa supports demand in the wider region through hospital and campus catering. Elsewhere in Africa, equipment spending is constrained by budgets and power reliability, so ambient mobile units dominate. Pilgrimage and large event catering also create seasonal demand for high-capacity tray handling equipment.
Competitive Landscape
The market is moderately fragmented, with a core group of specialist foodservice equipment manufacturers holding durable positions in institutional channels. Several of these firms sit within larger equipment groups, which gives them shared distribution, sourcing scale and engineering resources. Independent fabricators remain active in regional and custom work, particularly where counter dimensions are non-standard. Ownership consolidation among foodservice equipment groups has gradually widened the gap between full-line suppliers and single-product makers. The pattern signals a market that rewards breadth of serving-line capability more than dispenser specialization alone.
Competition centers on practical attributes rather than headline technology. Buyers compare stainless grade and weld quality, spring adjustment range, castor durability, tube cleanability and the accuracy of self-leveling action under mixed tray weights. Heated models add insulation performance and control reliability to the comparison. Compatibility with common tray sizes and with existing counter cut-outs often decides a retrofit order. Newer entrants compete on lighter frames, modular tube sets and simpler field service, which appeals to operators with limited maintenance staff.
Strategic activity concentrates on product range extension, distribution depth and service capability. Manufacturers broaden ambient and heated lines so a single supplier can cover an entire tray station, which protects specifications at the design stage. Investment in regional stocking and parts availability matters because institutional buyers value uptime over purchase price. Engineering effort increasingly targets hygienic design, tool-free disassembly and corrosion resistance, all of which shorten cleaning time in high-cycle kitchens.
Vendor direction is converging on integrated serving-line offers, documented hygienic design and faster aftermarket support. Fairfield Market Research observes that suppliers combining dispensers with carts, counters and transport systems are best positioned for multi-unit institutional contracts.
Industry Leaders
- Lakeside Manufacturing, Inc.
- Carter-Hoffmann LLC
- Piper Products, Inc.
- Cres Cor
- Duke Manufacturing Co., Inc.
- The Delfield Company
- Cambro Manufacturing Company
- The Vollrath Company, LLC
Companies Covered in the Report
- Lakeside Manufacturing, Inc.
- Carter-Hoffmann LLC
- Piper Products, Inc.
- Cres Cor
- Duke Manufacturing Co., Inc.
- The Delfield Company
- Cambro Manufacturing Company
- The Vollrath Company, LLC
- Dinex International
- Caddy Corporation
- Atlas Metal Industries, Inc.
- Eagle Group
- Advance Tabco
- Food Warming Equipment Company, Inc.
- Alluserv
- Hatco Corporation
- InterMetro Industries Corporation
- Victor Manufacturing Group
Tray Dispenser Market Report Scope
The market is segmented by product type, mobility, capacity and end user, across five global regions.
| By Product Type | Mobile Tray Dispensers, Drop-in Tray Dispensers, Cabinet-style Tray Dispensers, Countertop and Wall-mounted Tray Dispensers |
| By Mobility | Mobile, Stationary |
| By Capacity | Up to 100 Trays, 100 to 200 Trays, Above 200 Trays |
| By End User | Hospitals and Healthcare Facilities, Schools and Universities, Commercial Restaurants and Hotels, Military and Government Dining, Corporate and Industrial Catering |
| By Region | North America, Europe, Asia Pacific, Latin America, Middle East & Africa |
1. Executive Summary
1.1 Tray Dispenser Market Snapshot
1.2 Future Projections
1.3 Key Industry Highlights
1.4 Geographical Snapshot
2. Market Overview
2.1 Market Definition and Segmentation
2.2 Historical Market Trends
2.3 Market Dynamics
2.3.1 Drivers
2.3.1.1 Rising Institutional Meal Volumes Lift Tray Handling Equipment Demand
2.3.1.2 Kitchen Labor Shortages Push Operators Toward Ergonomic Dispensing Units
2.3.2 Restraints
2.3.2.1 High Upfront Cost of Heated Stainless Units Limits Small Operators
2.3.2.2 Shift to Disposable Servingware and Grab-and-Go Formats Curbs Tray Use
2.3.3 Market Opportunities
2.3.3.1 Retrofit Cycles in Aging Institutional Kitchens Create Replacement Revenue
2.3.3.2 Central Production Kitchens in Emerging Markets Open New Volume Demand
3. Global Tray Dispenser Market Outlook, 2026–2033
3.1 Global Tray Dispenser Market Outlook, by Product Type, Value (US$ Billion), 2026–2033
3.1.1 Mobile Tray Dispensers
3.1.2 Drop-in Tray Dispensers
3.1.3 Cabinet-style Tray Dispensers
3.1.4 Countertop and Wall-mounted Tray Dispensers
3.2 Global Tray Dispenser Market Outlook, by Mobility, Value (US$ Billion), 2026–2033
3.2.1 Mobile
3.2.2 Stationary
3.3 Global Tray Dispenser Market Outlook, by Capacity, Value (US$ Billion), 2026–2033
3.3.1 Up to 100 Trays
3.3.2 100 to 200 Trays
3.3.3 Above 200 Trays
3.4 Global Tray Dispenser Market Outlook, by End User, Value (US$ Billion), 2026–2033
3.4.1 Hospitals and Healthcare Facilities
3.4.2 Schools and Universities
3.4.3 Commercial Restaurants and Hotels
3.4.4 Military and Government Dining
3.4.5 Corporate and Industrial Catering
3.5 Global Tray Dispenser Market Outlook, by Region, Value (US$ Billion), 2026–2033
3.5.1 North America
3.5.2 Europe
3.5.3 Asia Pacific
3.5.4 Latin America
3.5.5 Middle East & Africa
4. North America Tray Dispenser Market Outlook, 2026–2033
4.1 North America Tray Dispenser Market Outlook, by Product Type, Value (US$ Billion), 2026–2033
4.1.1 Mobile Tray Dispensers
4.1.2 Drop-in Tray Dispensers
4.1.3 Cabinet-style Tray Dispensers
4.1.4 Countertop and Wall-mounted Tray Dispensers
4.2 North America Tray Dispenser Market Outlook, by Mobility, Value (US$ Billion), 2026–2033
4.2.1 Mobile
4.2.2 Stationary
4.3 North America Tray Dispenser Market Outlook, by Capacity, Value (US$ Billion), 2026–2033
4.3.1 Up to 100 Trays
4.3.2 100 to 200 Trays
4.3.3 Above 200 Trays
4.4 North America Tray Dispenser Market Outlook, by End User, Value (US$ Billion), 2026–2033
4.4.1 Hospitals and Healthcare Facilities
4.4.2 Schools and Universities
4.4.3 Commercial Restaurants and Hotels
4.4.4 Military and Government Dining
4.4.5 Corporate and Industrial Catering
4.5 North America Tray Dispenser Market Outlook, by Country, Value (US$ Billion), 2026–2033
4.5.1 United States Tray Dispenser Market Outlook, by Product Type, 2026–2033
4.5.2 United States Tray Dispenser Market Outlook, by Mobility, 2026–2033
4.5.3 United States Tray Dispenser Market Outlook, by Capacity, 2026–2033
4.5.4 United States Tray Dispenser Market Outlook, by End User, 2026–2033
4.5.5 Canada Tray Dispenser Market Outlook, by Product Type, 2026–2033
4.5.6 Canada Tray Dispenser Market Outlook, by Mobility, 2026–2033
4.5.7 Canada Tray Dispenser Market Outlook, by Capacity, 2026–2033
4.5.8 Canada Tray Dispenser Market Outlook, by End User, 2026–2033
5. Europe Tray Dispenser Market Outlook, 2026–2033
5.1 Europe Tray Dispenser Market Outlook, by Product Type, Value (US$ Billion), 2026–2033
5.1.1 Mobile Tray Dispensers
5.1.2 Drop-in Tray Dispensers
5.1.3 Cabinet-style Tray Dispensers
5.1.4 Countertop and Wall-mounted Tray Dispensers
5.2 Europe Tray Dispenser Market Outlook, by Mobility, Value (US$ Billion), 2026–2033
5.2.1 Mobile
5.2.2 Stationary
5.3 Europe Tray Dispenser Market Outlook, by Capacity, Value (US$ Billion), 2026–2033
5.3.1 Up to 100 Trays
5.3.2 100 to 200 Trays
5.3.3 Above 200 Trays
5.4 Europe Tray Dispenser Market Outlook, by End User, Value (US$ Billion), 2026–2033
5.4.1 Hospitals and Healthcare Facilities
5.4.2 Schools and Universities
5.4.3 Commercial Restaurants and Hotels
5.4.4 Military and Government Dining
5.4.5 Corporate and Industrial Catering
5.5 Europe Tray Dispenser Market Outlook, by Country and Subregion, Value (US$ Billion), 2026–2033
5.5.1 Germany Tray Dispenser Market Outlook, by Product Type, 2026–2033
5.5.2 Germany Tray Dispenser Market Outlook, by Mobility, 2026–2033
5.5.3 Germany Tray Dispenser Market Outlook, by Capacity, 2026–2033
5.5.4 Germany Tray Dispenser Market Outlook, by End User, 2026–2033
5.5.5 France Tray Dispenser Market Outlook, by Product Type, 2026–2033
5.5.6 France Tray Dispenser Market Outlook, by Mobility, 2026–2033
5.5.7 France Tray Dispenser Market Outlook, by Capacity, 2026–2033
5.5.8 France Tray Dispenser Market Outlook, by End User, 2026–2033
5.5.9 United Kingdom Tray Dispenser Market Outlook, by Product Type, 2026–2033
5.5.10 United Kingdom Tray Dispenser Market Outlook, by Mobility, 2026–2033
5.5.11 United Kingdom Tray Dispenser Market Outlook, by Capacity, 2026–2033
5.5.12 United Kingdom Tray Dispenser Market Outlook, by End User, 2026–2033
5.5.13 Nordic countries Tray Dispenser Market Outlook, by Product Type, 2026–2033
5.5.14 Nordic countries Tray Dispenser Market Outlook, by Mobility, 2026–2033
5.5.15 Nordic countries Tray Dispenser Market Outlook, by Capacity, 2026–2033
5.5.16 Nordic countries Tray Dispenser Market Outlook, by End User, 2026–2033
6. Asia Pacific Tray Dispenser Market Outlook, 2026–2033
6.1 Asia Pacific Tray Dispenser Market Outlook, by Product Type, Value (US$ Billion), 2026–2033
6.1.1 Mobile Tray Dispensers
6.1.2 Drop-in Tray Dispensers
6.1.3 Cabinet-style Tray Dispensers
6.1.4 Countertop and Wall-mounted Tray Dispensers
6.2 Asia Pacific Tray Dispenser Market Outlook, by Mobility, Value (US$ Billion), 2026–2033
6.2.1 Mobile
6.2.2 Stationary
6.3 Asia Pacific Tray Dispenser Market Outlook, by Capacity, Value (US$ Billion), 2026–2033
6.3.1 Up to 100 Trays
6.3.2 100 to 200 Trays
6.3.3 Above 200 Trays
6.4 Asia Pacific Tray Dispenser Market Outlook, by End User, Value (US$ Billion), 2026–2033
6.4.1 Hospitals and Healthcare Facilities
6.4.2 Schools and Universities
6.4.3 Commercial Restaurants and Hotels
6.4.4 Military and Government Dining
6.4.5 Corporate and Industrial Catering
6.5 Asia Pacific Tray Dispenser Market Outlook, by Country, Value (US$ Billion), 2026–2033
6.5.1 China Tray Dispenser Market Outlook, by Product Type, 2026–2033
6.5.2 China Tray Dispenser Market Outlook, by Mobility, 2026–2033
6.5.3 China Tray Dispenser Market Outlook, by Capacity, 2026–2033
6.5.4 China Tray Dispenser Market Outlook, by End User, 2026–2033
6.5.5 India Tray Dispenser Market Outlook, by Product Type, 2026–2033
6.5.6 India Tray Dispenser Market Outlook, by Mobility, 2026–2033
6.5.7 India Tray Dispenser Market Outlook, by Capacity, 2026–2033
6.5.8 India Tray Dispenser Market Outlook, by End User, 2026–2033
6.5.9 Japan Tray Dispenser Market Outlook, by Product Type, 2026–2033
6.5.10 Japan Tray Dispenser Market Outlook, by Mobility, 2026–2033
6.5.11 Japan Tray Dispenser Market Outlook, by Capacity, 2026–2033
6.5.12 Japan Tray Dispenser Market Outlook, by End User, 2026–2033
6.5.13 Australia Tray Dispenser Market Outlook, by Product Type, 2026–2033
6.5.14 Australia Tray Dispenser Market Outlook, by Mobility, 2026–2033
6.5.15 Australia Tray Dispenser Market Outlook, by Capacity, 2026–2033
6.5.16 Australia Tray Dispenser Market Outlook, by End User, 2026–2033
7. Latin America Tray Dispenser Market Outlook, 2026–2033
7.1 Latin America Tray Dispenser Market Outlook, by Product Type, Value (US$ Billion), 2026–2033
7.1.1 Mobile Tray Dispensers
7.1.2 Drop-in Tray Dispensers
7.1.3 Cabinet-style Tray Dispensers
7.1.4 Countertop and Wall-mounted Tray Dispensers
7.2 Latin America Tray Dispenser Market Outlook, by Mobility, Value (US$ Billion), 2026–2033
7.2.1 Mobile
7.2.2 Stationary
7.3 Latin America Tray Dispenser Market Outlook, by Capacity, Value (US$ Billion), 2026–2033
7.3.1 Up to 100 Trays
7.3.2 100 to 200 Trays
7.3.3 Above 200 Trays
7.4 Latin America Tray Dispenser Market Outlook, by End User, Value (US$ Billion), 2026–2033
7.4.1 Hospitals and Healthcare Facilities
7.4.2 Schools and Universities
7.4.3 Commercial Restaurants and Hotels
7.4.4 Military and Government Dining
7.4.5 Corporate and Industrial Catering
7.5 Latin America Tray Dispenser Market Outlook, by Country, Value (US$ Billion), 2026–2033
7.5.1 Brazil Tray Dispenser Market Outlook, by Product Type, 2026–2033
7.5.2 Brazil Tray Dispenser Market Outlook, by Mobility, 2026–2033
7.5.3 Brazil Tray Dispenser Market Outlook, by Capacity, 2026–2033
7.5.4 Brazil Tray Dispenser Market Outlook, by End User, 2026–2033
7.5.5 Mexico Tray Dispenser Market Outlook, by Product Type, 2026–2033
7.5.6 Mexico Tray Dispenser Market Outlook, by Mobility, 2026–2033
7.5.7 Mexico Tray Dispenser Market Outlook, by Capacity, 2026–2033
7.5.8 Mexico Tray Dispenser Market Outlook, by End User, 2026–2033
7.5.9 Chile Tray Dispenser Market Outlook, by Product Type, 2026–2033
7.5.10 Chile Tray Dispenser Market Outlook, by Mobility, 2026–2033
7.5.11 Chile Tray Dispenser Market Outlook, by Capacity, 2026–2033
7.5.12 Chile Tray Dispenser Market Outlook, by End User, 2026–2033
7.5.13 Peru Tray Dispenser Market Outlook, by Product Type, 2026–2033
7.5.14 Peru Tray Dispenser Market Outlook, by Mobility, 2026–2033
7.5.15 Peru Tray Dispenser Market Outlook, by Capacity, 2026–2033
7.5.16 Peru Tray Dispenser Market Outlook, by End User, 2026–2033
8. Middle East & Africa Tray Dispenser Market Outlook, 2026–2033
8.1 Middle East & Africa Tray Dispenser Market Outlook, by Product Type, Value (US$ Billion), 2026–2033
8.1.1 Mobile Tray Dispensers
8.1.2 Drop-in Tray Dispensers
8.1.3 Cabinet-style Tray Dispensers
8.1.4 Countertop and Wall-mounted Tray Dispensers
8.2 Middle East & Africa Tray Dispenser Market Outlook, by Mobility, Value (US$ Billion), 2026–2033
8.2.1 Mobile
8.2.2 Stationary
8.3 Middle East & Africa Tray Dispenser Market Outlook, by Capacity, Value (US$ Billion), 2026–2033
8.3.1 Up to 100 Trays
8.3.2 100 to 200 Trays
8.3.3 Above 200 Trays
8.4 Middle East & Africa Tray Dispenser Market Outlook, by End User, Value (US$ Billion), 2026–2033
8.4.1 Hospitals and Healthcare Facilities
8.4.2 Schools and Universities
8.4.3 Commercial Restaurants and Hotels
8.4.4 Military and Government Dining
8.4.5 Corporate and Industrial Catering
8.5 Middle East & Africa Tray Dispenser Market Outlook, by Country, Value (US$ Billion), 2026–2033
8.5.1 Saudi Arabia Tray Dispenser Market Outlook, by Product Type, 2026–2033
8.5.2 Saudi Arabia Tray Dispenser Market Outlook, by Mobility, 2026–2033
8.5.3 Saudi Arabia Tray Dispenser Market Outlook, by Capacity, 2026–2033
8.5.4 Saudi Arabia Tray Dispenser Market Outlook, by End User, 2026–2033
8.5.5 United Arab Emirates Tray Dispenser Market Outlook, by Product Type, 2026–2033
8.5.6 United Arab Emirates Tray Dispenser Market Outlook, by Mobility, 2026–2033
8.5.7 United Arab Emirates Tray Dispenser Market Outlook, by Capacity, 2026–2033
8.5.8 United Arab Emirates Tray Dispenser Market Outlook, by End User, 2026–2033
8.5.9 Qatar Tray Dispenser Market Outlook, by Product Type, 2026–2033
8.5.10 Qatar Tray Dispenser Market Outlook, by Mobility, 2026–2033
8.5.11 Qatar Tray Dispenser Market Outlook, by Capacity, 2026–2033
8.5.12 Qatar Tray Dispenser Market Outlook, by End User, 2026–2033
8.5.13 South Africa Tray Dispenser Market Outlook, by Product Type, 2026–2033
8.5.14 South Africa Tray Dispenser Market Outlook, by Mobility, 2026–2033
8.5.15 South Africa Tray Dispenser Market Outlook, by Capacity, 2026–2033
8.5.16 South Africa Tray Dispenser Market Outlook, by End User, 2026–2033
9. Competitive Landscape
9.1 Industry Leaders
9.2 Company Profiles
9.2.1 Lakeside Manufacturing, Inc.
9.2.2 Carter-Hoffmann LLC
9.2.3 Piper Products, Inc.
9.2.4 Cres Cor
9.2.5 Duke Manufacturing Co., Inc.
9.2.6 The Delfield Company
9.2.7 Cambro Manufacturing Company
9.2.8 The Vollrath Company, LLC
9.2.9 Dinex International
9.2.10 Caddy Corporation
9.2.11 Atlas Metal Industries, Inc.
9.2.12 Eagle Group
9.2.13 Advance Tabco
9.2.14 Food Warming Equipment Company, Inc.
9.2.15 Alluserv
9.2.16 Hatco Corporation
9.2.17 InterMetro Industries Corporation
9.2.18 Victor Manufacturing Group
10. Appendix
10.1 Research Methodology
10.2 Report Assumptions
10.3 Acronyms and Abbreviations
| By Product Type | Mobile Tray Dispensers, Drop-in Tray Dispensers, Cabinet-style Tray Dispensers, Countertop and Wall-mounted Tray Dispensers |
| By Mobility | Mobile, Stationary |
| By Capacity | Up to 100 Trays, 100 to 200 Trays, Above 200 Trays |
| By End User | Hospitals and Healthcare Facilities, Schools and Universities, Commercial Restaurants and Hotels, Military and Government Dining, Corporate and Industrial Catering |
| By Region | North America, Europe, Asia Pacific, Latin America, Middle East & Africa |
Our Research Methodology
Considering the volatility of business today, traditional approaches to strategizing a game plan can be unfruitful if not detrimental. True ambiguity is no way to determine a forecast. A myriad of predetermined factors must be accounted for such as the degree of risk involved, the magnitude of circumstances, as well as conditions or consequences that are not known or unpredictable. To circumvent binary views that cast uncertainty, the application of market research intelligence to strategically posture, move, and enable actionable outcomes is necessary.
View Methodology
Quality Assured
Rigorous Validation Process

Confidentiality Assured
End-to-end Data Security

Custom Research Services
Tailored To Your Objectives
FAQs
The market is valued at US$ 1.26 billion in 2026, supported by steady tray-based meal service across hospitals, schools and military dining facilities worldwide.
The market is projected to reach US$ 1.87 billion by 2033, growing at a CAGR of 5.8% and adding US$ 610 million in absolute value.
Mobile tray dispensers lead with 41% share in 2026, because castered units move easily between dish rooms, staging areas and serving lines in existing kitchens.
Schools and universities grow fastest at a 6.7% CAGR through 2033, supported by publicly funded meal programs and continuing cafeteria refurbishment across education systems.
North America leads with 36% share in 2026, helped by large hospital networks, school district catering and strong distributor and replacement part coverage.
Related Reports
Heating Radiator Market Size, Share, Insights, Competitive Landscape, and Forecast 2026 to 2033
The global heating radiator market is valued at US$8.4 billion in 2026, reaching US$12.0 billion by 2033, growing at a 5.2% CAGR
Fermenters Market Size, Share, Insights, Competitive Landscape, and Forecast 2026 to 2033
The global fermenters market is valued at US$2.0 billion in 2026, reaching US$2.87 billion by 2033, growing at a 5.3% CAGR
Diamond Tools Market Size, Share, Insights, Competitive Landscape, and Forecast 2026 to 2033
The global diamond tools market is valued at US$11.2 billion in 2026, reaching US$16.8 billion by 2033, growing at a 6.0% CAGR
CO2 Glass Tube Laser Market Size, Share, Insights, Competitive Landscape, and Forecast 2026 to 2033
The global CO2 glass tube laser market is valued at US$0.78 billion in 2026, reaching US$1.18 billion by 2033, growing at a 6.1% CAGR
Die Cut Box Market Size, Share, Insights, Competitive Landscape, and Forecast 2026 to 2033
Explore the die cut box market outlook for 2026–2033, including box styles, materials, printing trends, regional demand, and competitive insights.
Pre-Engineered Buildings Market Size, Share, Insights, Competitive Landscape, and Forecast 2026 to 2033
The pre-engineered buildings market is projected to grow from US$22.4 billion in 2026 to US$43.1 billion by 2033 at a 9.8% CAGR.