



3D Display Market
3D Display Market Size, Share, Insights, Competitive Landscape, and Forecast 2026 to 2033
3D Display Market Size and Trend Analysis
What Is Driving 3D Display Market Growth Through 2033?
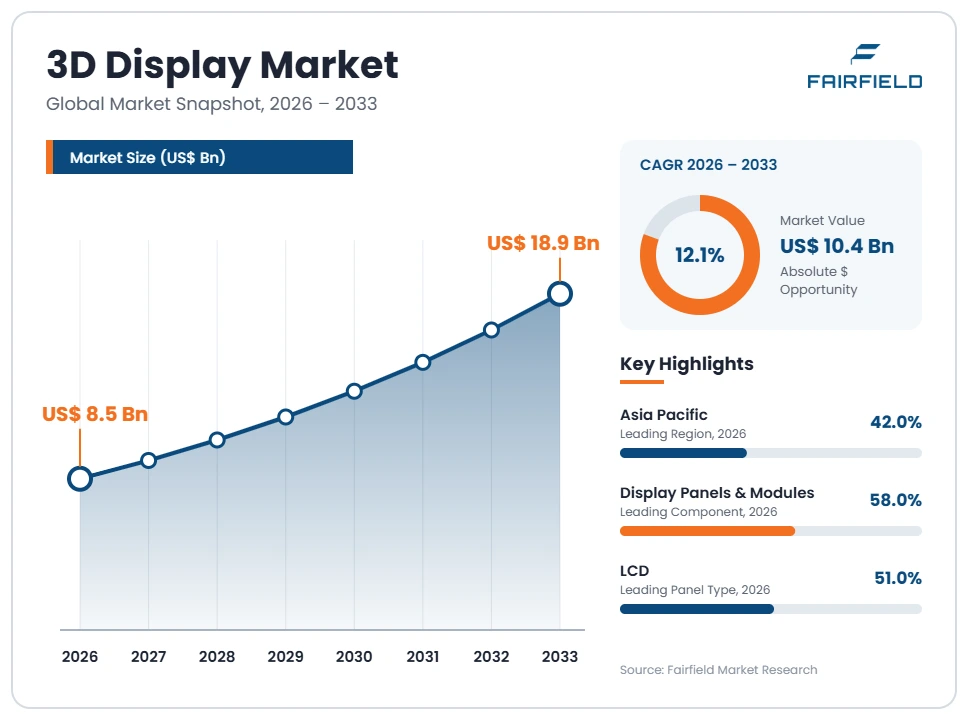
The global 3D Display market size is expected to be valued at US$ 8.5 billion in 2026 and projected to reach US$ 18.9 billion by 2033, growing at a CAGR of 12.1% between 2026 and 2033.
Revenue rose from roughly US$ 5.3 billion in 2020 to about US$ 7.7 billion in 2025, a historical CAGR of 7.8%. This estimate counts finished display systems, including panels, optical layers, drive electronics and enclosures, rather than bare panel shipments alone. Growth now comes from professional buyers, not households. Diagnostic imaging, design and engineering review, simulation, glasses-free advertising screens and automotive instrument clusters supply most demand. The consumer three-dimensional television wave of the previous decade was launched widely and then withdrawn by major manufacturers after weak sales, so the current forecast assumes no consumer revival and rests on applications where depth perception has measurable task value.
Key Report Takeaways
- By Display Technology: Stereoscopic Displays held 44% share in 2026, while Light Field Displays are projected to expand at a 16.8% CAGR through 2033, as multi-view rendering removes the headgear that limits professional review sessions and clinical use.
- By Panel Type: LCD held 51% share in 2026, while MicroLED is projected to expand at a 18.4% CAGR through 2033, driven by brightness levels that keep glasses-free depth effects visible in daylit retail and transport environments.
- By Application: Digital Signage & Advertising held 26% share in 2026, while Automotive Displays are projected to expand at a 18.2% CAGR through 2033, supported by instrument clusters that place warnings at different apparent depths.
- By Component: Display Panels & Modules held 58% share in 2026, while Software & Content Tools are projected to expand at a 15.9% CAGR through 2033, because every installation needs depth authoring, calibration and real-time view synthesis.
- By Geography: Asia Pacific held 42% share in 2026, while Middle East & Africa is projected to expand at a 15.0% CAGR through 2033, reflecting flagship retail and transport projects that buy large glasses-free display walls.
Global 3D Display Market Trends and Insights
Drivers Impact Analysis
Two demand sources account for most forecast growth in stereoscopic and glasses-free display systems.
| Driver | Impact on CAGR Forecast | Geographic Relevance | Impact Timeline |
| Professional visualisation needs in medical imaging and engineering review | High | North America, Europe | Medium term (2–4 years) |
| Glasses-free LED advertising walls in retail and transport hubs | Medium | Asia Pacific, Middle East & Africa | Short term (≤2 years) |
Depth Perception in Surgical and Engineering Review Sustains Professional Display Demand
Professional users buy depth because it shortens tasks and reduces error, which makes this the most durable demand pool in the market. Surgeons reviewing vascular structures, radiologists assessing tomographic volumes and engineers checking assembly clearances all work with data that is natively three-dimensional. Flattening it onto a conventional monitor forces mental reconstruction, and the displays that remove that step command prices no consumer product could support.
The mechanism is workflow integration rather than novelty. Diagnostic workstations must meet the greyscale calibration behaviour defined in DICOM Part 14, and displays intended for primary interpretation follow FDA clearance pathways in the United States, which creates a qualified supplier base with few credible alternatives. Minimally invasive surgical systems already deliver stereoscopic views to the operator, normalising depth in clinical practice. Computer-aided design review rooms and simulation suites extend the same expectation into automotive, aerospace and energy engineering teams.
Glasses-Free LED Advertising Walls Convert Depth Into Measurable Footfall
Large corner-mounted LED screens running forced-perspective depth content have given the industry its first genuinely commercial consumer-facing success. Advertisers buy these placements because the illusion stops pedestrians and generates social media reshares, which can be measured and priced. Media owners therefore treat the installation as a revenue asset rather than a technology experiment, and that changes the purchasing conversation entirely.
The causal mechanism is simple: the effect works without glasses, without per-viewer tracking and from a wide range of standing positions, because it relies on anamorphic content mapped to a folded screen rather than on parallax optics. That removes the viewing-position constraints that limit lenticular panels. Falling direct-view LED pixel-pitch costs allow the very high resolutions these installations need, while HDMI and VESA DisplayPort transport specifications supply the bandwidth to drive multi-panel canvases from a single media server.
Restraints Impact Analysis
Two constraints have repeatedly stalled three-dimensional display adoption beyond professional niches.
| Restraint | Impact on CAGR Forecast | Geographic Relevance | Impact Timeline |
| Shortage of native depth content and authoring tools | High | Global | Long term (≥4 years) |
| Viewing comfort limits from crosstalk and accommodation conflict | High | Global | Medium term (2–4 years) |
Thin Native Content Libraries Restrict 3D Display Sales Beyond Captive Workflows
Content scarcity is the reason three-dimensional displays sell well where the data is already volumetric and poorly everywhere else. Medical scanners, computer-aided design systems and simulators generate depth information as a by-product, so the display adds value immediately. Entertainment, broadcast and general productivity content does not, and conversion from two-dimensional sources produces visible artefacts that trained viewers reject.
The underlying cause is production cost and tooling. Capturing or authoring multi-view content needs calibrated camera arrays or depth-aware rendering pipelines, plus storage and bandwidth several times that of conventional video. Coding work under MPEG immersive video addresses transport efficiency for light field and volumetric material, but standardised compression does not create a catalogue. Without recurring content, screens become expensive single-purpose installations, so media owners and broadcasters limit purchases to campaign-length deployments rather than permanent infrastructure.
Visual Fatigue and Crosstalk Cap Session Length and Deployment Scale
Viewing comfort directly limits how long people use these displays, and therefore which applications can justify them. Stereoscopic systems force the eyes to converge at one distance while focusing at the screen plane, a mismatch that produces headaches and eye strain during extended sessions. Glasses-free panels add a further problem, because viewers drifting outside the designed viewing zones see ghosted or inverted images.
The technical cause is optical and geometric. Lenticular lens arrays and parallax barriers divide panel resolution across multiple views, so a glasses-free screen delivers a fraction of its native pixel count per eye and shows crosstalk between adjacent views. Measurement practice under the ICDM Information Display Measurement Standard quantifies these effects, but quantification does not remove them. Eye-tracked steering helps single-viewer workstations and vehicle clusters, yet it does not scale to audiences in classrooms, cinemas or signage environments.
Market Opportunities
Two revenue pools are opening outside the established professional and signage installations.
Automotive Instrument Clusters Open a High-Volume Depth Display Programme Pool
Vehicle interiors represent the only application capable of taking glasses-free displays to automotive production volumes. A depth-capable cluster can place collision warnings, navigation arrows and lane guidance at different apparent distances, giving drivers a faster read than a flat panel. Programme awards run for years at tens of thousands of units monthly, which is a different revenue profile from the project-based systems that dominate today.
Panel makers and tier-one display integrators are positioned to capture this, since they already supply cluster modules and meet the durability, temperature and optical requirements that vehicle qualification demands. Demand comes from premium brands differentiating cabin experience and from regulators pushing clearer driver warnings. Eye-tracking cameras already fitted for driver monitoring can steer the viewing zone to the driver’s head position, which solves the single-viewer limitation that blocks glasses-free technology elsewhere.
Light Field Surgical Planning Systems Create a Clinical Revenue Stream Beyond Radiology
Light field displays for surgical planning and medical education open a clinical pool distinct from diagnostic radiology monitors. These systems let a team stand around a shared volumetric rendering of a patient’s anatomy without headsets, which suits pre-operative planning meetings, tumour boards and implant design discussions where several clinicians must see the same structure simultaneously.
Specialist display makers partnering with imaging software vendors are best placed to serve it, because value lies in the segmentation and rendering pipeline as much as in the optics. Demand comes from surgical departments, teaching hospitals and medical device companies that design patient-specific implants. Growth in volumetric imaging data from computed tomography and magnetic resonance systems supplies ready content, and MPEG immersive video coding work provides a route to store and transmit these datasets between institutions efficiently.
Segment Analysis
- By Display Technology: Stereoscopic Systems Lead While Light Field Displays Build Momentum
Stereoscopic Displays held 44% share in 2026, the largest position, because glasses-based systems deliver full panel resolution to each eye at predictable cost. Professional simulation suites, surgical visualisation towers, engineering review walls and cinema projection all rely on them, and the eyewear that consumers rejected is accepted in controlled professional settings. Light Field Displays are the fastest-growing technology at a 16.8% CAGR to 2033, because multi-view rendering lets several people share a depth image without headgear, which suits collaborative review. Autostereoscopic Displays remain the largest glasses-free category, used in signage and single-viewer workstations, while Volumetric & Holographic Displays stay confined to research, exhibitions and specialist visualisation. The business implication is that suppliers should not expect one technology to converge: glasses-based systems will keep winning on resolution and cost, while light field competes on shared viewing.
- By Panel Type: LCD Retains Dominance While MicroLED Expands Quickest
LCD accounted for 51% of the market in 2026, reflecting mature supply, stable pricing and a wide range of panel sizes suited to medical monitors, engineering displays and lenticular signage. Its resolution density matters especially for glasses-free optics, which divide native pixels across views. MicroLED is the fastest-growing panel type at a 18.4% CAGR through 2033, driven by brightness and contrast that keep depth effects legible in daylit shopping streets, airport concourses and vehicle cabins, plus a form factor that tolerates curved and folded screen geometries. Direct-view LED underpins the large advertising walls that generate much of today’s visible activity, while OLED serves premium medical and automotive panels where black level and viewing angle matter. For buyers, panel choice increasingly follows ambient light conditions rather than headline specification.
- By Application: Digital Signage Leads Spending While Automotive Displays Grow Fastest
Digital Signage & Advertising held 26% share in 2026, the largest application, because glasses-free LED installations in flagship retail, transport hubs and entertainment districts carry high ticket prices and clear advertising returns. Medical Imaging & Diagnostics follows and generates the most defensible margins, supported by DICOM calibration requirements and clearance obligations for interpretation displays. Automotive Displays are the fastest-growing application at a 18.2% CAGR to 2033, as instrument clusters and head-up systems adopt depth cues for warnings and navigation. Design & Engineering Visualization and Simulation & Training provide steady institutional demand from automotive, aerospace, defence and energy organisations. Consumer Devices remain the weakest segment after the withdrawal of three-dimensional television, limited now to handheld and portrait-format niche products. The implication is that volume and margin sit in different segments, requiring different go-to-market models.
- By Component: Panels and Modules Hold the Largest Share While Content Software Accelerates
Display Panels & Modules represented 58% of value in 2026, since the panel plus its optical layer is the costliest element of any system and most integrators buy it rather than build it. Optical Films & Lens Arrays, covering lenticular sheets, parallax barriers and diffuser stacks, form a smaller but technically decisive component where precision alignment determines image quality. Controllers & Processors handle view synthesis, eye tracking and multi-panel synchronisation, and their capability sets the achievable refresh rate. Software & Content Tools is the fastest-growing component at a 15.9% CAGR through 2033, because every deployment needs depth authoring, calibration routines and real-time rendering, and buyers increasingly pay for these as recurring licences. The implication for vendors is that durable margin is migrating from glass toward the software layer that makes the glass usable.
Geography Analysis
- North America Anchors Professional and Clinical Display Demand
North America holds 27% share in 2026, the second-largest regional position, and buys the highest-value systems in the industry. The United States dominates, with demand from hospital networks, medical device companies, defence simulation programmes and automotive and aerospace engineering centres. Displays used for primary diagnostic interpretation follow FDA clearance pathways, and purchasers specify compliance with the DICOM greyscale display function, which supports premium pricing and long replacement cycles. Canada contributes through simulation, visualisation research and energy sector modelling. The region manufactures few panels, so value accrues to system integrators, software developers and clinical specialists rather than glass producers. The clearest opportunity is light field adoption in surgical planning and teaching hospitals, where several clinicians need to examine the same volumetric dataset without headsets during a single meeting.
- Europe Prioritises Engineering Visualisation and Automotive Cabin Programmes
Europe accounts for 21% share in 2026, with demand concentrated in Germany, France, the United Kingdom, Italy and the Nordic countries. Automotive engineering is the defining use case: vehicle manufacturers and their design consultancies operate large stereoscopic review walls and powerwalls for styling and ergonomics assessment, and the same companies are now specifying depth-capable instrument clusters for production vehicles. Aerospace, rail and industrial equipment makers use comparable visualisation suites. Medical demand is steady but procurement is slower, since public hospital systems replace imaging workstations on long cycles. Display manufacturing capacity is limited, so the region’s suppliers compete on optics, calibration, projection systems and integration rather than panel production. Regulatory attention to energy labelling and product durability also pushes buyers toward systems with documented lifetime and serviceability.
- Which Region Is Leading the 3D Display Market?
Asia Pacific leads the 3D display market with 42% share in 2026, and its position rests on manufacturing rather than end-user spending alone. China, South Korea, Japan and Taiwan host almost all panel fabrication capacity, so modules, optical films and driver electronics are produced regionally and integrated locally at lower cost. China also operates the world’s largest base of glasses-free LED advertising walls, installed in major retail and transport districts. Japan supplies precision optical components and professional displays, while South Korea leads in advanced emissive panel development. Consumer handheld products with depth features appear here first because supply chains are adjacent. The main barrier is intense price competition that compresses margins on commodity panels. The opportunity lies in exporting integrated glasses-free modules rather than bare glass to system builders elsewhere.
- Latin America Builds Depth Display Demand Through Retail and Entertainment Venues
Latin America represents 4% share in 2026, the smallest regional position, with activity centred in Brazil, Mexico, Chile and Colombia. Shopping centres, stadiums and entertainment complexes in the largest cities account for most installations, usually large direct-view LED canvases running forced-perspective campaigns for consumer brands. Medical adoption is confined to leading private hospital groups in major urban centres. The barriers are financial rather than technical: display systems are imported and priced in dollars, import duties raise landed cost, and currency volatility complicates multi-year service contracts. Shortages of local calibration and maintenance expertise also lengthen downtime. The most credible opportunity is advertising-funded deployment, where a media owner rather than a venue carries the capital cost and recovers it from campaign revenue over several years.
- Which Region Is Growing Fastest in the 3D Display Market?
Middle East & Africa is growing fastest in the 3D display market, at a 15.0% CAGR between 2026 and 2033 from 6% share in 2026. The United Arab Emirates, Saudi Arabia and Qatar drive this through flagship retail districts, airports, museums and entertainment destinations that treat large glasses-free display walls as landmark attractions rather than ordinary signage. Tourism and giga-project development programmes fund installations at a scale that smaller markets cannot justify, and clients favour visually distinctive technology. Hospital investment in the Gulf states is also adding diagnostic imaging workstations with calibrated displays. South Africa and Egypt represent the main activity elsewhere in Africa. The constraints are a thin regional service base and extreme ambient brightness, which pushes specifications toward high-luminance panels and raises both system and running costs.
Competitive Landscape
The 3D display market is moderately concentrated, and the structure differs sharply by layer. Panel supply is concentrated among a small group of manufacturers including Samsung Display, LG Display, BOE Technology Group, AU Optronics, Innolux Corporation, Sharp Corporation and Japan Display Inc., where capital intensity creates high barriers. System integration is fragmented, with specialists such as Barco, EIZO Corporation, Leia Inc., Looking Glass Factory, Dimenco and Alioscopy serving specific applications. Sony Group Corporation and Panasonic Holdings span both professional systems and components. Consolidation has been limited, partly because several large manufacturers retrenched after the consumer three-dimensional television withdrawal and now treat depth displays as a specialty line rather than a strategic platform.
Competition is based on image quality under real viewing conditions, not on catalogue specifications. Buyers evaluate crosstalk between views, the width and number of usable viewing zones, effective resolution per eye, brightness in ambient light, and whether the vendor supplies a working content pipeline. In medical markets, calibration stability and regulatory clearance outweigh everything else. New entrants arrive from software and optics rather than glass, offering view-synthesis engines and eye-tracking that upgrade conventional panels into depth-capable systems.
Strategic activity centres on partnerships that pair optics specialists with panel manufacturers and content tool developers, since no single firm controls the full stack. Vendors also pursue automotive qualification, because a cluster programme delivers volumes that project-based business cannot. Several suppliers license their optical and rendering technology instead of building displays themselves.
Strategic direction is converging on professional verticals, recurring software revenue and automotive design wins, with little appetite for another consumer-facing push.
Recent Industry Developments
- 2021: MPEG completed the MPEG Immersive Video standard, published as ISO/IEC 23090-12, defining coding for multi-view content with depth – a common compression format lowers the storage and distribution cost that has constrained light field content libraries.
- October 2022: VESA published the DisplayPort 2.1 specification, raising available link bandwidth and tightening cable certification – higher transport capacity is a precondition for multi-view and high-refresh depth displays that send several images per frame.
- January 2025: The HDMI Forum announced the HDMI 2.2 specification, increasing maximum bandwidth over a single cable – this eases the wiring and media-server complexity of large multi-panel glasses-free installations in retail and transport venues.
Companies Covered in the Report
- Samsung Display
- LG Display
- Sony Group Corporation
- Sharp Corporation
- Panasonic Holdings
- BOE Technology Group
- AU Optronics
- Innolux Corporation
- Leia Inc.
- Looking Glass Factory
- Dimenco
- Alioscopy
- Barco
- EIZO Corporation
- Japan Display Inc.
3D Display Market Report Scope
| Metric | Value |
| Study Period | 2020–2033 |
| Market Size 2026 | US$ 8.5 Billion |
| Market Size 2033 | US$ 18.9 Billion |
| CAGR 2026–2033 | 12.1% |
| Absolute Dollar Opportunity | US$ 10.4 Billion |
| Largest Market | Asia Pacific (42% share in 2026) |
| Fastest-Growing Market | Middle East & Africa (15.0% CAGR) |
| Market Concentration | Medium |
| Major Players | Samsung Display, LG Display, Sony Group Corporation, BOE Technology Group, Barco |
3D Display Market Segmentation
Display Technology
- Stereoscopic Displays
- Autostereoscopic Displays
- Light Field Displays
- Volumetric & Holographic Displays
Panel Type
- LCD
- OLED
- Direct-view LED
- MicroLED
Application
- Digital Signage & Advertising
- Medical Imaging & Diagnostics
- Design & Engineering Visualization
- Simulation & Training
- Automotive Displays
- Consumer Devices
Component
- Display Panels & Modules
- Optical Films & Lens Arrays
- Controllers & Processors
- Software & Content Tools
Regions
- North America
- Europe
- Asia Pacific
- Latin America
- Middle East & Africa
- Executive Summary
- Global 3D Display Market Snapshot
- Future Projections
- Key Report Takeaways
- Regional Snapshot
- Market Overview
- Market Definition and Report Scope
- Historical Trends 2020–2025
- Market Dynamics
- Drivers
- Depth Perception in Surgical and Engineering Review Sustains Professional Display Demand
- Glasses-Free LED Advertising Walls Convert Depth Into Measurable Footfall
- Restraints
- Thin Native Content Libraries Restrict 3D Display Sales Beyond Captive Workflows
- Visual Fatigue and Crosstalk Cap Session Length and Deployment Scale
- Market Opportunities
- Automotive Instrument Clusters Open a High-Volume Depth Display Programme Pool
- Light Field Surgical Planning Systems Create a Clinical Revenue Stream Beyond Radiology
- Drivers
- Global 3D Display Market Outlook, 2020–2033
- Global 3D Display Market Outlook, by Display Technology, Value (US$ Billion), 2020–2033
- Stereoscopic Displays
- Autostereoscopic Displays
- Light Field Displays
- Volumetric & Holographic Displays
- Global 3D Display Market Outlook, by Panel Type, Value (US$ Billion), 2020–2033
- LCD
- OLED
- Direct-view LED
- MicroLED
- Global 3D Display Market Outlook, by Application, Value (US$ Billion), 2020–2033
- Digital Signage & Advertising
- Medical Imaging & Diagnostics
- Design & Engineering Visualization
- Simulation & Training
- Automotive Displays
- Consumer Devices
- Global 3D Display Market Outlook, by Component, Value (US$ Billion), 2020–2033
- Display Panels & Modules
- Optical Films & Lens Arrays
- Controllers & Processors
- Software & Content Tools
- Global 3D Display Market Outlook, by Region, Value (US$ Billion), 2020–2033
- North America
- Europe
- Asia Pacific
- Latin America
- Middle East & Africa
- Global 3D Display Market Outlook, by Display Technology, Value (US$ Billion), 2020–2033
- North America 3D Display Market Outlook, 2020–2033
- North America 3D Display Market Outlook, by Display Technology, Value (US$ Billion), 2020–2033
- Stereoscopic Displays
- Autostereoscopic Displays
- Light Field Displays
- Volumetric & Holographic Displays
- North America 3D Display Market Outlook, by Panel Type, Value (US$ Billion), 2020–2033
- LCD
- OLED
- Direct-view LED
- MicroLED
- North America 3D Display Market Outlook, by Application, Value (US$ Billion), 2020–2033
- Digital Signage & Advertising
- Medical Imaging & Diagnostics
- Design & Engineering Visualization
- Simulation & Training
- Automotive Displays
- Consumer Devices
- North America 3D Display Market Outlook, by Component, Value (US$ Billion), 2020–2033
- Display Panels & Modules
- Optical Films & Lens Arrays
- Controllers & Processors
- Software & Content Tools
- North America 3D Display Market Outlook, by Country, Value (US$ Billion), 2020–2033
- United States 3D Display Market Outlook, by Display Technology, 2020–2033
- United States 3D Display Market Outlook, by Panel Type, 2020–2033
- United States 3D Display Market Outlook, by Application, 2020–2033
- United States 3D Display Market Outlook, by Component, 2020–2033
- Canada 3D Display Market Outlook, by Display Technology, 2020–2033
- Canada 3D Display Market Outlook, by Panel Type, 2020–2033
- Canada 3D Display Market Outlook, by Application, 2020–2033
- Canada 3D Display Market Outlook, by Component, 2020–2033
- North America 3D Display Market Outlook, by Display Technology, Value (US$ Billion), 2020–2033
- Europe 3D Display Market Outlook, 2020–2033
- Europe 3D Display Market Outlook, by Display Technology, Value (US$ Billion), 2020–2033
- Stereoscopic Displays
- Autostereoscopic Displays
- Light Field Displays
- Volumetric & Holographic Displays
- Europe 3D Display Market Outlook, by Panel Type, Value (US$ Billion), 2020–2033
- LCD
- OLED
- Direct-view LED
- MicroLED
- Europe 3D Display Market Outlook, by Application, Value (US$ Billion), 2020–2033
- Digital Signage & Advertising
- Medical Imaging & Diagnostics
- Design & Engineering Visualization
- Simulation & Training
- Automotive Displays
- Consumer Devices
- Europe 3D Display Market Outlook, by Component, Value (US$ Billion), 2020–2033
- Display Panels & Modules
- Optical Films & Lens Arrays
- Controllers & Processors
- Software & Content Tools
- Europe 3D Display Market Outlook, by Country, Value (US$ Billion), 2020–2033
- Germany 3D Display Market Outlook, by Display Technology, 2020–2033
- Germany 3D Display Market Outlook, by Panel Type, 2020–2033
- Germany 3D Display Market Outlook, by Application, 2020–2033
- Germany 3D Display Market Outlook, by Component, 2020–2033
- France 3D Display Market Outlook, by Display Technology, 2020–2033
- France 3D Display Market Outlook, by Panel Type, 2020–2033
- France 3D Display Market Outlook, by Application, 2020–2033
- France 3D Display Market Outlook, by Component, 2020–2033
- United Kingdom 3D Display Market Outlook, by Display Technology, 2020–2033
- United Kingdom 3D Display Market Outlook, by Panel Type, 2020–2033
- United Kingdom 3D Display Market Outlook, by Application, 2020–2033
- United Kingdom 3D Display Market Outlook, by Component, 2020–2033
- Italy 3D Display Market Outlook, by Display Technology, 2020–2033
- Italy 3D Display Market Outlook, by Panel Type, 2020–2033
- Italy 3D Display Market Outlook, by Application, 2020–2033
- Italy 3D Display Market Outlook, by Component, 2020–2033
- Nordic countries 3D Display Market Outlook, by Display Technology, 2020–2033
- Nordic countries 3D Display Market Outlook, by Panel Type, 2020–2033
- Nordic countries 3D Display Market Outlook, by Application, 2020–2033
- Nordic countries 3D Display Market Outlook, by Component, 2020–2033
- Europe 3D Display Market Outlook, by Display Technology, Value (US$ Billion), 2020–2033
- Asia Pacific 3D Display Market Outlook, 2020–2033
- Asia Pacific 3D Display Market Outlook, by Display Technology, Value (US$ Billion), 2020–2033
- Stereoscopic Displays
- Autostereoscopic Displays
- Light Field Displays
- Volumetric & Holographic Displays
- Asia Pacific 3D Display Market Outlook, by Panel Type, Value (US$ Billion), 2020–2033
- LCD
- OLED
- Direct-view LED
- MicroLED
- Asia Pacific 3D Display Market Outlook, by Application, Value (US$ Billion), 2020–2033
- Digital Signage & Advertising
- Medical Imaging & Diagnostics
- Design & Engineering Visualization
- Simulation & Training
- Automotive Displays
- Consumer Devices
- Asia Pacific 3D Display Market Outlook, by Component, Value (US$ Billion), 2020–2033
- Display Panels & Modules
- Optical Films & Lens Arrays
- Controllers & Processors
- Software & Content Tools
- Asia Pacific 3D Display Market Outlook, by Country, Value (US$ Billion), 2020–2033
- China 3D Display Market Outlook, by Display Technology, 2020–2033
- China 3D Display Market Outlook, by Panel Type, 2020–2033
- China 3D Display Market Outlook, by Application, 2020–2033
- China 3D Display Market Outlook, by Component, 2020–2033
- South Korea 3D Display Market Outlook, by Display Technology, 2020–2033
- South Korea 3D Display Market Outlook, by Panel Type, 2020–2033
- South Korea 3D Display Market Outlook, by Application, 2020–2033
- South Korea 3D Display Market Outlook, by Component, 2020–2033
- Japan 3D Display Market Outlook, by Display Technology, 2020–2033
- Japan 3D Display Market Outlook, by Panel Type, 2020–2033
- Japan 3D Display Market Outlook, by Application, 2020–2033
- Japan 3D Display Market Outlook, by Component, 2020–2033
- Taiwan 3D Display Market Outlook, by Display Technology, 2020–2033
- Taiwan 3D Display Market Outlook, by Panel Type, 2020–2033
- Taiwan 3D Display Market Outlook, by Application, 2020–2033
- Taiwan 3D Display Market Outlook, by Component, 2020–2033
- Asia Pacific 3D Display Market Outlook, by Display Technology, Value (US$ Billion), 2020–2033
- Latin America 3D Display Market Outlook, 2020–2033
- Latin America 3D Display Market Outlook, by Display Technology, Value (US$ Billion), 2020–2033
- Stereoscopic Displays
- Autostereoscopic Displays
- Light Field Displays
- Volumetric & Holographic Displays
- Latin America 3D Display Market Outlook, by Panel Type, Value (US$ Billion), 2020–2033
- LCD
- OLED
- Direct-view LED
- MicroLED
- Latin America 3D Display Market Outlook, by Application, Value (US$ Billion), 2020–2033
- Digital Signage & Advertising
- Medical Imaging & Diagnostics
- Design & Engineering Visualization
- Simulation & Training
- Automotive Displays
- Consumer Devices
- Latin America 3D Display Market Outlook, by Component, Value (US$ Billion), 2020–2033
- Display Panels & Modules
- Optical Films & Lens Arrays
- Controllers & Processors
- Software & Content Tools
- Latin America 3D Display Market Outlook, by Country, Value (US$ Billion), 2020–2033
- Brazil 3D Display Market Outlook, by Display Technology, 2020–2033
- Brazil 3D Display Market Outlook, by Panel Type, 2020–2033
- Brazil 3D Display Market Outlook, by Application, 2020–2033
- Brazil 3D Display Market Outlook, by Component, 2020–2033
- Mexico 3D Display Market Outlook, by Display Technology, 2020–2033
- Mexico 3D Display Market Outlook, by Panel Type, 2020–2033
- Mexico 3D Display Market Outlook, by Application, 2020–2033
- Mexico 3D Display Market Outlook, by Component, 2020–2033
- Chile 3D Display Market Outlook, by Display Technology, 2020–2033
- Chile 3D Display Market Outlook, by Panel Type, 2020–2033
- Chile 3D Display Market Outlook, by Application, 2020–2033
- Chile 3D Display Market Outlook, by Component, 2020–2033
- Colombia 3D Display Market Outlook, by Display Technology, 2020–2033
- Colombia 3D Display Market Outlook, by Panel Type, 2020–2033
- Colombia 3D Display Market Outlook, by Application, 2020–2033
- Colombia 3D Display Market Outlook, by Component, 2020–2033
- Latin America 3D Display Market Outlook, by Display Technology, Value (US$ Billion), 2020–2033
- Middle East & Africa 3D Display Market Outlook, 2020–2033
- Middle East & Africa 3D Display Market Outlook, by Display Technology, Value (US$ Billion), 2020–2033
- Stereoscopic Displays
- Autostereoscopic Displays
- Light Field Displays
- Volumetric & Holographic Displays
- Middle East & Africa 3D Display Market Outlook, by Panel Type, Value (US$ Billion), 2020–2033
- LCD
- OLED
- Direct-view LED
- MicroLED
- Middle East & Africa 3D Display Market Outlook, by Application, Value (US$ Billion), 2020–2033
- Digital Signage & Advertising
- Medical Imaging & Diagnostics
- Design & Engineering Visualization
- Simulation & Training
- Automotive Displays
- Consumer Devices
- Middle East & Africa 3D Display Market Outlook, by Component, Value (US$ Billion), 2020–2033
- Display Panels & Modules
- Optical Films & Lens Arrays
- Controllers & Processors
- Software & Content Tools
- Middle East & Africa 3D Display Market Outlook, by Country, Value (US$ Billion), 2020–2033
- United Arab Emirates 3D Display Market Outlook, by Display Technology, 2020–2033
- United Arab Emirates 3D Display Market Outlook, by Panel Type, 2020–2033
- United Arab Emirates 3D Display Market Outlook, by Application, 2020–2033
- United Arab Emirates 3D Display Market Outlook, by Component, 2020–2033
- Saudi Arabia 3D Display Market Outlook, by Display Technology, 2020–2033
- Saudi Arabia 3D Display Market Outlook, by Panel Type, 2020–2033
- Saudi Arabia 3D Display Market Outlook, by Application, 2020–2033
- Saudi Arabia 3D Display Market Outlook, by Component, 2020–2033
- Qatar 3D Display Market Outlook, by Display Technology, 2020–2033
- Qatar 3D Display Market Outlook, by Panel Type, 2020–2033
- Qatar 3D Display Market Outlook, by Application, 2020–2033
- Qatar 3D Display Market Outlook, by Component, 2020–2033
- South Africa 3D Display Market Outlook, by Display Technology, 2020–2033
- South Africa 3D Display Market Outlook, by Panel Type, 2020–2033
- South Africa 3D Display Market Outlook, by Application, 2020–2033
- South Africa 3D Display Market Outlook, by Component, 2020–2033
- Egypt 3D Display Market Outlook, by Display Technology, 2020–2033
- Egypt 3D Display Market Outlook, by Panel Type, 2020–2033
- Egypt 3D Display Market Outlook, by Application, 2020–2033
- Egypt 3D Display Market Outlook, by Component, 2020–2033
- Middle East & Africa 3D Display Market Outlook, by Display Technology, Value (US$ Billion), 2020–2033
- Competitive Landscape
- Market Concentration and Industry Leaders
- Competitive Differentiation
- Strategic Moves and Market Direction
- Recent Industry Developments
- Company Profiles
- Samsung Display
- LG Display
- Sony Group Corporation
- Sharp Corporation
- Panasonic Holdings
- BOE Technology Group
- AU Optronics
- Innolux Corporation
- Leia Inc.
- Looking Glass Factory
- Dimenco
- Alioscopy
- Barco
- EIZO Corporation
- Japan Display Inc.
- Appendix
- Research Methodology
- Report Assumptions
- Acronyms and Abbreviations
Display Technology
- Stereoscopic Displays
- Autostereoscopic Displays
- Light Field Displays
- Volumetric & Holographic Displays
Panel Type
- LCD
- OLED
- Direct-view LED
- MicroLED
Application
- Digital Signage & Advertising
- Medical Imaging & Diagnostics
- Design & Engineering Visualization
- Simulation & Training
- Automotive Displays
- Consumer Devices
Component
- Display Panels & Modules
- Optical Films & Lens Arrays
- Controllers & Processors
- Software & Content Tools
Regions
- North America
- Europe
- Asia Pacific
- Latin America
- Middle East & Africa
Our Research Methodology
Considering the volatility of business today, traditional approaches to strategizing a game plan can be unfruitful if not detrimental. True ambiguity is no way to determine a forecast. A myriad of predetermined factors must be accounted for such as the degree of risk involved, the magnitude of circumstances, as well as conditions or consequences that are not known or unpredictable. To circumvent binary views that cast uncertainty, the application of market research intelligence to strategically posture, move, and enable actionable outcomes is necessary.
View Methodology
Quality Assured
Rigorous Validation Process

Confidentiality Assured
End-to-end Data Security

Custom Research Services
Tailored To Your Objectives
FAQs
The market is valued at US$ 8.5 billion in 2026, counting finished display systems with their panels, optical layers, controllers and enclosures worldwide.
It is projected to reach US$ 18.9 billion by 2033 at a 12.1% CAGR, representing US$ 10.4 billion of absolute dollar opportunity.
Stereoscopic Displays lead with 44% share in 2026, because glasses-based systems deliver full panel resolution per eye at predictable cost for professional users.
MicroLED panels grow fastest at a 18.4% CAGR, as their brightness keeps glasses-free depth effects legible in daylit retail, transport and vehicle environments.
Asia Pacific holds 42% share in 2026, because almost all panel fabrication, optical film and driver electronics capacity is located in the region.
Related Reports
3D Glasses Market Size, Share, Insights, Competitive Landscape, and Forecast 2026 to 2033
The global 3D glasses market is valued at US$16.65 billion in 2026, reaching US$22.06 billion by 2033, growing at a 4.1% CAGR
3D Electronics / Additive Electronics Market Size, Share, Insights, Competitive Landscape, and Forecast 2026 to 2033
The global 3D electronics / additive electronics market is valued at US$1.2 billion in 2026, reaching US$3.8 billion by 2033, growing at a 17.9% CAGR
360 Degree Camera Market Size, Share, Insights, Competitive Landscape, and Forecast 2026 to 2033
The global 360 degree camera market is valued at US$1.86 billion in 2026, reaching US$4.20 billion by 2033, growing at a 12.3% CAGR
3D Camera Market Size, Share, Insights, Competitive Landscape, and Forecast 2026 to 2033
The global 3D camera market is valued at US$1.86 billion in 2026, reaching US$5.58 billion by 2033, growing at a 17.0% CAGR
2D Material Transistor Market Size, Share, Insights, Competitive Landscape, and Forecast 2026 to 2033
The global 2D material transistor market is valued at US$0.2 billion in 2026, reaching US$0.9 billion by 2033, growing at a 24.0% CAGR
2D Barcode Reader Market Size, Share, Insights, Competitive Landscape, and Forecast 2026 to 2033
The global 2D barcode reader market is valued at US$4.8 billion in 2026, reaching US$8.6 billion by 2033, growing at an 8.7% CAGR